7 Mistakes Using Moving Averages in Swing Trading

Moving averages can help organize a swing-trading strategy, but they cannot replace its entry, exit and risk rules. Common mistakes include confusing chart timeframes with lookback lengths, changing settings after every loss and treating several similar indicators as independent confirmation.
These seven corrections explain how to make your analysis more consistent. Use LuxAlgo’s native charts to inspect the setup and Quant, our coding agent, to help turn precise rules into a strategy you can review and test. None of the settings below is a universal prescription for profitable trading.
1. Treating One Moving Average as a Complete Trading Plan
Using a single average is not inherently a mistake. A simple strategy can be easier to evaluate than a complicated one. The problem is deciding to buy because price is “near the 50-day average” without defining what qualifies as an entry, how much to buy or when to exit.
For a research example, distinguish a touch of the average from a completed close crossing above it. State whether a signal creates an order at the next session’s open, whether additional entries are allowed and how an existing position is closed. A moving-average exit evaluated at the daily close is different from a protective stop that can trigger during the session.
Adding a second average only helps the specification if it has a defined role. It might be a trend filter, an entry trigger or an exit reference. Test that addition against the simpler baseline using the same data, costs and risk assumptions.
2. Confusing Timeframe with Moving-Average Length
A chart timeframe determines the interval represented by a bar. The lookback length determines how many observations feed the calculation. The 20-day, 50-day and 200-day averages on a daily chart are three lengths on one timeframe—not three timeframes.
| Configuration | What it uses | What to specify |
|---|---|---|
| 20 SMA on daily bars | The most recent 20 daily source values | Session, source price and corporate-action adjustment |
| 20 SMA on 4-hour bars | The most recent 20 four-hour source values | Session boundaries and any partial bars |
| 20 SMA on weekly bars | The most recent 20 weekly source values | Whether the current week is completed |
A planned holding period of five to ten days does not prove that a 20- or 50-day average will outperform a 200-day filter. Choose the interval around the decisions you can actually make, then evaluate the rule. A daily signal cannot assume an intraday exit you were not monitoring or had not placed as an order.
When combining weekly context with daily entries, use the latest completed weekly value available at the daily decision time. Using Friday’s final weekly close to justify a Tuesday trade introduces information that was not yet known.
3. Adding Averages Without Assigning Them a Job
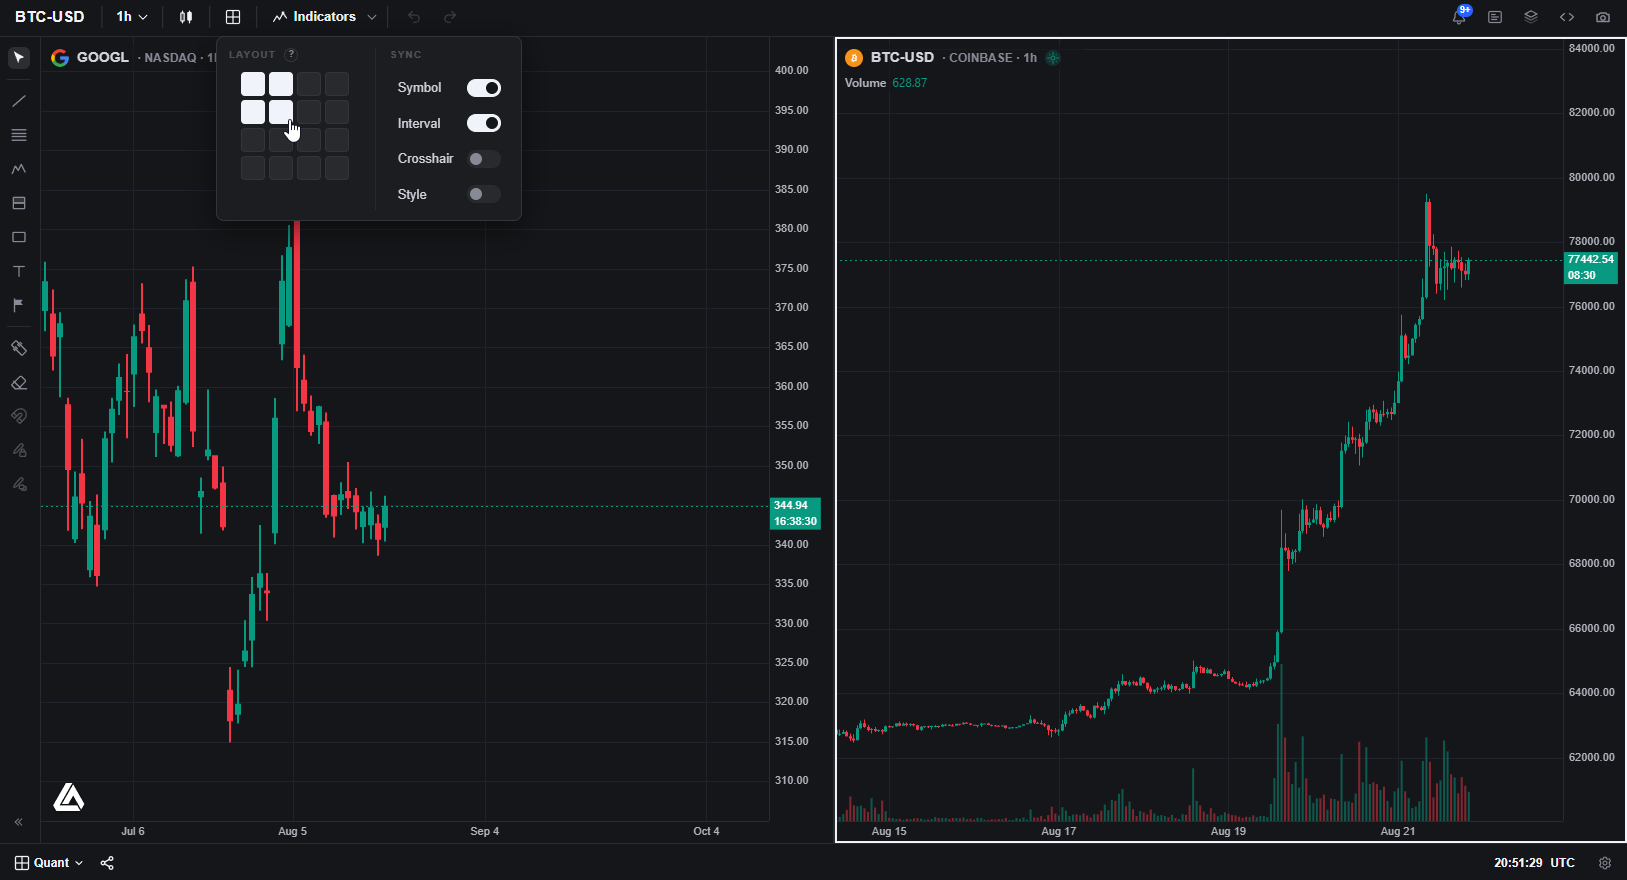
There is no universal research-backed cutoff at three moving averages. A ribbon may have a defined purpose, while two unused averages may still add confusion. The practical question is whether each line changes a decision according to written rules.
Label every average with its source, length, timeframe and purpose. Remove an unused average from the decision process if you cannot explain its role. Avoid switching your attention to whichever average supports the trade you already want to take.
For example, a 50 SMA could restrict long entries while a 20 SMA defines a price-crossing trigger. If you add a 200 SMA, specify whether it must also be below price or whether it is merely visual context. Those choices produce different strategies and should not be mixed in the same results.
4. Ignoring Price Structure and Signal Availability
An average summarizes prices; it does not identify every relevant level. A price cross above an SMA can occur inside a range, below prior resistance or immediately before an earnings announcement. Define which of those conditions matter to your plan rather than treating an upward cross as a complete explanation.
If the strategy requires a range breakout, one reproducible boundary is the highest high of the preceding 20 completed bars, excluding the current bar. If it instead uses a swing high confirmed by later bars, record when that confirmation became available. A level drawn back onto a historical pivot was not necessarily actionable at the pivot itself.
Price patterns and support/resistance tools are not automatically leading or independent evidence. Review their definitions and timing. Volume may provide additional context, but a high-volume move can fail too; define the comparison period and how missing or tick-volume data is handled.
5. Changing Settings Reactively When Volatility Rises
“Always shorten the average in volatile markets” is not a reliable rule. A shorter lookback may respond sooner, but it can also produce more reversals and transaction costs. Keeping a fixed length is a legitimate baseline. An adaptive alternative needs a defined volatility measure, switching threshold and timing that can be tested without hindsight.
Separate changes to the signal from changes to exposure. If a stock’s planned entry-to-stop distance increases from $2 to $4, a hypothetical $100 price-risk budget corresponds to 50 shares in the first case and 25 in the second, before costs. That calculation changes position size without changing the moving-average signal. It is an example, not a recommended risk budget.
Swing trades can remain exposed overnight and across weekends. An earnings gap can skip a stop price, so the planned distance is not a guaranteed maximum loss. Consider combined exposure across correlated positions, not only the risk estimate for one trade.
6. Choosing SMA, EMA or WMA from Performance Labels
The difference is how observations are weighted. An SMA weights its lookback equally. An EMA applies exponentially declining weights to older observations. A conventional linear WMA assigns progressively larger weights to newer values within its window. These mechanics do not establish that one type is best for short trades, multi-week holds or volatile markets. See the moving-average calculation reference.
Compare types using the same source, length and trading rules first. Inspect the resulting trades, turnover and drawdown after costs. Faster responsiveness may change the timing of both winning and losing trades; it is not proof of outperformance. Initialization history also matters, particularly when comparing recursive calculations over a short dataset.
7. Treating Additional Indicators as Proof
Other tools should answer a specific question. RSI might define a momentum condition, while volume could describe participation. MACD and Bollinger Bands themselves incorporate moving averages, so agreement among them is not a collection of independent votes.
A complete strategy does not require a fixed number of confirmations. Add a filter only after defining its role, then compare results with and without it. Fewer losing trades may come with fewer winning trades, reduced exposure and a smaller sample. Review net results and drawdown as well as win rate.
On LuxAlgo, describe the intended entries, exits and risk rules to Quant. Review the generated script in Code before Run, then inspect individual simulated trades. Inputs control exposed parameters; Properties control assumptions such as capital, order size, commission and slippage. Successful execution is not proof of correct logic or a profitable strategy.
A Practical Review Routine for Swing Traders
- Before testing: Write the symbol, session, source price, timeframe, MA type and length, entry, exit and risk rules.
- During testing: Check signal availability and fills. Allow enough calculation history and use consistent costs and treatment of open positions.
- Before changing settings: Record the reason and preserve the original result. Reserve data that did not select the new settings for evaluation.
- While observing new trades: Record the planned decision and actual execution, including gaps, slippage and rule deviations.
- At review: Compare the strategy’s results with execution quality. Do not assume every loss means the average needs changing.
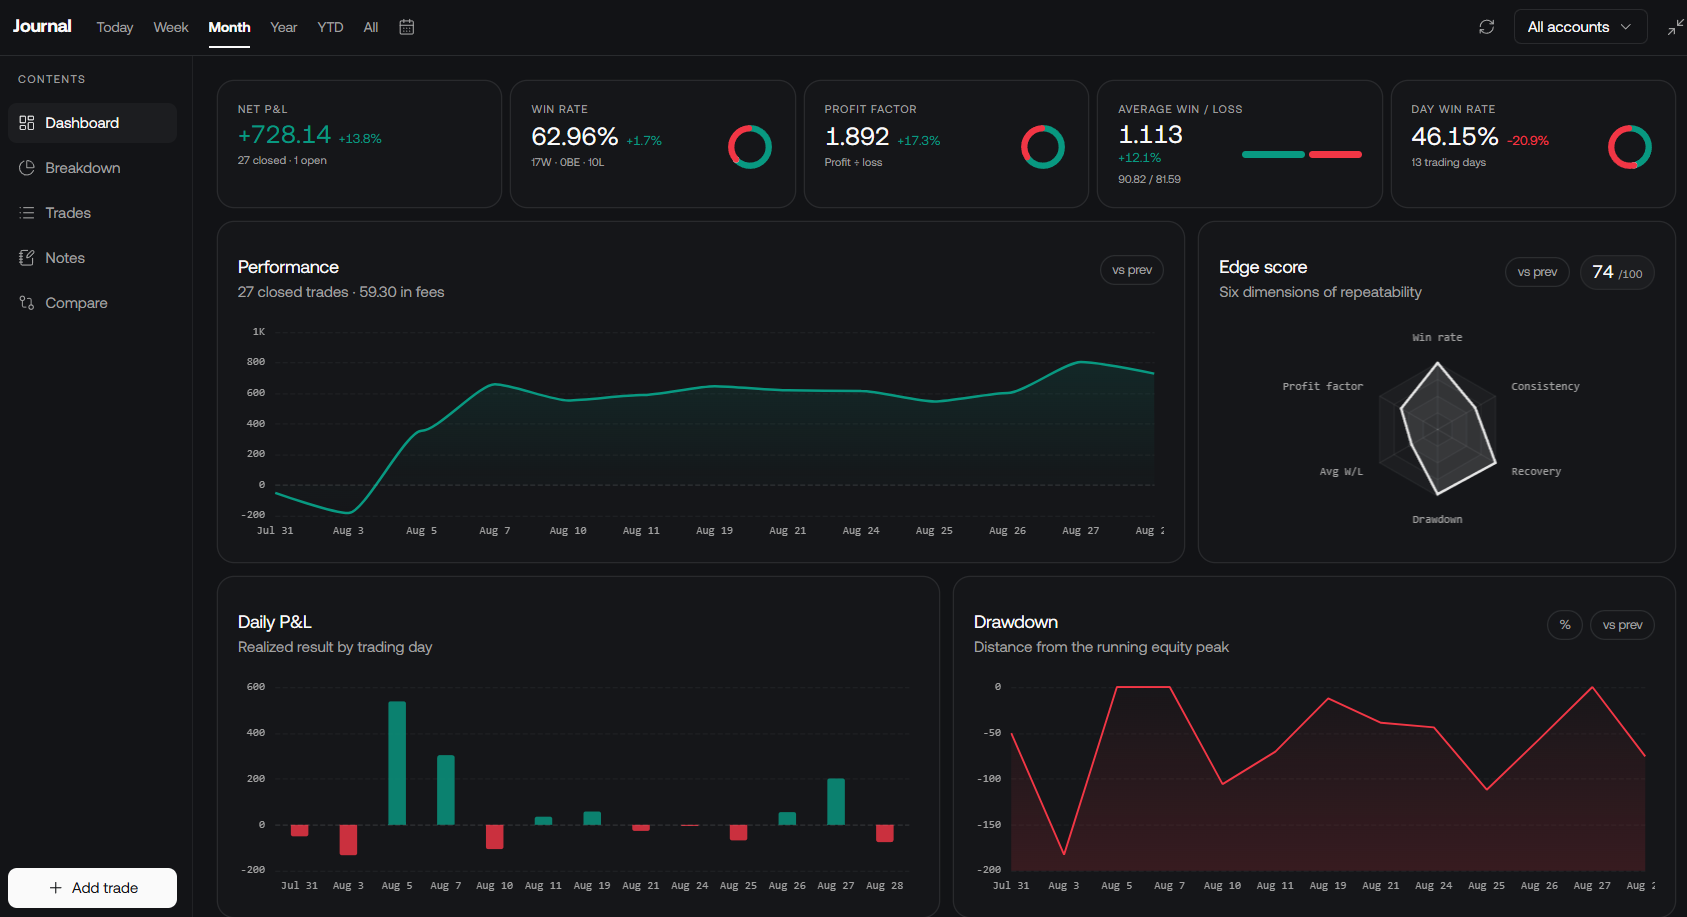
Use the LuxAlgo Journal to review recorded trades, notes and tags. It belongs to your account rather than a specific workspace. Manual accounts, supported imports and available broker connections provide different ways to add records. Keep observations about skipped setups separately when they do not create fills.
The goal is a process you can explain and repeat: clear rules, realistic assumptions and a record of what happened. LuxAlgo charts, Quant and Journal can support that work, while the evidence determines whether a particular moving-average approach deserves further testing.
FAQs
What are the mistakes in swing trading?
Common mistakes include incomplete entry and exit rules, confusing timeframes with indicator lengths, changing settings after losses, overlooking overnight gaps and treating indicator agreement as proof. Define the strategy and exposure in advance, test realistic execution and costs, and review actual decisions separately from their outcomes.
Read next