Learn the 7 common mistakes traders make with the stochastic oscillator and how to avoid them for successful swing trading.
The stochastic oscillator is a powerful indicator for swing traders, but it’s easy to misuse. Here are 7 common mistakes and how to avoid them:
- Misreading Overbought/Oversold Levels: Overbought and oversold signals don’t always mean reversals, especially in strong trends. Use market context to interpret signals.
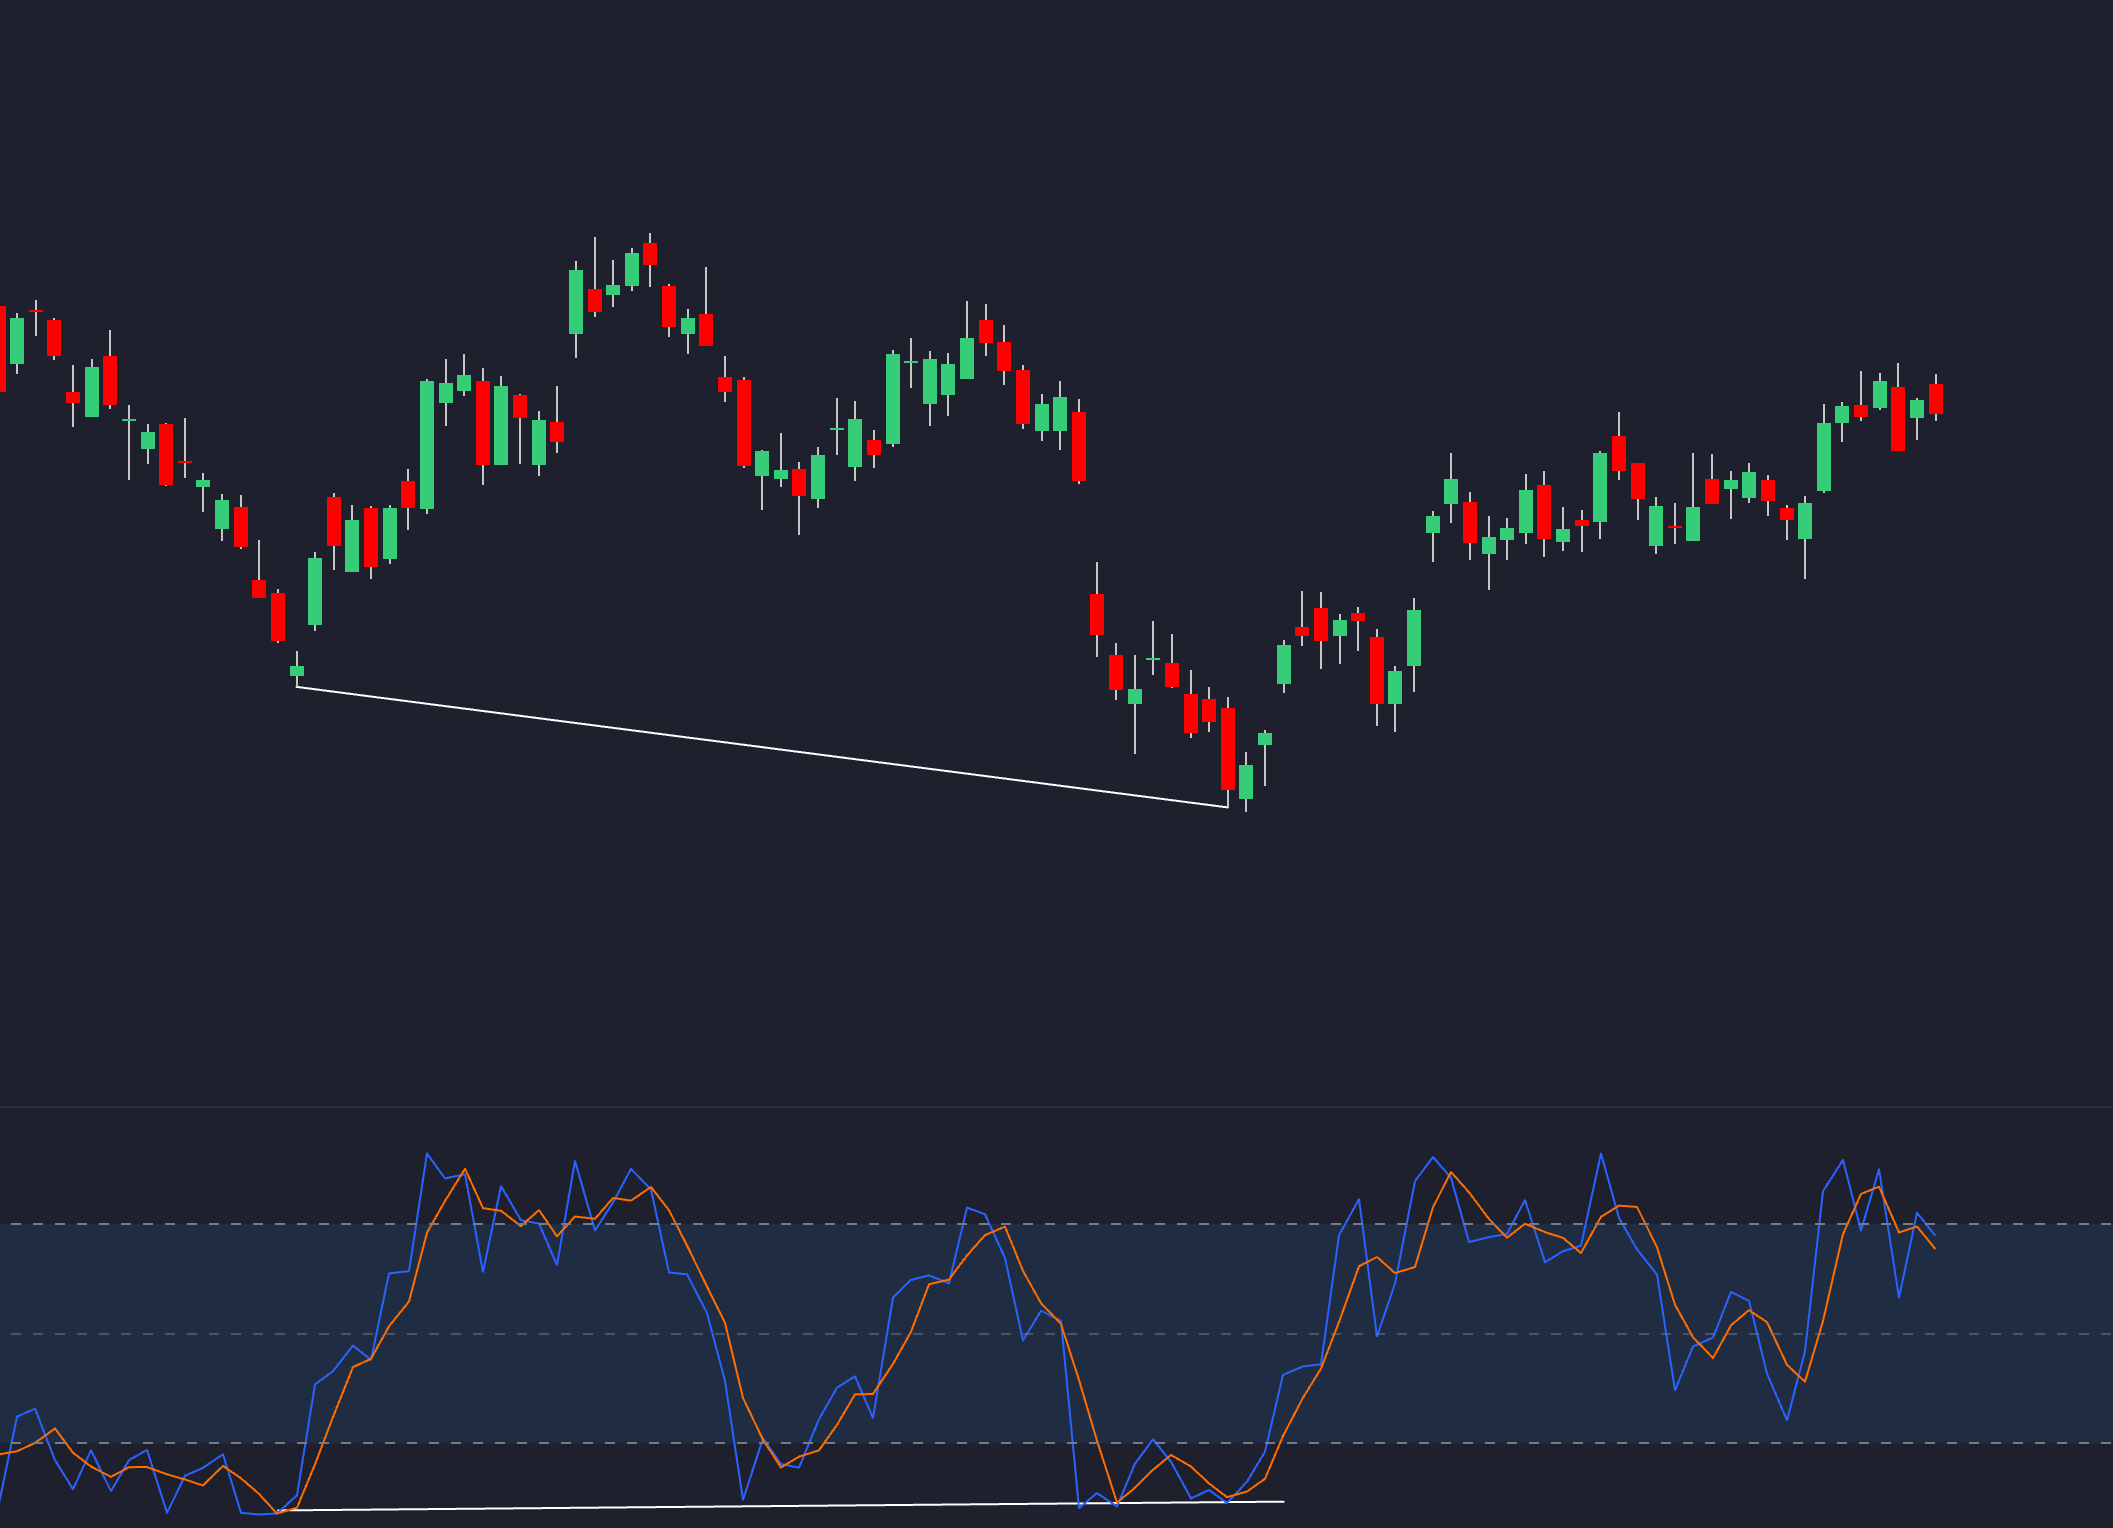
- Ignoring Market Context in Divergence: Divergence doesn’t guarantee reversals. Check trend strength, support/resistance levels, and volume for confirmation.
- Using Incorrect Settings: Default settings (14, 3, 3) don’t work in all markets. Adjust based on market type (e.g., trending, ranging, or volatile).
- Skipping Multi-Timeframe Analysis: Relying on a single timeframe leads to false signals. Align signals across higher, intermediate, and lower timeframes.
- Trading Without Volume Confirmation: Volume validates stochastic signals. Look for volume spikes or trends to confirm momentum.
- Fighting the Market Trend: Avoid trading against the dominant trend. Use stochastic signals to align with the market direction.
- Not Adjusting for Sector Differences: Different sectors (e.g., tech vs. utilities) require tailored settings due to varying volatility.
Quick Overview
| Mistake | Solution |
|---|---|
| Misreading Overbought/Oversold | Use market context and confirmation signals. |
| Ignoring Divergence Context | Check trend strength, volume, and key levels. |
| Using Incorrect Settings | Adjust settings based on market type (e.g., trending or volatile). |
| Skipping Multi-Timeframes | Align signals across higher, intermediate, and lower timeframes. |
| Trading Without Volume Support | Confirm signals with volume patterns like spikes or steady increases. |
| Fighting Market Trend | Trade with the trend, not against it. |
| Not Adjusting for Sectors | Use sector-specific settings for better accuracy. |
Don't Make This Mistake When Using Stochastic
1. Misreading Overbought/Oversold Levels
One mistake swing traders often make is acting on the stochastic oscillator's overbought (above 80) and oversold (below 20) signals without factoring in the market's overall behavior. For instance, in bull markets, the stochastic can stay above 80 for up to 75% of the time, while in bear markets, it can remain below 20 for over 70% of the time[7].
Take the 2017 S&P 500 rally as an example: the stochastic oscillator stayed above 80 for 68% of trading days during a 19% gain. Traders who shorted based solely on overbought signals faced significant losses.
To avoid this trap, here’s how to interpret these signals based on market conditions:
| Market Condition | Signal Interpretation | Recommended Action |
|---|---|---|
| Strong Uptrend | Overbought signals less reliable | Look for oversold signals to buy |
| Strong Downtrend | Oversold signals less reliable | Use overbought signals as exit points |
| Range-bound Market | Both signals more reliable | Trade reversals with proper confirmation |
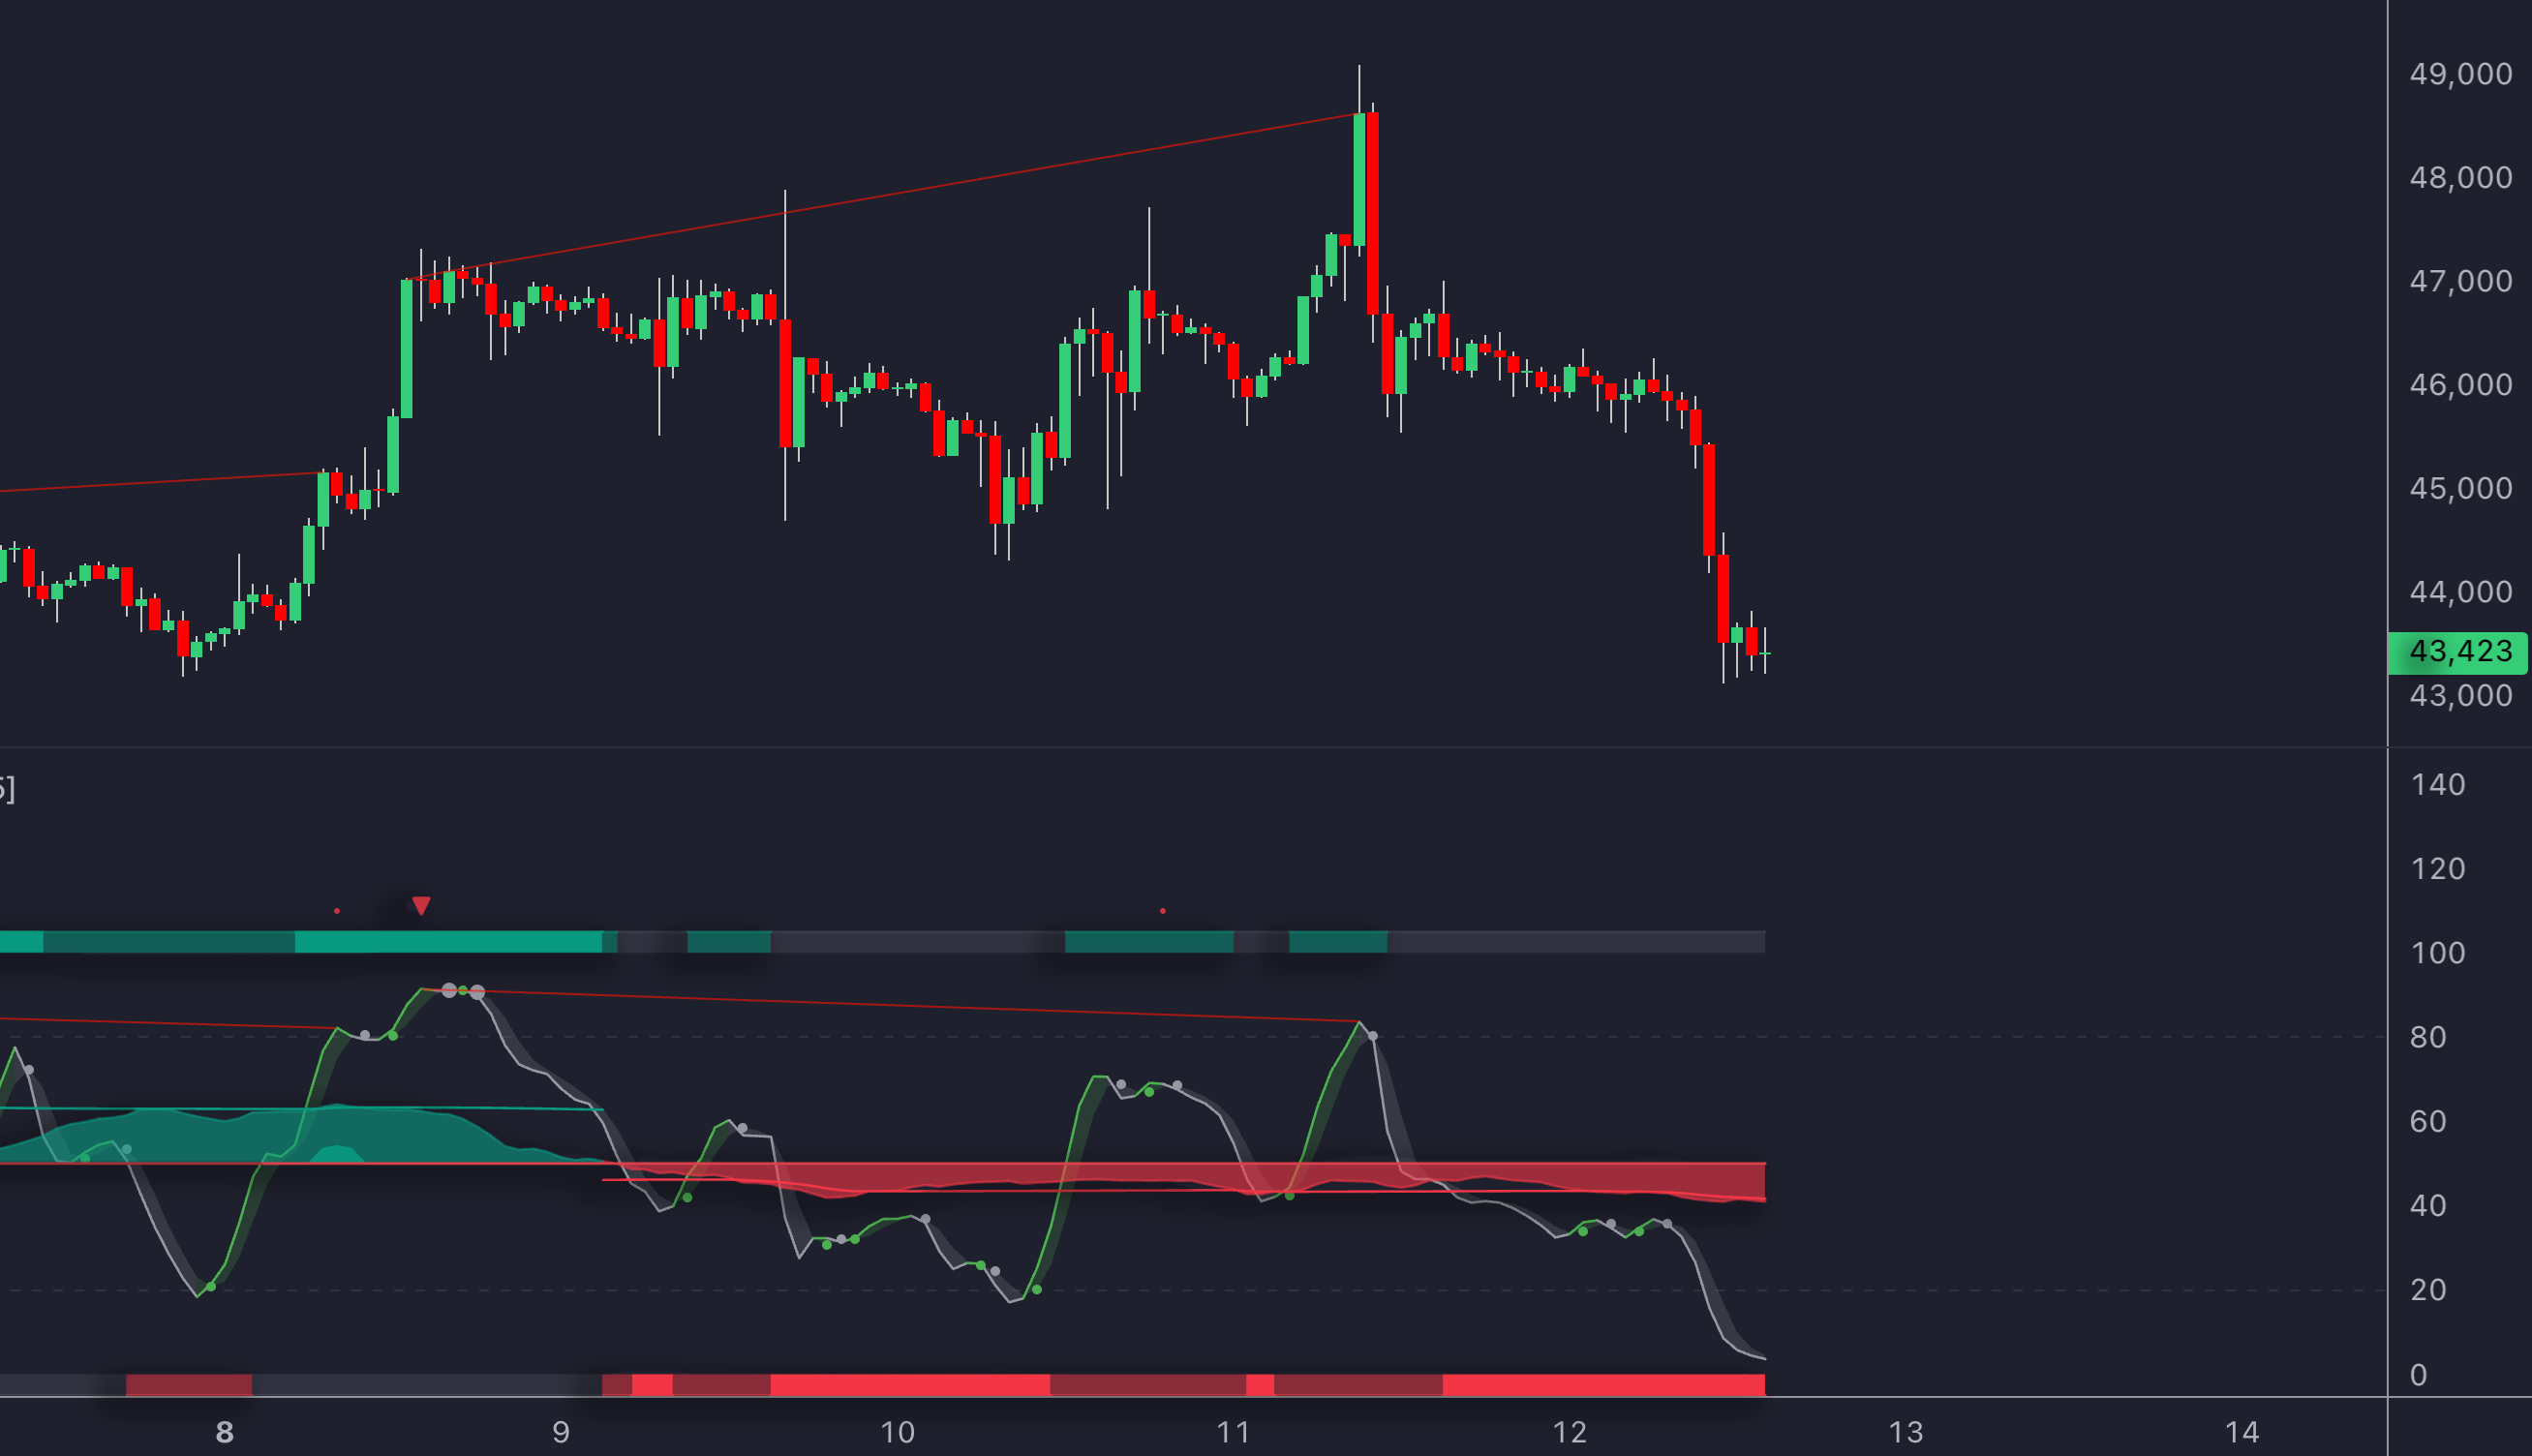
Overbought signals are only meaningful when combined with factors like bearish engulfing patterns, key resistance levels, high volume, or bearish divergence[5].
In highly volatile markets, you might adjust thresholds to 85/15 to filter out unnecessary noise[6]. Treat extreme levels as potential – not guaranteed – reversal areas. Always wait for %K/%D crossovers and price confirmation before making a move.
This approach leads us to the next common error: ignoring divergence within the broader market context.
2. Missing Market Context in Divergence
In August 2023, TSLA displayed bearish divergence but still managed to rally by 22% over the following month, driven by broader tech sector momentum. This highlights the importance of looking beyond indicators when analyzing divergence.
Here are some key factors that can influence the reliability of divergence signals:
- 200-day EMA position: Helps gauge the broader trend.
- Institutional order flow patterns: Indicates where the "big money" is moving.
- VIX volatility index movements: Provides insight into market sentiment and risk appetite.
Experienced traders view divergence as a caution sign, not an automatic signal for reversals. It’s often a cue to adjust positions rather than completely shift strategies[7].
To make sense of divergence signals, keep these in mind:
- Trend Strength: Strong trends are less likely to reverse just because of divergence[5].
- Support/Resistance Levels: Divergence is more meaningful when it occurs near critical price zones.
- Volume Confirmation: Pay attention to whether volume supports the idea of a reversal.
- Multiple Timeframes: Signals on higher timeframes carry more weight than those on lower ones.
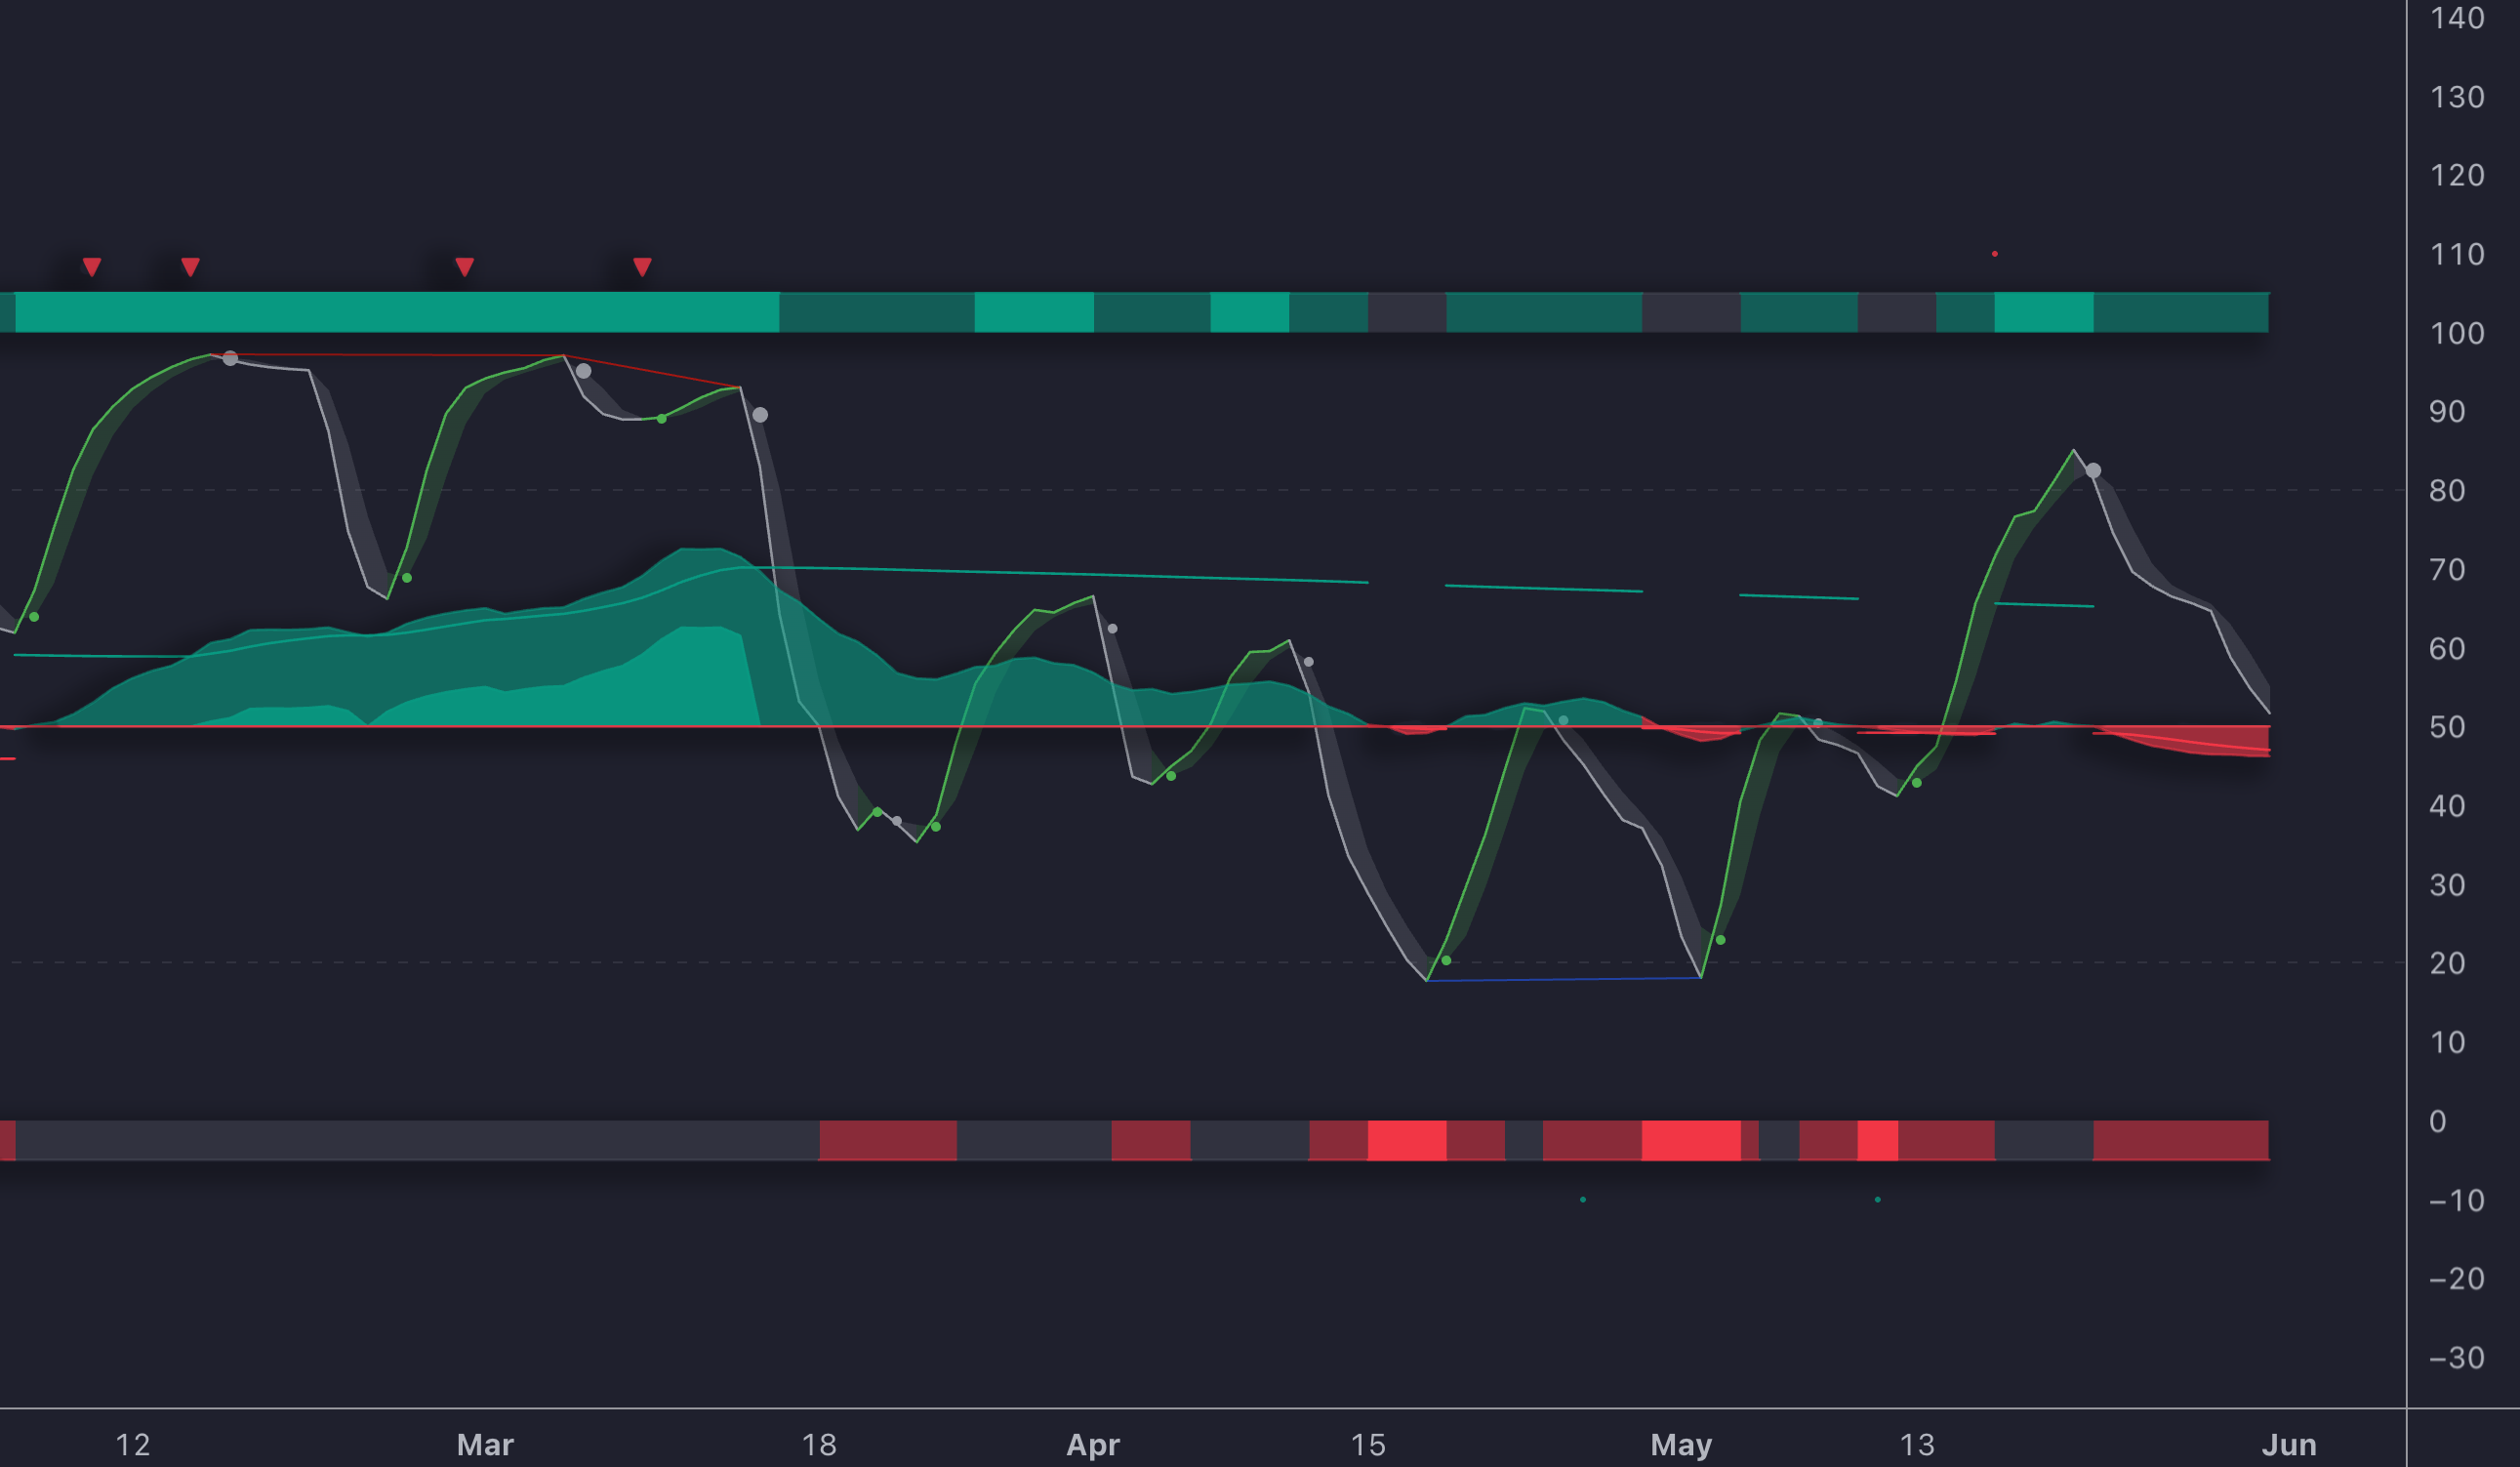
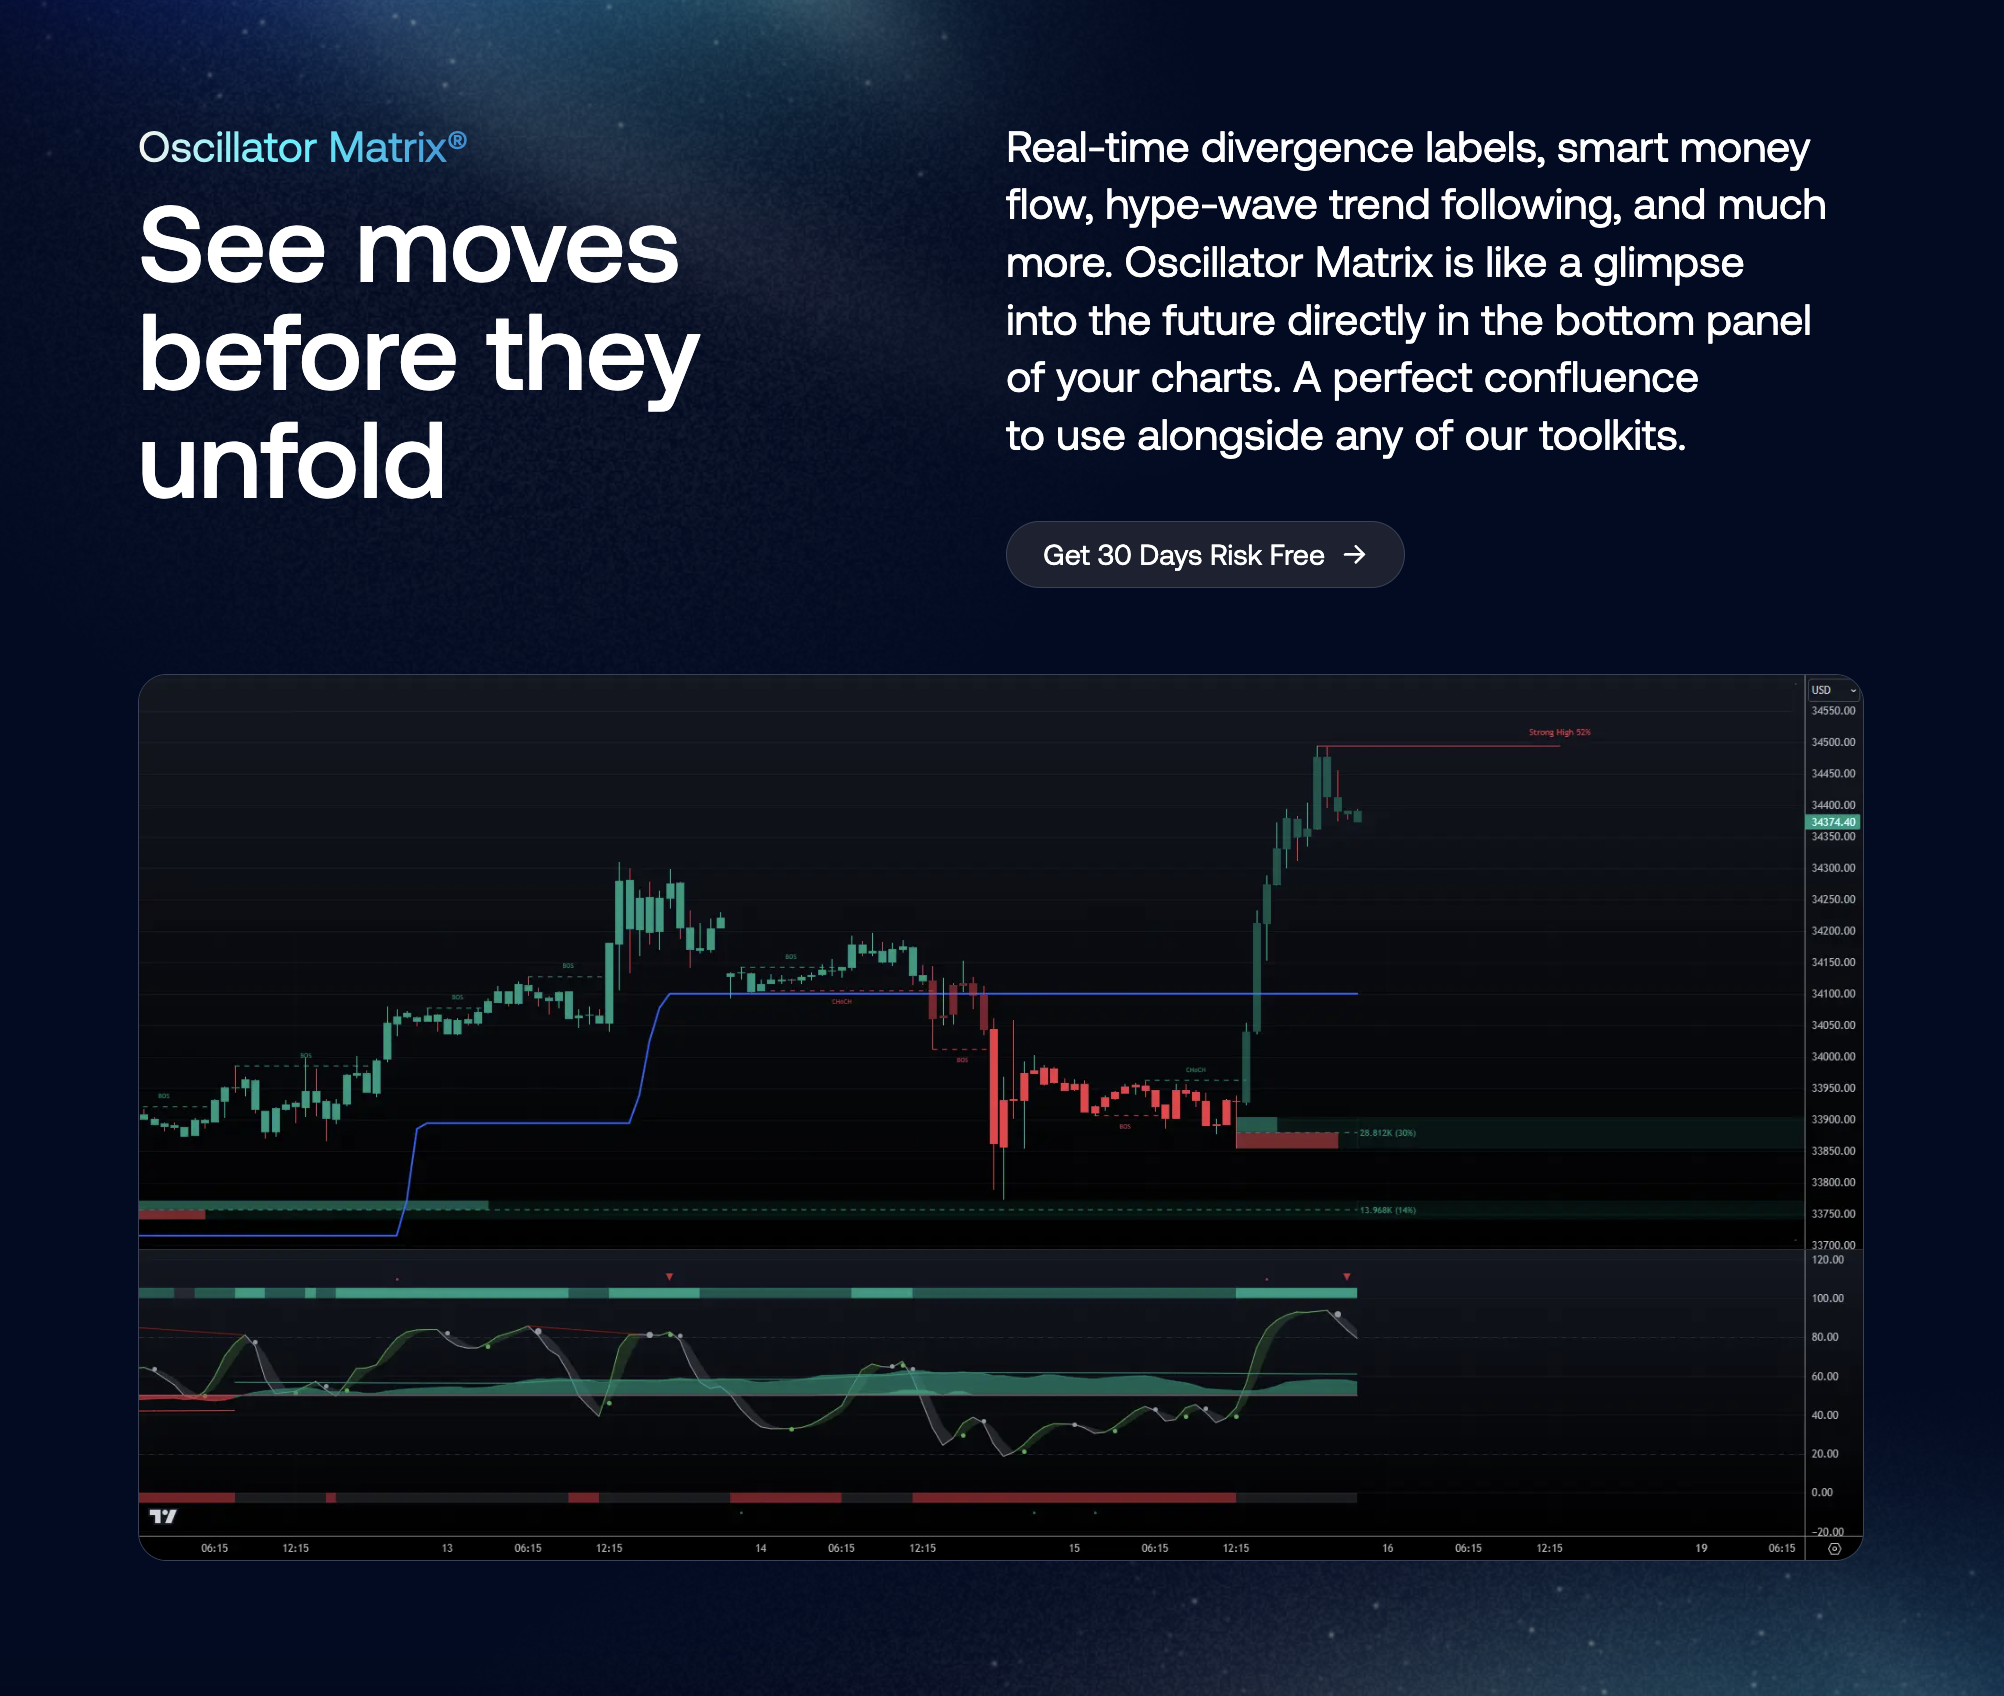
The LuxAlgo platform's Oscillator Matrix simplifies this process by factoring in trend strength and volume data, making divergence analysis more context-aware.
One more tip: Hidden divergence, which supports the current trend, often proves more dependable than regular divergence in strongly trending markets[1]. Spotting these patterns can save traders from falling into the trap of mismatched indicator settings.
3. Using Wrong Settings for Market Type
Applying the same settings across all market conditions can be a costly mistake for traders. For example, using the default stochastic oscillator settings (14, 3, 3) in every scenario often leads to false signals in volatile markets or misses key moves in trending environments[1].
To get better results, you need to tweak your settings based on the market type. Here's a quick guide:
| Market Type | Suggested Settings | Characteristics |
|---|---|---|
| Trending | 21, 7, 7 | Cuts down on noise and reduces false signals |
| Ranging | 5, 3, 3 or 8, 3, 3 | Reacts quickly to price changes |
| Volatile | 34, 13, 13 | Smooths out erratic price movements |
The key is recognizing when the market shifts. Look for changes in volume or EMA crossovers, and then adjust your settings accordingly. Be alert for these signs that your settings might be off:
- Too many false signals in trending markets
- Missing major price moves
- Delayed entries or exits
- Poor alignment with overall market behavior
The LuxAlgo platform's Oscillator Matrix makes this process easier. It uses real-time data to fine-tune settings and includes the AI Backtesting Assistant to test parameters against historical trends. Keep in mind that different sectors have unique needs - utilities, for instance, often require longer periods than tech stocks due to varying volatility levels.
4. Not Checking Multiple Timeframes
One common mistake swing traders make is relying on stochastic oscillator signals from just one timeframe. This approach often leads to false signals and poorly timed trades. Even if you’ve optimized your settings, they won’t be effective without confirming signals across multiple timeframes.
Here’s a simple breakdown of how to use three timeframes effectively:
| Timeframe Level | Purpose | Typical Chart Period |
|---|---|---|
| Higher | Identify the primary trend | Weekly/Daily |
| Intermediate | Confirm trade setups | 4-hour/Daily |
| Lower | Fine-tune entry/exit timing | 1-hour/30-minute |
When comparing stochastic signals across these timeframes, look for alignment. For example, if the weekly chart shows an oversold condition but the 4-hour chart is overbought, this mismatch could signal a short-term pullback within a larger uptrend.
Data from Forex Crunch highlights that traders using multiple timeframes see 17% higher win rates compared to those relying on a single chart [3].
Here are some suggested stochastic settings for each timeframe:
- Higher timeframe: 21,7,7
- Intermediate timeframe: 14,3,3
- Lower timeframe: 5,3,3
The LuxAlgo platform's Oscillator Matrix simplifies this process by automatically detecting divergences across timeframes, helping you spot aligned signals more quickly.
Lastly, don’t overlook volume patterns – they should confirm what your multi-timeframe analysis is telling you.
5. Trading Without Volume Support
Trading stochastic oscillator signals without considering volume is like trying to navigate in the dark – you're missing key market context. A study in Technical Analysis of Stocks & Commodities magazine found that combining volume analysis with oscillators boosted trading performance by 27% over five years[3].
Volume plays a critical role in confirming whether reversals signaled by stochastic overbought or oversold conditions have real strength. For instance, in August 2022, Amazon (AMZN) experienced a bullish stochastic crossover at oversold levels. This was accompanied by a volume increase of 38% above average, leading to an 18% price jump over just 12 sessions.
When analyzing volume, the approach depends on market conditions:
| Market Condition | Volume Pattern to Watch |
|---|---|
| Volatile Markets | Sharp volume spikes |
| Trending Markets | Steady volume increases |
| Range-bound Markets | Volume expansion at extremes |
Some key volume patterns to confirm stochastic signals include:
- Volume Climax: Sudden spikes at market highs or lows
- Volume Trend: Consistently rising volume during price trends
- Breakout Volume: Noticeable volume surges during price breakouts
The LuxAlgo platform's Oscillator Matrix makes this analysis easier by pairing stochastic signals with volume-based momentum metrics.
"Volume is crucial when using the stochastic oscillator for swing trading because it helps validate the strength and reliability of price movements. High volume accompanying a price move suggests stronger conviction among market participants, making the signal more reliable."[9][3]
A practical tip is to use a 20-day volume moving average as a benchmark. When stochastic signals occur, check if the volume is well above this average to filter out weak setups. For example, declining volume during overbought conditions often signals an upcoming reversal.
It's worth noting that volume often moves ahead of price[1]. Waiting for volume confirmation before acting on stochastic signals is especially important in fast-moving sectors like technology. This method not only improves accuracy but also ties into the next common mistake: trading against the market direction without proper validation.
6. Fighting Market Direction
A common mistake among traders is going against the market's dominant trend based on stochastic oscillator signals. Data shows that traders who align their positions with the trend achieved 68% better results than those who traded against it.
Here are some key principles for aligning with trends:
- Enter long positions during pullbacks in an uptrend.
- Use oversold signals to exit trades in a downtrend.
- In range-bound markets, always wait for confirmation before acting.
Take May 2022 as an example: traders who shorted EUR/USD based on overbought signals during a strong uptrend suffered repeated losses, even when the 200-day moving average indicated a bullish trend. This highlights the importance of combining stochastic signals with tools like volume analysis to confirm trend direction.
To avoid this pitfall, analyze the market from multiple perspectives:
- Timeframe Alignment: Match signals to higher timeframe trends for better accuracy.
- Trend Confirmation: Use additional indicators, such as moving averages or ADX, to confirm trends [3].
- Volatility Adjustments: In volatile markets, widen stop-loss levels and adjust profit targets to account for larger price swings.
Keep in mind: overbought conditions in an uptrend often signal strength, not an impending reversal. Likewise, oversold conditions in a downtrend can persist as the market continues to decline. Instead of trying to predict tops and bottoms, use the stochastic oscillator to spot pullbacks within the dominant trend.
Understanding and respecting the trend becomes even more important when looking at sector-specific behaviors, which we'll dive into next.
7. Not Adjusting for Market Sectors
Fine-tuning for market types is a good start, but it’s not enough. Each sector behaves differently, and ignoring these nuances can lead to poor results. For instance, sectors like technology and utilities have distinct volatility patterns, which many traders overlook even after adjusting for broader market conditions.
Here’s a breakdown of how sector-specific strategies can make a difference:
| Sector | Recommended Settings | Why It Works |
|---|---|---|
| Technology | (9,3,3) | Adapts to fast, unpredictable swings |
| Utilities | (21,9,9) | Fits slower, steadier price changes |
| Energy | (21,7,7) | Matches the volatility of commodities |
Take tech stocks as an example. Using the default (14,3,3) settings on highly volatile tech stocks often triggers more false signals. Switching to faster settings like (9,3,3), tailored for the sector’s rapid price movements, reduces these errors[4].
Adjusting Volatility Thresholds
- High-volatility sectors (e.g., Tech, Crypto): Shift to 85/15 overbought/oversold levels for better accuracy.
- Low-volatility sectors (e.g., Utilities, Consumer Staples): Stick with the standard 80/20 levels.
The Role of Market Cap
Larger sectors tend to have more stable price movements, which means they benefit from longer stochastic periods. For instance, financial stocks might work well with a (21,9,9) setting under normal conditions but require adjustments, like (14,5,5), during earnings seasons when volatility spikes.
The LuxAlgo platform's Oscillator Matrix makes this easier by allowing traders to create custom sensitivity profiles for different sectors. During sector rotations, these tailored settings consistently outperform static parameters.
Tools to Fix These Mistakes
Specialized features on the LuxAlgo platform can make correcting trading mistakes much easier. For example, the Oscillator Matrix offers solutions tailored to address common trading errors.
Advanced Divergence Detection
The Oscillator Matrix on the LuxAlgo platform provides real-time divergence detection, helping traders spot shifts in momentum between price action and oscillator readings. This automated feature minimizes false signals and works well with other indicators like RSI or MACD for added confirmation. It directly tackles issues like misreading momentum[3].
Multi-Timeframe Analysis Tools
The Oscillator Matrix on the LuxAlgo platform simplifies this by letting traders match higher timeframe trends with lower timeframe entry points. This approach addresses challenges in multi-timeframe analysis [1][2].
Market Context Integration
By combining money flow insights with stochastic signals, the Oscillator Matrix on the LuxAlgo platform helps traders avoid going against the trend. This feature improves volume analysis and enhances moving average confirmations, reducing the risk of trend-fighting [4].
Sector-Specific Optimization
The AI Backtesting Assistant on the LuxAlgo platform fine-tunes settings based on sector-specific volatility patterns. By analyzing historical data, it helps traders improve their strategies and adapt to different market conditions [4][5].
Performance Tracking
The AI Backtesting Assistant also evaluates strategy success using historical performance metrics, giving traders a clearer picture of what works and what doesn’t.
Conclusion
Using the stochastic oscillator effectively in swing trading requires knowing its strengths and limitations. Addressing the seven common mistakes highlights the importance of viewing the oscillator as one part of a larger trading strategy rather than relying on it alone[1][5].
Market context plays a key role in determining the reliability of signals. Pairing the oscillator with methods like trend analysis and support/resistance levels often leads to improved outcomes[1][8]. Research from Technical Analysis of Stocks & Commodities shows that volume-confirmed signals can boost success rates by 27%[3].
Analyzing multiple timeframes also strengthens signal reliability, helping traders align their positions with broader market momentum[5][8]. This approach is especially useful for swing traders handling various market conditions and timeframes.
Modern markets demand sector-specific adjustments. Tailoring indicator settings to fit the characteristics of individual sectors has become increasingly important[10].
Automated features on the LuxAlgo platform make it easier to apply these strategies systematically. With this approach, the stochastic oscillator shifts from being a standalone indicator to a key part of a broader trading plan.
FAQs
What stochastic oscillator settings work best for swing trading?
The ideal settings depend on the market conditions and your trading approach. While the default settings (14, 3, 3) are effective in stable, ranging markets, many swing traders prefer the following:
| Market Condition | Suggested Settings | Purpose |
|---|---|---|
| Standard Trading | (21, 7, 7) | Balances sensitivity and reduces noise |
These settings help address issues like market mismatches, trend misalignment, and sector mismatches. Choosing the right parameters can minimize common errors.
To simplify the process, the LuxAlgo platform's OSC toolkit can optimize these settings for you.