
Learn how to effectively manage risk during high volatility breakouts using ATR-based stop-loss strategies and their dynamic adjustments.
ATR-based stop-losses help traders manage risk during volatile market breakouts by adjusting to changing conditions. Here's what you need to know:
- What is ATR? A metric that measures market volatility, focusing on price movement size over a 14-period span.
- Why use ATR for stop-losses? It adapts to volatility, reducing the risk of premature exits in choppy markets.
- How to set it up? Multiply the current ATR value by a chosen multiplier (e.g., 2x or 3x) to calculate stop-loss distance.
- Key strategies: Use ATR with tools like Bollinger Bands, volume, and momentum indicators for improved accuracy. Adjust ATR settings for different market sessions or events.
ATR-based stop-losses are dynamic, making them ideal for high-volatility trading scenarios. Read on to learn how to calculate, adjust, and automate these strategies effectively.
How to Set Stop Losses with ATR Indicator
Setting Up ATR Stop-Loss Levels
To calculate stop-loss levels based on ATR, use this formula:
Stop-loss distance = Current ATR value × ATR multiplier
| Condition | Multiplier | When to Use |
|---|---|---|
| Normal Volatility | 2x | Standard breakout trades |
| High Volatility | 2.5x - 3x | During major news or strong trends |
These multipliers match the volatility levels often seen in breakout trading scenarios.
For instance, if you're trading EUR/USD and the current ATR is 50 pips during a high-volatility breakout, applying a 2.5x multiplier would place your stop-loss 125 pips away from your entry.
Adjusting Stop-Loss During High Volatility
When markets become highly volatile, consider these adjustments:
- Extend the ATR calculation period to 20.
- Use filters if volatility surpasses 150% of the weekly average[2][3].
Managing Stop-Losses in Real-Time
The Chandelier Exit is a helpful method for dynamic stop-loss adjustments:
- For long trades: Stop-loss = Highest high since entry - (ATR × multiplier)
- For short trades: Stop-loss = Lowest low since entry + (ATR × multiplier)
If the price moves in your favor by 2x ATR, adjust your stop-loss to lock in gains while accounting for potential price swings. This approach balances profit protection with market fluctuations.
ATR and Technical Indicator Combinations
ATR with Bollinger Bands Setup
Pairing ATR with Bollinger Bands can help traders better assess volatility changes and fine-tune stop-loss levels. The width of Bollinger Bands visually reflects shifts in market volatility, while ATR offers a precise way to calculate stop-loss distances.
When Bollinger Bands start to widen during a breakout, it indicates growing volatility. This setup allows traders to confirm breakout signals and adjust stop-loss levels to avoid being stopped out too early during sharp market moves. According to a study published in Technical Analysis of Stocks & Commodities, this combination boosted trade entry accuracy by 23% compared to using ATR alone [3].
Volume and Momentum Confirmation
Once volatility shifts are identified using Bollinger Bands, you can gauge the strength of a breakout with volume and momentum indicators. Here's how to incorporate them:
Volume Confirmation
Look for volume that exceeds the 20-day average by at least 50% before making stop-loss adjustments [6].
Momentum Integration
Rely on RSI extremes (above 70 or below 30) to justify wider stop-loss levels, while maintaining standard multipliers in neutral ranges. Additionally, an expanding MACD histogram can further support the decision to widen stops.
ATR Settings for High Volatility
ATR Settings by Market Session
Volatility shifts throughout the trading day, so adjusting ATR multipliers for specific sessions is key. For example, during the European-US session overlap – when volatility tends to spike – higher ATR multipliers are more effective. On the other hand, the Asian session, known for its calmer market activity, usually calls for lower multipliers. If a major economic event or news release occurs, temporarily increasing your standard ATR multiplier by 50-100% can help account for the added volatility. These adjustments work alongside the volatility filters mentioned earlier.
Multiple Timeframe ATR Analysis
Using ATR across multiple timeframes during high-volatility periods requires a clear plan. Start with the daily timeframe to get a sense of overall market volatility, then shift to shorter timeframes for fine-tuning your entries and exits[4].
Here’s a practical approach:
- Daily ATR: Set initial stop-loss levels.
- 4-hour ATR: Confirm intermediate trends.
- 1-hour ATR: Manage trades more closely.
When ATR exceeds its 90th percentile during extreme conditions, cutting your position size by 50% can help keep your risk under control[3]. This strategy ensures consistent risk management even in turbulent markets.
Risk Control with ATR Stop-Losses
ATR stop-losses work best when combined with proper position sizing and adaptable strategies during periods of high market volatility.
ATR Position Size Calculator
To calculate your position size, use this formula:
(Account Balance × Risk Percentage) / (ATR × Multiplier)
For example, if you have a $50,000 account and are risking 1% on an asset with a $2.50 ATR:
($500) / (2 × $2.50) = 100 shares.
This method ensures your position size aligns with your risk tolerance and works seamlessly with trailing stop strategies.
ATR Trailing Stop Methods
Trailing stops help secure profits while giving the trade room to breathe during volatile movements. One effective approach is the Stepped ATR Trail method:
| Profit Level | Multiplier | Stop Example |
|---|---|---|
| Initial | 2.0x | $4.00 below entry |
| 1R profit | 2.5x | $5.00 below price |
| 2R profit | 3.0x | $6.00 below price |
This method adjusts stop levels as profits grow, balancing risk and reward effectively.
Market Event Risk Adjustments
Certain market events demand specific risk adjustments to handle increased volatility. Here are two key strategies:
- Volatility-Based Stop Widening: For events like Federal Reserve announcements, widen a standard 20-pip stop (2×ATR) to 45 pips (3×ATR) to account for the heightened price swings.
- Time-Based Filtering: Avoid making adjustments 15-30 minutes before and after major news releases to reduce unnecessary risks.
Automation tools, such as LuxAlgo's volatility tools, can help streamline and apply these adjustments automatically, saving time and reducing manual errors.
Summary and Next Steps
Now that we’ve covered practical ways to use ATR, let’s take a closer look at how it enhances trading strategies in high-volatility markets.
Benefits of ATR Stop-Loss Strategies
ATR-based stop-losses are particularly effective in volatile breakout scenarios. Why? Because ATR naturally adjusts to market conditions. When volatility spikes, it widens to allow trades more flexibility. During calmer periods, it tightens to lock in profits more effectively. This dynamic adjustment is especially useful during high-risk market events, as detailed in the earlier section on risk adjustments.
Leveraging ATR Tools and Automation
LuxAlgo provides exclusive trading features such as:
- Real-time ATR alerts to adapt quickly to changing volatility
- Multi-timeframe analysis to confirm breakout opportunities
To make the most of automated ATR strategies, keep these points in mind:
- Regularly adjust ATR multipliers to reflect current market conditions
- Combine ATR with other trend-following indicators for a well-rounded approach
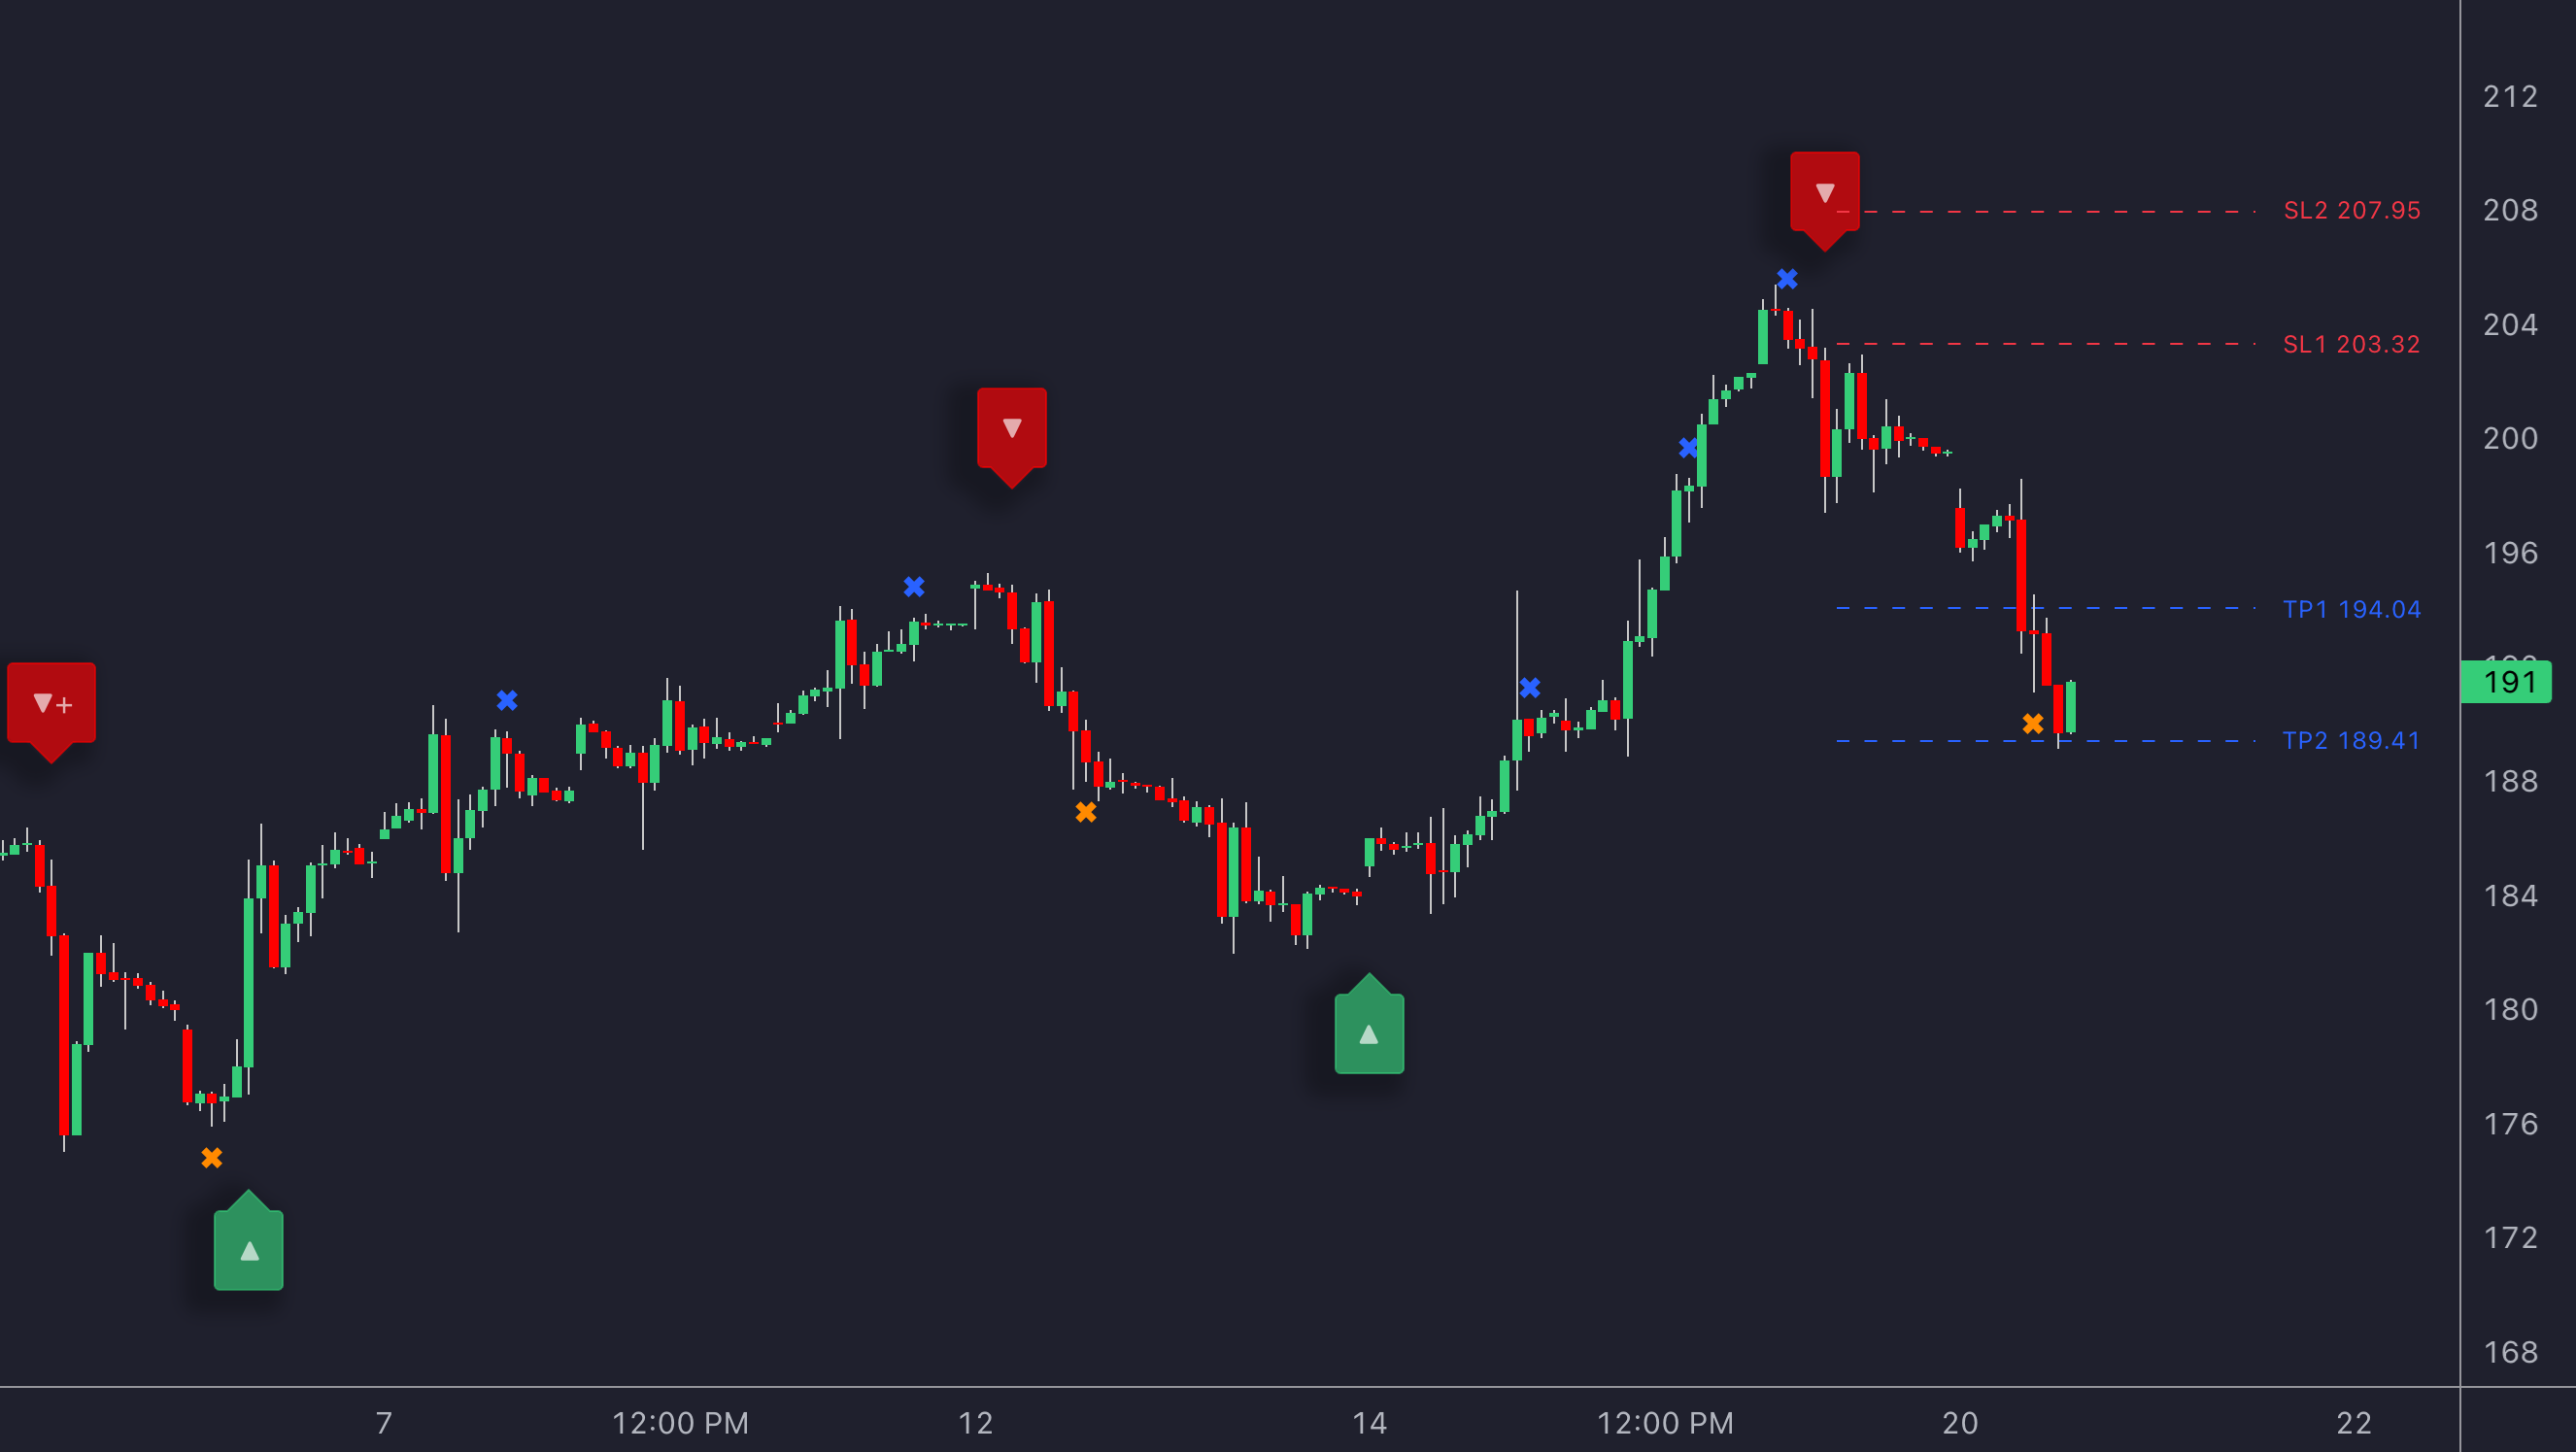
Automated TP and SL with LuxAlgo Signals & Overlays
LuxAlgo Signals & Overlays features an innovative take profit (TP) and stop loss (SL) capability that automatically plots ATR-based targets once a trading signal is generated. Using the current ATR value, this feature dynamically calculates optimal TP and SL levels—positioning stop losses below the price for bullish signals and above the price for bearish ones. This ensures that your risk management adapts to market volatility without implying that the signals themselves are ATR-based. For more details on configuring these settings, please refer to the official TP/SL Points documentation.
FAQs
Here are clear answers to some common questions about using ATR stop-loss strategies during volatile breakouts:
Can ATR be used for stop-loss?
Yes, ATR can help set flexible stop-loss levels that adjust to market volatility. By applying multipliers (typically 1.5x to 3x), you can create stops that align with the market's behavior, reducing the risk of exiting too early during volatile periods [1][2][6].
How do you set a stop-loss using ATR?
The process is simple and depends on whether you're trading long or short:
-
For Long Positions:
Stop Loss = Entry Price - (ATR × Multiplier) -
For Short Positions:
Stop Loss = Entry Price + (ATR × Multiplier)
If the market is experiencing high volatility, you might want to use a larger multiplier to account for bigger price movements [5][4].
How do you calculate a stop-loss with ATR?
Follow these three steps:
- Find the Current ATR: Use the default 14-period ATR setting to get the current value.
- Choose a Multiplier: Typically, traders use 2x or 3x ATR for breakout scenarios.
- Calculate the Stop-Loss Distance: Multiply the ATR value by your chosen multiplier.
For example, if the ATR is $500 and you use a 3x multiplier, the stop-loss distance would be $1,500 [2][8].
References
- Bollinger Bands - Wikipedia
- Chandelier Exit
- ATR Guide in Breakout Trading (Tio Markets)
- Navigating Market Breakouts (Pepperstone)
- Trading the Volatility Breakout System (FXOpen)
- Five Trading Strategies for a Highly Volatile Market (Blueberry Markets)
- Exploiting the ATR Indicator in Systematic Trading (Unger Academy)


