Learn about bearish chart patterns that can signal market downturns and enhance your trading strategies with effective risk management techniques.
Bearish chart patterns help traders predict potential price drops and make informed decisions about entering short positions or exiting long ones. These patterns are most reliable on longer timeframes and in liquid markets. Here’s what you need to know:
- Common Patterns: Head and Shoulders, Double Top, Descending Triangle, Bear Flag, and Island Top.
- Confirmation Signals: Volume spikes, bearish momentum divergences, and breakdowns below support levels.
- Success Rates: Patterns like Head and Shoulders have up to 83% success in stock markets.
- Risk Management: Use position sizing formulas and stop-loss strategies to protect capital.
Quick Comparison of Success Rates
| Pattern Type | Forex Success | Stock Market Success |
|---|---|---|
| Head and Shoulders | 61% | 83% |
| Double Top | 72% | 78% |
| Descending Triangle | 67% | 69% |
Head And Shoulders Pattern Trading Course
Common Bearish Chart Patterns
These five patterns can signal potential market downturns when confirmed correctly:
The Head and Shoulders pattern is one of the most dependable bearish reversal indicators, with success rates of 83% in stock markets and 61% in forex trading [4]. This pattern forms when a higher peak (the "head") is flanked by two lower peaks (the "shoulders"). Confirmation comes from:
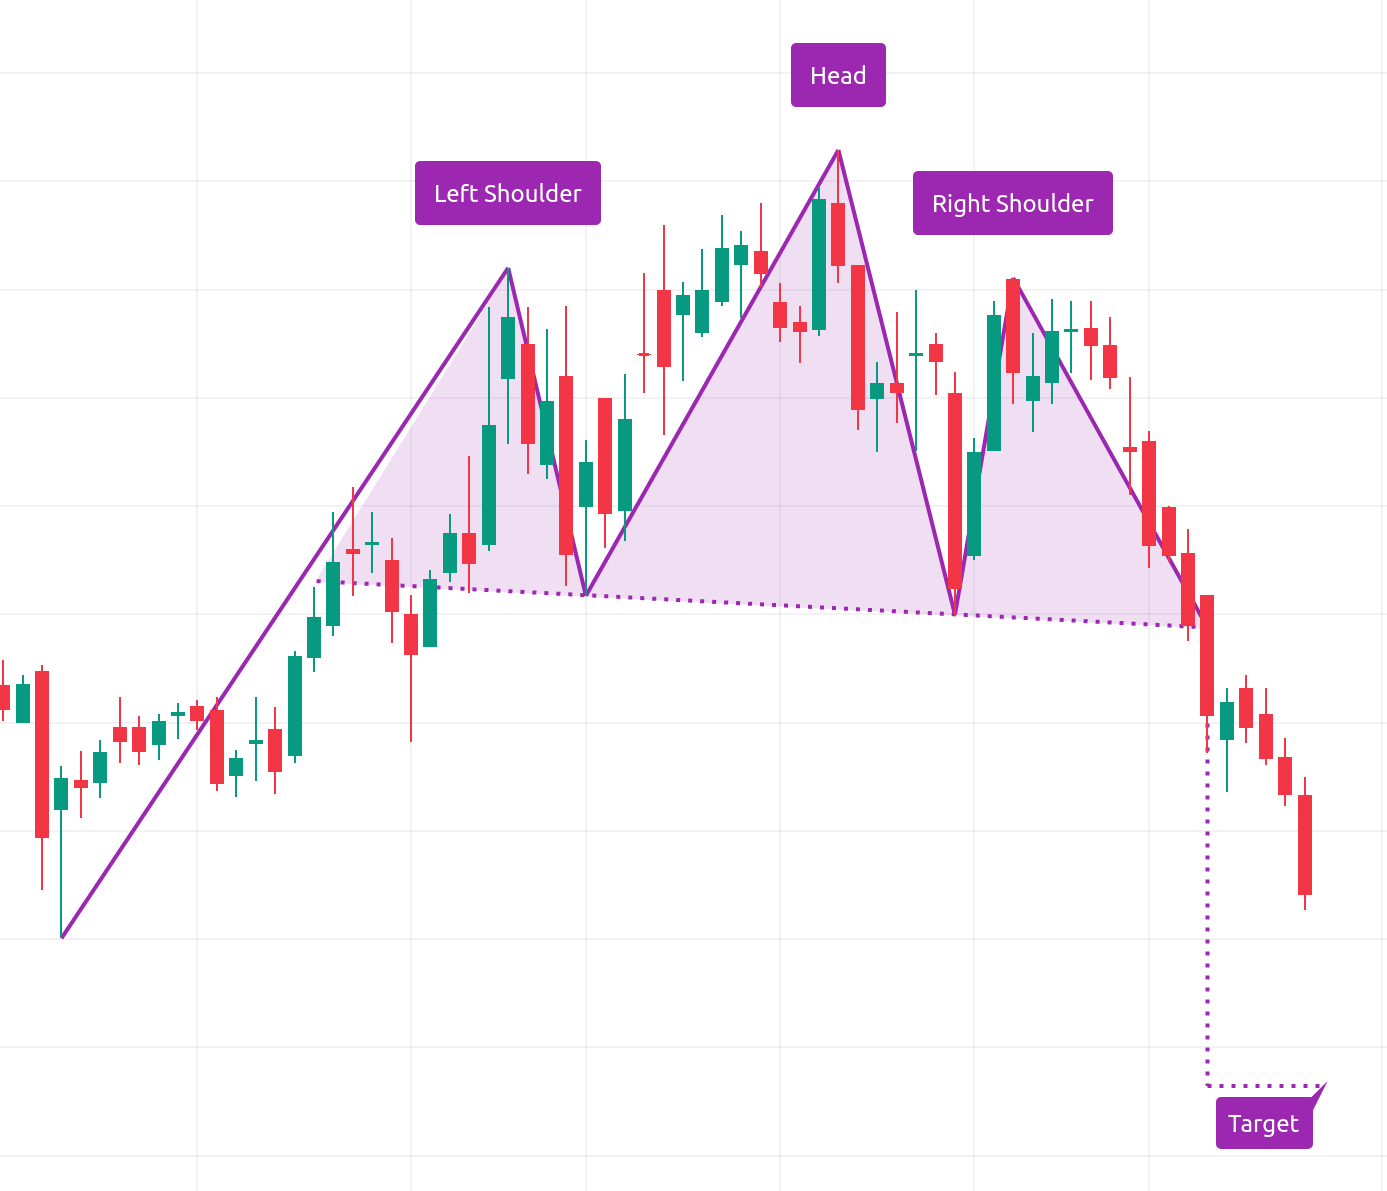
- Higher volume during the left shoulder and head formation
- Decreasing volume in the right shoulder
- A volume surge when the neckline breaks [3]
For example, Tesla's October 2022 daily chart displayed this pattern. The neckline break led to a sharp 19.5% drop in just a week.
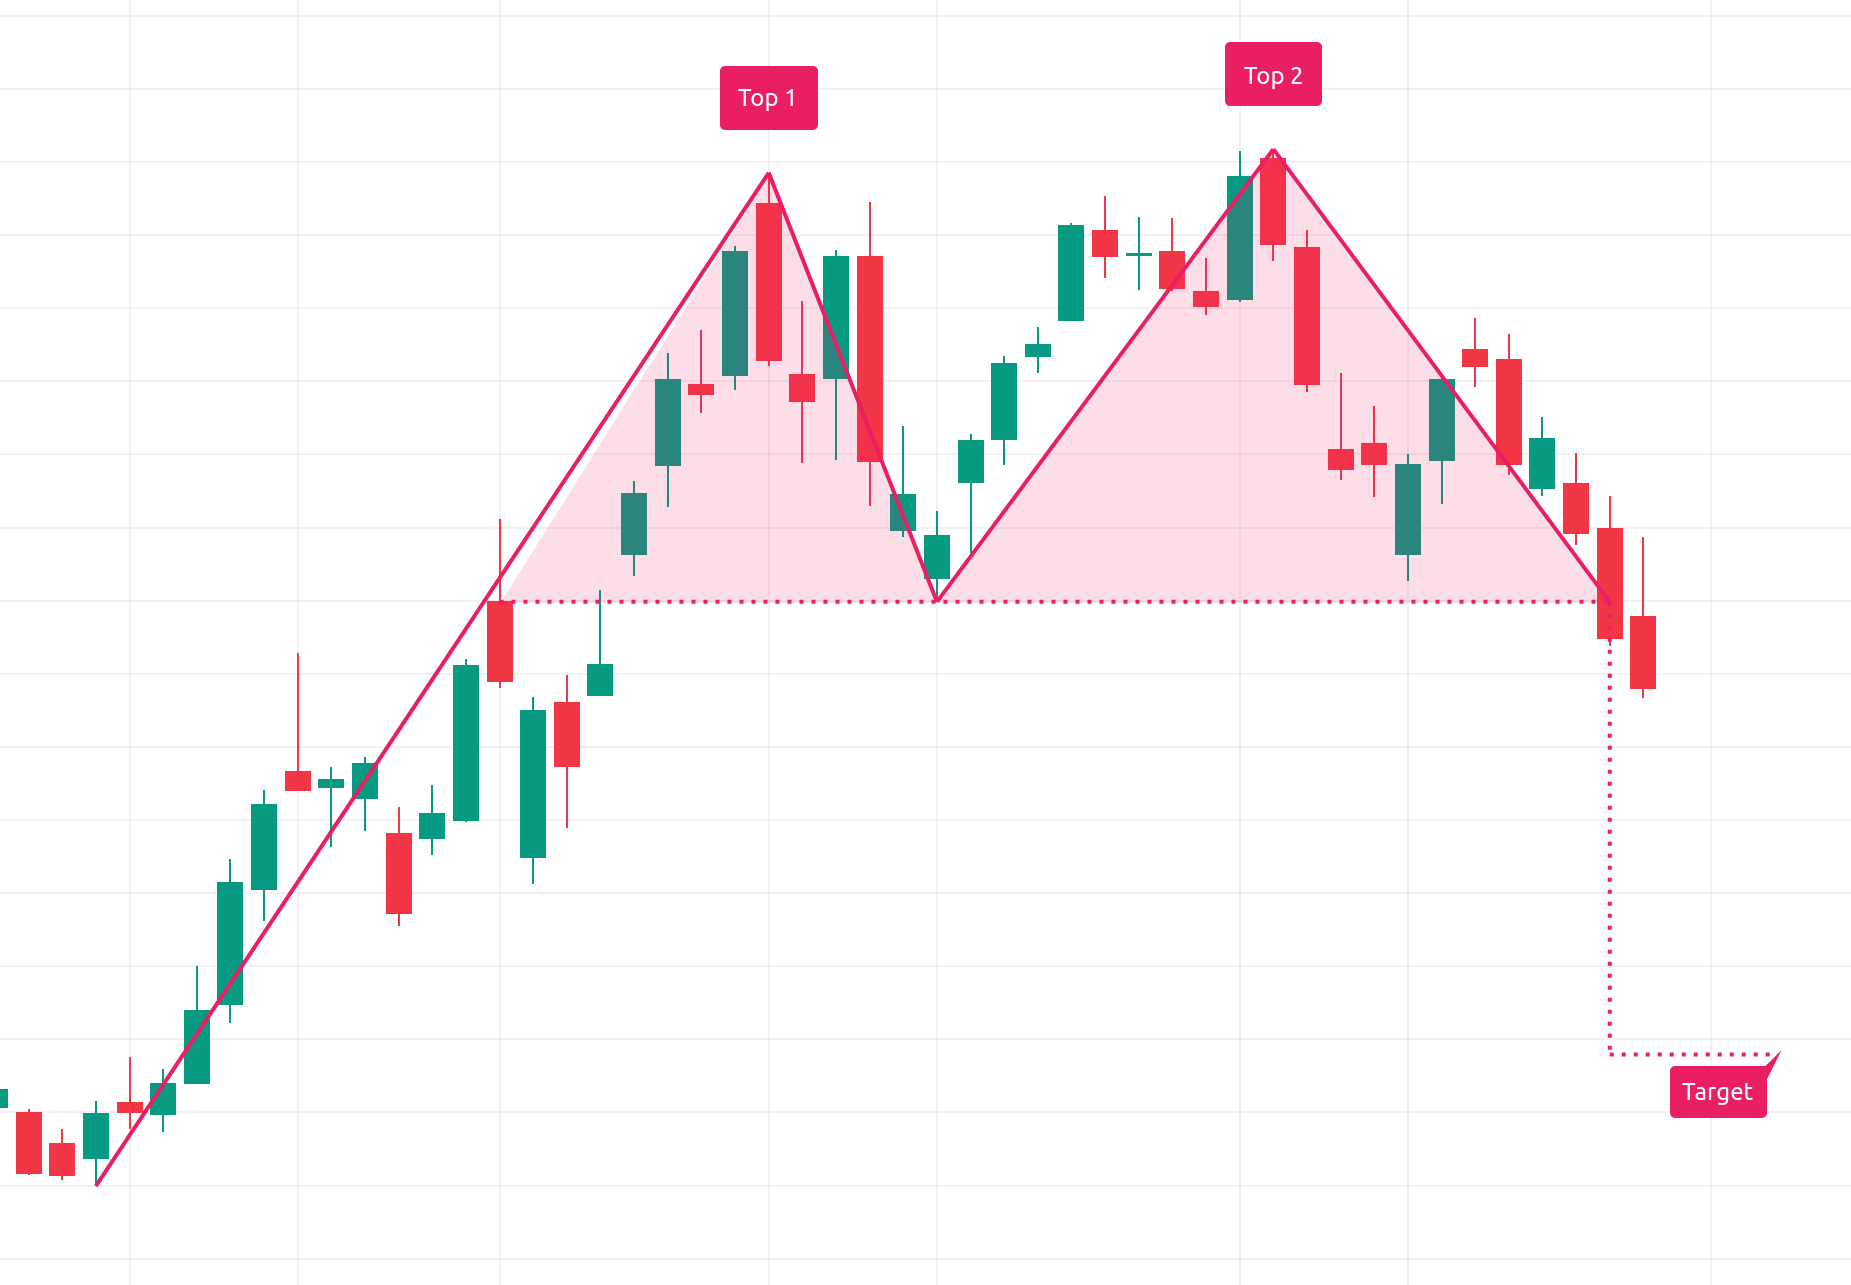
The Double Top pattern, while simpler, also signals market exhaustion. It forms with two consecutive peaks at similar levels. Confirmation requires a neckline break, a volume surge, and a failed retest of the broken level.
Descending Triangles feature horizontal support and descending resistance. Though typically bearish, they can sometimes appear in uptrends, hinting at major reversals [5].
Here’s a quick comparison of success rates, based on data from 10,000 historical patterns:
| Pattern Type | Forex Success | Stock Market Success |
|---|---|---|
| Head and Shoulders | 61% | 83% |
| Double Top | 72% | 78% |
| Descending Triangle | 67% | 69% |
Unlike reversal patterns, continuation patterns like the bear flag suggest a trend is likely to persist. A bear flag consists of a sharp downward move (the flagpole), followed by a brief upward-sloping consolidation, and a breakdown below the lower trendline. Key confirmation signals include [2]:
- A volume increase during the breakdown
- A price target equal to the length of the flagpole
Lastly, the Island Top is a rare but powerful bearish pattern. It forms when price gaps isolate a cluster of trading activity. Traders should:
- Wait for the gap down to confirm the pattern
- Use the island's peak as a stop-loss level
- Look for volume spikes during both gaps [1]
Pattern Recognition Steps
Once traders identify potential patterns through structural analysis, the next step is to confirm them by examining volume and momentum signals.
Price Structure Analysis
Start by confirming a bearish trend using noticeable lower highs. When evaluating patterns, pay attention to the structure's symmetry. For example, in formations like the Head and Shoulders, ensure the shoulders align properly. Fibonacci levels can also help validate these patterns, as seen in the Tesla Head and Shoulders example, where structural validation came before confirmation signals.
Draw trendlines that connect key highs and lows clearly. Use Fibonacci levels to check critical points in the pattern, especially for reversal patterns like Head and Shoulders or Double Tops.
Volume and Momentum Checks
Historical data indicates that patterns confirmed through volume analysis have a 68% success rate[4].
To confirm patterns effectively:
- Look for breakouts accompanied by above-average volume.
- Check for bearish divergences in momentum indicators, such as RSI and MACD.
The RSI should display lower highs during the pattern's formation, particularly when prices are testing resistance levels.
Breakout Confirmation
Building on earlier pattern-specific criteria, confirmation of a breakout typically requires:
- A clear breakdown below support (a drop of at least 3% for stocks).
- A noticeable surge in volume.
These steps ensure the pattern is validated before acting on it.
Risk Management Rules
Once you've confirmed bearish patterns through structural and volume analysis, it's time to apply these risk controls to safeguard your trading capital.
Position Size Calculation
Use this formula to determine your position size:
Position size = (Capital × Risk%) ÷ (Entry price - Stop price)
This approach limits your exposure on any single trade, helping protect your capital. Make sure your position size aligns with the stop-loss levels you've already identified during your analysis. In more volatile markets, consider reducing your position size by 25-50% to account for increased risk.
Stop-Loss Placement
Use trailing stops to lock in profits as the trade moves in your favor. Adjust these stops based on volatility indicators to stay in tune with market conditions, while still adhering to your overall risk limits.
"The combination of proper position sizing and strategic stop-loss placement can help maintain a positive expectancy even with a 50% win rate, provided you maintain a minimum 2:1 reward-to-risk ratio" [7].
Pattern Recognition Tools
Once you've set your risk parameters, you can streamline pattern identification by using features like LuxAlgo’s Price Action Concepts toolkit. This offering automates the process of spotting patterns while offering options to tailor it to your trading approach.
Features of LuxAlgo Price Action Concepts Toolkit
The toolkit comes packed with features designed to make pattern detection more efficient:
- Automated detection of common bearish patterns
- Overlays for necklines and price projections
- Scanning across multiple timeframes
- Historical backtesting capabilities
- Automated checks for volume and momentum criteria based on prior analysis
"The combination of automated pattern detection with volume analysis provides traders a significant edge in identifying high-probability bearish setups, often spotting formations before they become obvious to the majority of market participants" [1].
Setting Up Testing and Alerts
These tools simplify the process of applying the confirmation criteria you've already established:
-
Define validation parameters:
- Specify the minimum pattern size
- Set volume thresholds
- Apply market condition filters
-
Configure alerts for key triggers:
- Completion of patterns
- Volume spikes at critical levels
- Alignment across multiple timeframes
- Ensure alerts align with the 3% breakdown threshold and volume surge requirements discussed earlier
For added confidence, pair these alerts with indicators like RSI or moving averages to validate signals while keeping the process automated and efficient.
Conclusion
Let’s wrap up by highlighting key insights from identification techniques and risk controls:
Key Takeaways
Bearish chart patterns often indicate potential market declines. Their reliability improves when traders combine volume analysis with price action confirmation, helping to filter out misleading signals.
Successful pattern trading isn't just about spotting technical signals – it also requires disciplined capital management. Features like LuxAlgo’s Price Action Concepts toolkit simplify pattern detection, allowing traders to validate setups quickly and effectively.
How to Start
Here’s how you can put these ideas into action:
Start by analyzing daily charts of major indices or large-cap stocks. These typically offer higher liquidity, making patterns easier to identify. Using LuxAlgo’s Price Action Concepts toolkit on TradingView, you can:
- Scan across multiple timeframes
- Get alerts when patterns complete
- Confirm patterns with volume analysis
- Backtest strategies under various market conditions
"The combination of automated pattern detection with volume analysis provides traders a significant edge in identifying high-probability bearish setups, often spotting formations before they become obvious to the majority of market participants" [1]
Before trading live, test your strategies through paper trading. Align patterns with the broader market environment and stick to the risk management rules we’ve covered. This disciplined approach is key to long-term trading success.
FAQs
How do you recognize a head and shoulders pattern?
The head and shoulders pattern is a well-known bearish reversal signal. Here’s what to look for:
- Left shoulder: Forms during an uptrend and is accompanied by strong trading volume.
- Head: Peaks higher than the left shoulder, marking the highest point.
- Right shoulder: Peaks lower than the head and aligns horizontally with the left shoulder.
- Neckline: A line that connects the lows between the left and right shoulders.
Is the double top pattern dependable?
The double top pattern can be a strong indicator when certain conditions are met:
- Clear rejection of price at the same resistance level twice.
- A noticeable drop in buying momentum after the second peak.
To confirm the pattern, watch for:
- A breakdown below the neckline.
- Increased trading volume during the breakdown.
- A failed retest of the broken neckline.
You can also use tools like RSI divergence or moving average crossovers for extra confirmation [6].