Explore essential volume indicators to identify unusual trading activity and enhance your market analysis for better trading decisions.
Unusual trading volume often signals potential price movements, making it a key focus for traders. This guide highlights the top 5 volume indicators you can use to identify these opportunities:
- On-Balance Volume (OBV): Tracks buying/selling pressure by adding or subtracting volume based on price movement.
- Volume-Weighted Average Price (VWAP): Combines price and volume to show average trading price, ideal for intraday analysis.
- Accumulation/Distribution Line (A/D Line): Detects accumulation or distribution phases by analyzing price range and volume.
- Chaikin Money Flow (CMF): Measures buying/selling momentum using volume-weighted averages.
- Oscillator Matrix Money Flow: Detects market overflow by identifying when excessive one-sided buying or selling enters the market, signaling potential reversals.
Quick Comparison
| Indicator | Key Strength | Best Use Case | Limitations | Platform Support |
|---|---|---|---|---|
| OBV | Confirms trends and breakouts | Long-term trend following | Skewed by large volume days | Available on most platforms |
| VWAP | Tracks intraday price-volume relationships | Day trading and institutional orders | Limited to single-day analysis | Found on professional platforms |
| A/D Line | Identifies accumulation or distribution phases | Medium-term trend analysis | May lag in fast-moving markets | Widely supported |
| CMF | Tracks buying and selling pressure | Detecting trend reversals | Sensitive to short-term fluctuations | Universally available |
| Oscillator Matrix Money Flow | Detects excessive one-sided activity (overflow) | Identifies market overflow & potential reversals | Only on TradingView | Exclusive to TradingView |
Each indicator offers unique strengths for analyzing unusual volume. Combining these tools can provide a clearer picture of market trends and potential opportunities.
1. On-Balance Volume (OBV)
On-Balance Volume (OBV) tracks changes in trading volume to gauge buying and selling pressure. It adds volume on days when prices rise and subtracts it on days when prices fall. This helps identify whether buyers or sellers are in control. When OBV trends diverge from price movements, it can signal potential trend reversals.
Trading Applications
OBV is useful for various trading approaches:
| Trading Style | How OBV Helps |
|---|---|
| Day Trading | Confirms intraday trends and spots volume shifts |
| Swing Trading | Validates breakouts and accumulation phases |
| Long-term Investing | Highlights ongoing buying or selling activity |
Why It Works
When OBV rises while prices stay flat or drop, it often points to accumulation by larger players, signaling possible price changes ahead. This makes OBV a great indicator for spotting unusual activity and understanding market dynamics.
How to Use It
To make the most of OBV:
- Compare OBV trends across different timeframes to confirm breakouts or reversals.
- Watch for divergences between OBV and price to uncover potential opportunities.
- Pair OBV with trend-following indicators for stronger confirmation.
OBV is available on popular platforms like TradingView, making it accessible for both manual and automated strategies. Its straightforward calculation makes it a reliable choice for analyzing volume, especially when combined with other indicators and solid risk management practices.
While OBV is a go-to for volume analysis, it can be complemented by tools like VWAP for a deeper understanding of volume trends.
2. Volume-Weighted Average Price (VWAP)
Volume-Weighted Average Price (VWAP) combines both price and volume data into a single metric, making it a go-to indicator for spotting unusual trading activity. It calculates the average price paid for shares during the trading day, weighted by volume. This helps traders track major market movements and potential trend changes [1].
How VWAP Works and When to Use It
VWAP acts as a benchmark for understanding market sentiment and volume trends. Here's how price levels relative to VWAP can provide insights:
| Price vs VWAP | Market Signal | Trading Implication |
|---|---|---|
| Above VWAP | Strong buying activity | Likely upward momentum |
| At VWAP | Balance point | Possible price stabilization |
| Below VWAP | Strong selling activity | Potential downward trend |
Tips for Using VWAP Effectively
If you're planning to use VWAP to screen for unusual volume:
- Tailor the calculation to match your trading style - use shorter time frames for day trading and longer ones for swing trading.
- Pay close attention to price-VWAP dynamics during high-volume periods, as these often highlight institutional trades.
- Pair VWAP with other trend indicators to confirm volume-based signals.
"VWAP provides a benchmark for execution prices and helps identify unusual market activity", says Marc Chaikin [3].
Using VWAP on Trading Platforms
VWAP is available on most popular platforms like TradingView, making it easy to incorporate into both manual and automated trading strategies. Its ability to blend price and volume analysis makes it even more powerful when paired with other volume-focused indicators like On-Balance Volume (OBV).
While VWAP is great for identifying volume trends and price momentum, the next section will dive into the Accumulation/Distribution Line, which offers a deeper look into market sentiment and volume behavior.
3. Accumulation/Distribution Line (A/D Line)
The Accumulation/Distribution Line (A/D Line) helps identify shifts in volume by analyzing the connection between price and volume. It's particularly useful for spotting unusual volume changes that reflect market sentiment.
How It Works and What It Signals
The A/D Line evaluates the importance of volume by looking at where the day's closing price sits within its trading range. When price and volume movements align, the signals about trend continuations or reversals become stronger.
| Signal Type | Price Action | A/D Line Movement | Trading Implication |
|---|---|---|---|
| Bullish Divergence | Declining | Rising | Indicates a potential upward trend |
| Bearish Divergence | Rising | Declining | Suggests a possible downward trend |
| Confirmation | Rising/Falling | Rising/Falling | Confirms the current trend |
Tips for Advanced Use
To get the most out of the A/D Line, match its timeframe to your trading goals, keep an eye on price-volume divergences, and validate signals using other price action indicators.
Customizing and Using on Platforms
The A/D Line is widely supported and can be customized to suit your trading style. It also integrates well with other indicators for analyzing unusual volume activity.
"The A/D Line offers market sentiment insights but requires pairing with other indicators to avoid false signals" [3].
Practical Use in Trading
The A/D Line is most effective when paired with other volume indicators to confirm potential breakouts or reversals. By considering where the price sits within its trading range, it provides a deeper look into accumulation and distribution phases.
While the A/D Line is a strong indicator for understanding market sentiment, the Chaikin Money Flow (CMF) takes it a step further by using weighted volume to deliver a more precise measure of momentum.
4. Chaikin Money Flow (CMF)
The Chaikin Money Flow (CMF) uses price and volume data to measure buying and selling pressure, making it a helpful indicator for spotting unusual volume activity. This indicator helps traders track major market moves by analyzing volume-weighted price changes.
How It Works
CMF calculates a volume-weighted average of price movements over a set period, often 20 days. It moves above and below zero, with positive values pointing to buying pressure and negative values indicating selling pressure.
| CMF Reading | Market Condition | Volume Insight |
|---|---|---|
| Strong Positive (>0.25) | Accumulation | High buying activity |
| Strong Negative (<-0.25) | Distribution | High selling activity |
| Neutral (-0.05 to 0.05) | Balance | Normal volume levels |
If prices rise but CMF values drop, it could signal a weakening trend. On the flip side, falling prices with improving CMF readings may suggest accumulation. Its volume-weighted approach offers deeper market insights than traditional volume indicators.
How to Use It
To identify unusual volume, look for CMF values diverging from price trends, focus on readings above ±0.25 for stronger signals, and adjust your timeframe to fit your trading style. CMF is available on most trading platforms, making it easy to include in your analysis.
"CMF offers a reliable indicator of trend reversals and continuations, especially when used in combination with other indicators. However, its performance can vary across different markets and securities."
For better accuracy, pair CMF with other indicators and be cautious of false signals during high volatility. It works best as part of a broader volume analysis approach.
While CMF is a solid way to gauge buying and selling pressure, advanced tools can build on these concepts for deeper market analysis.
5. Oscillator Matrix Money Flow
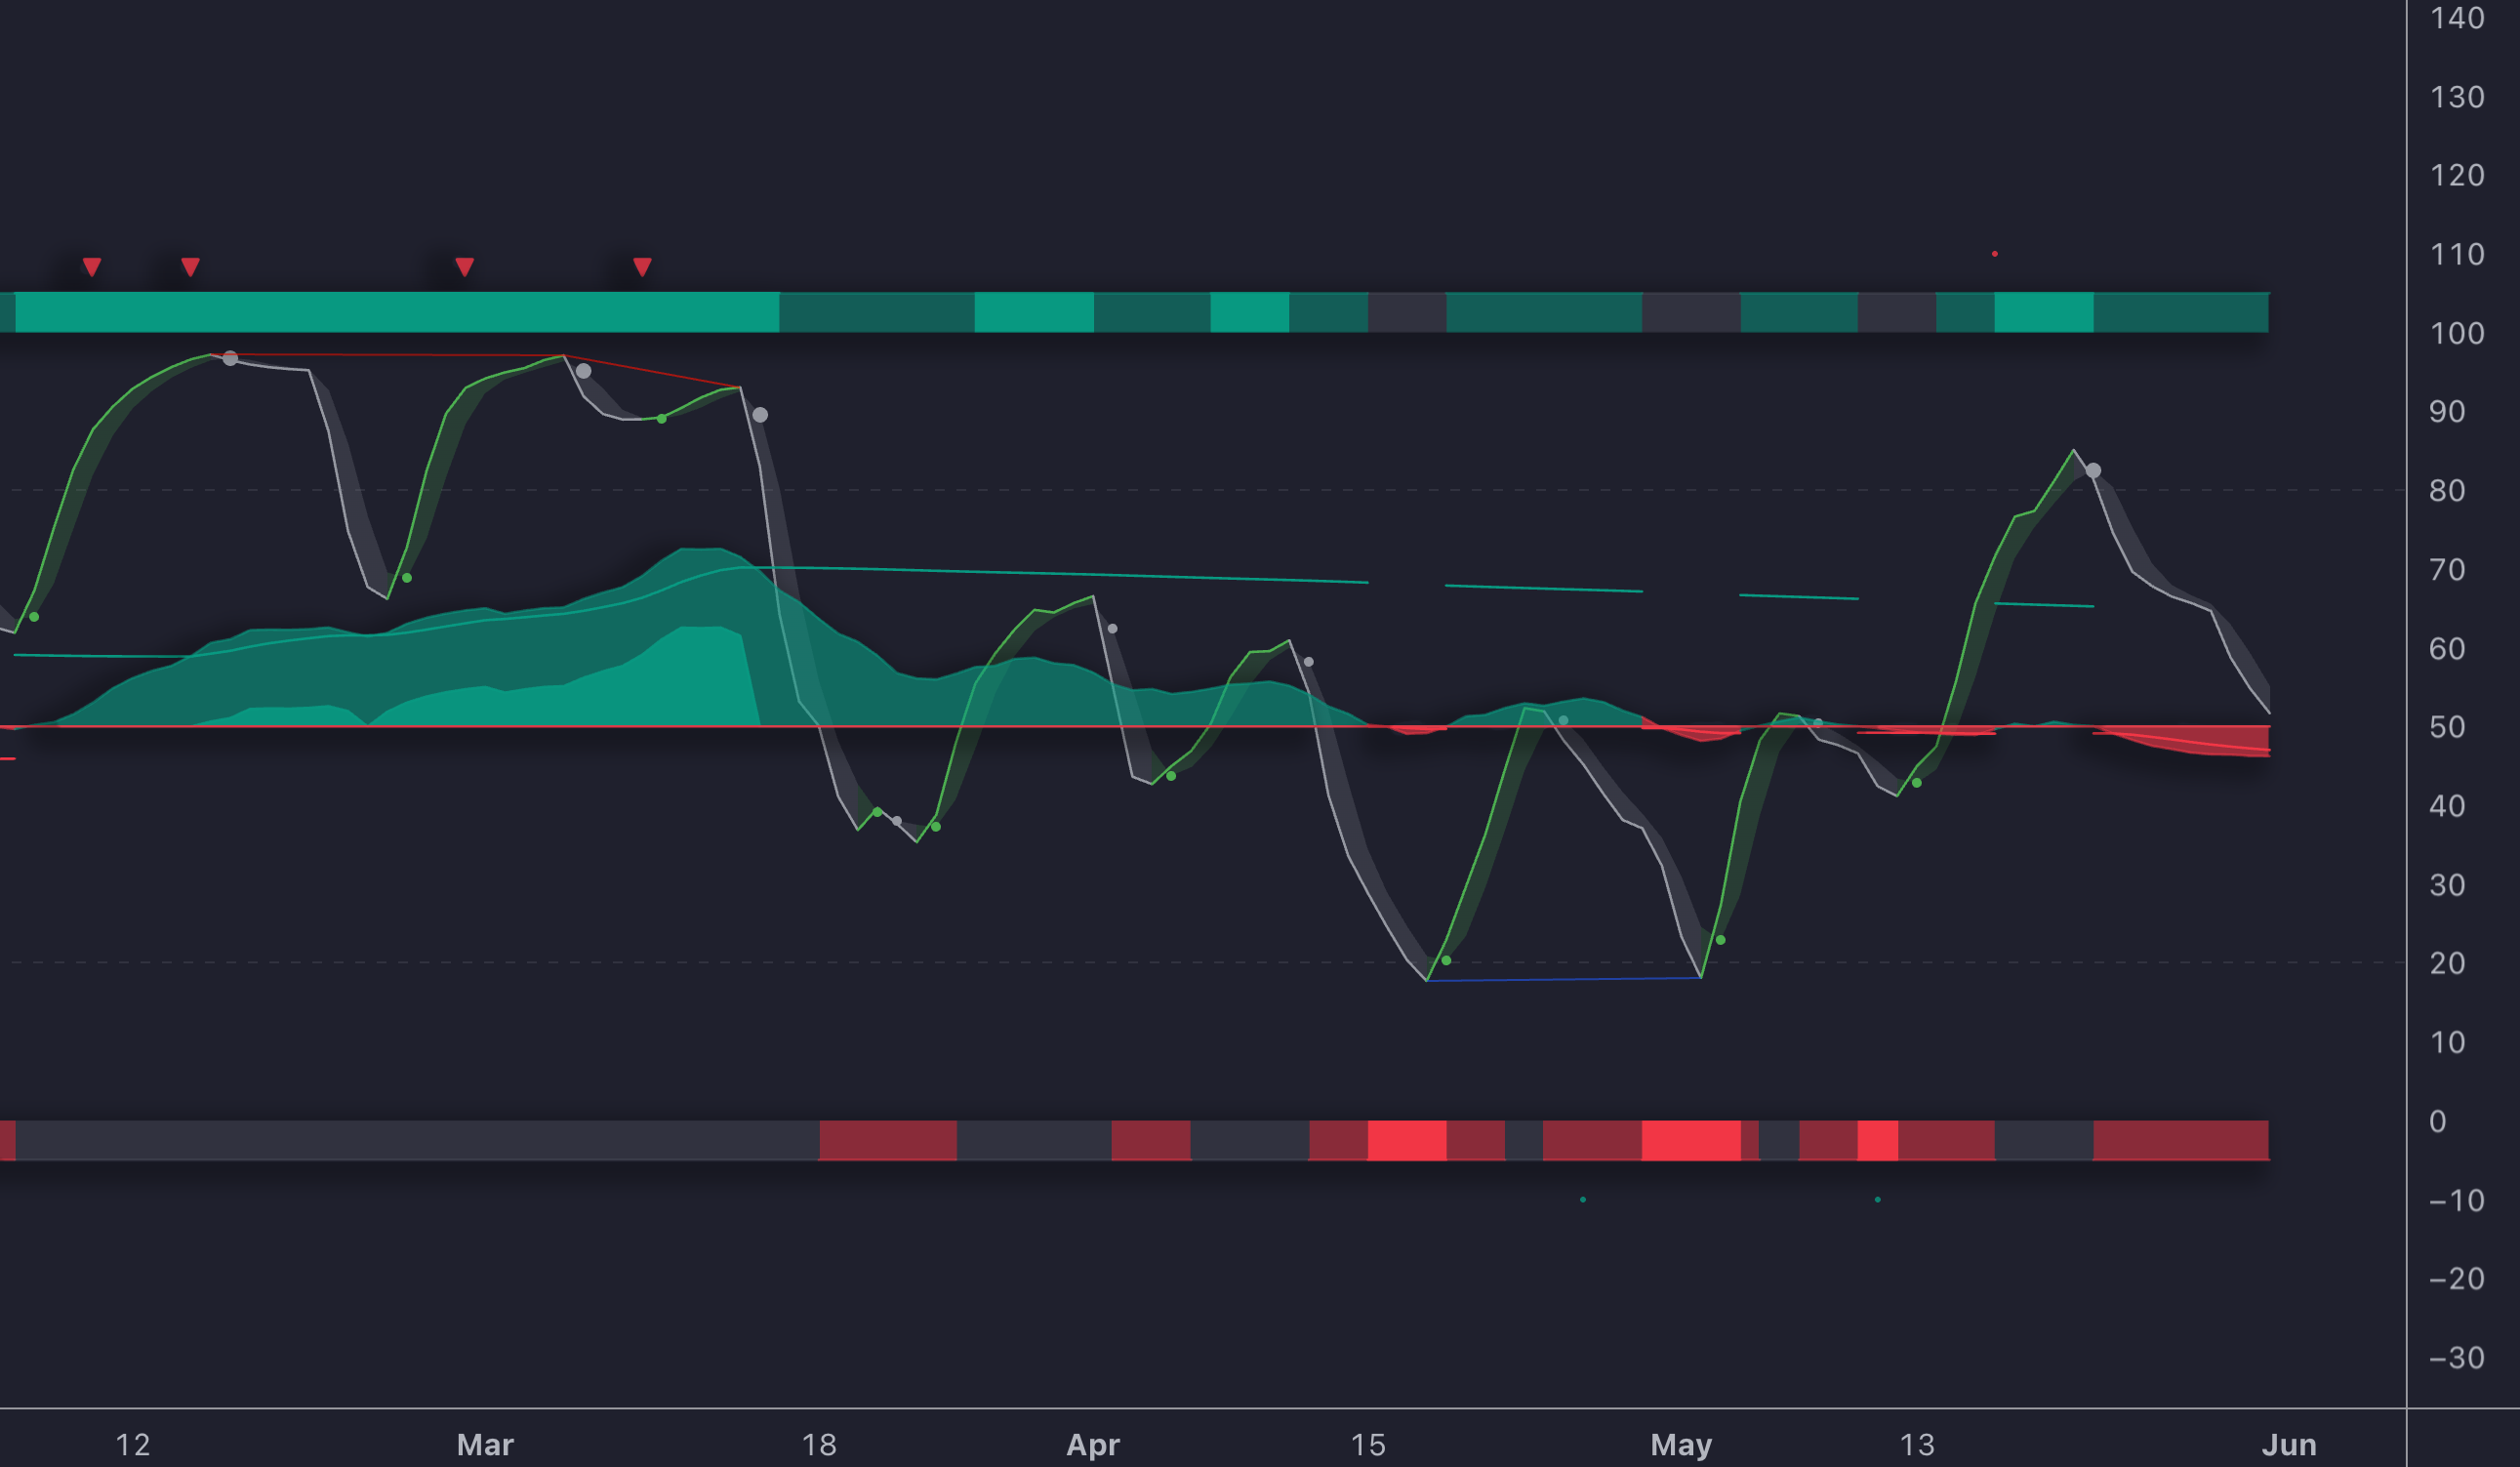
The Oscillator Matrix Money Flow is a powerful indicator designed to detect market liquidity imbalances and overflow. It specifically identifies when excessive one-sided buying or selling enters the market – a condition known as overflow. Overflow occurs when excessive liquidity relative to a trend length enters the market, often highlighting late trend-following participants and signaling potential reversals.
Money Flow Thresholds Feature
Users can gauge market activity by using the provided Money Flow thresholds, with two extremities displayed above and under the central 50 levels. When the Money Flow oscillator is above the upper threshold, it indicates significant one-sided bullish activity. Conversely, when the oscillator falls below the lower threshold, it signals significant one-sided bearish activity. Money flow fluctuating within these thresholds suggests a more balanced market.
Comparison of Indicators
When assessing volume indicators for spotting unusual activity, each brings its own strengths and specific applications. Here's a breakdown of how these indicators stack up across key metrics:
| Indicator | Key Strength | Best Use Case | Limitations | Platform Support |
|---|---|---|---|---|
| On-Balance Volume (OBV) | Confirms trends and validates breakouts | Long-term trend following | Skewed by large volume days | Available on most platforms |
| VWAP | Tracks intraday price-volume relationships | Day trading and institutional orders | Limited to single-day analysis | Found on professional platforms |
| A/D Line | Identifies accumulation or distribution phases | Medium-term trend analysis | May lag in fast-moving markets | Widely supported |
| CMF | Tracks buying and selling pressure | Detecting trend reversals | Sensitive to short-term fluctuations | Universally available |
| Oscillator Matrix Money Flow | Detects excessive one-sided activity (overflow) | Identifies market overflow & potential reversals | Only on TradingView | Exclusive to TradingView |
Real-World Performance Analysis
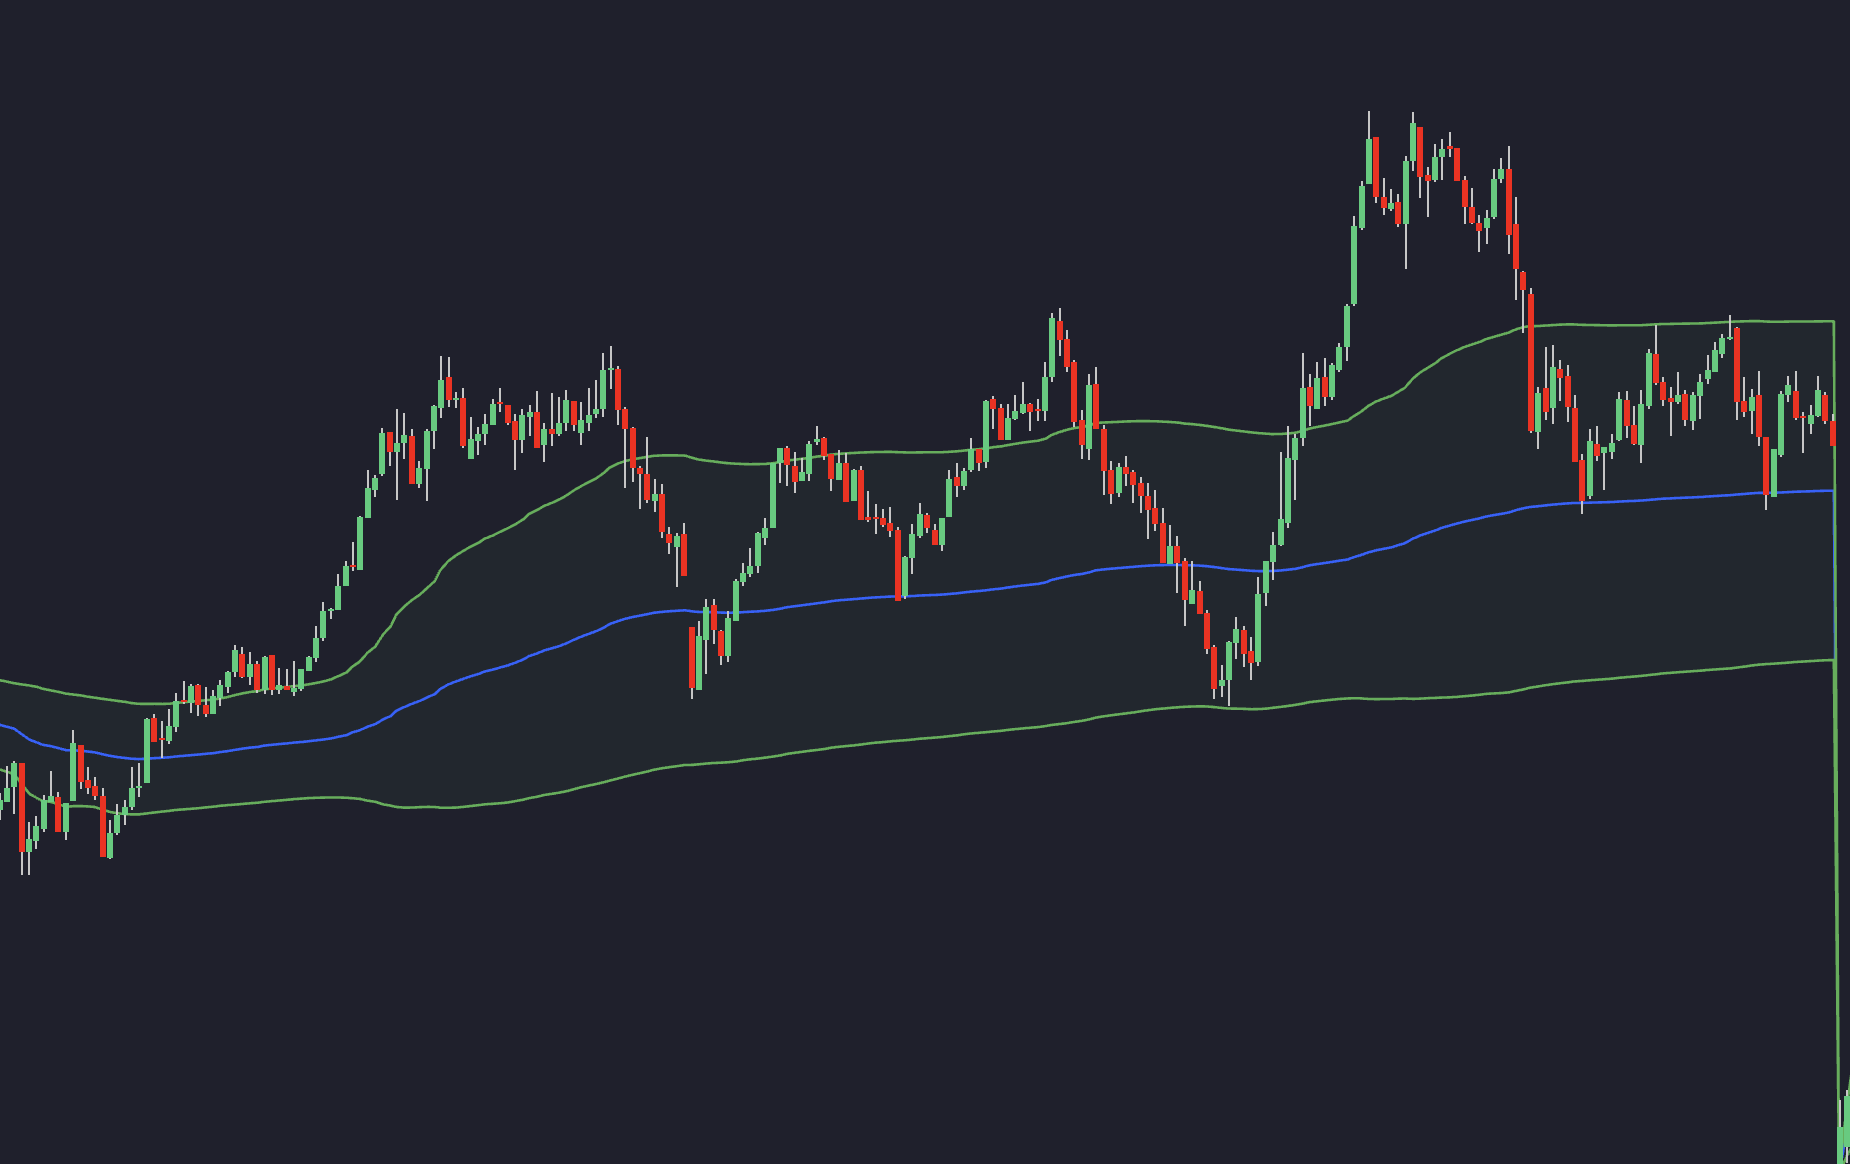
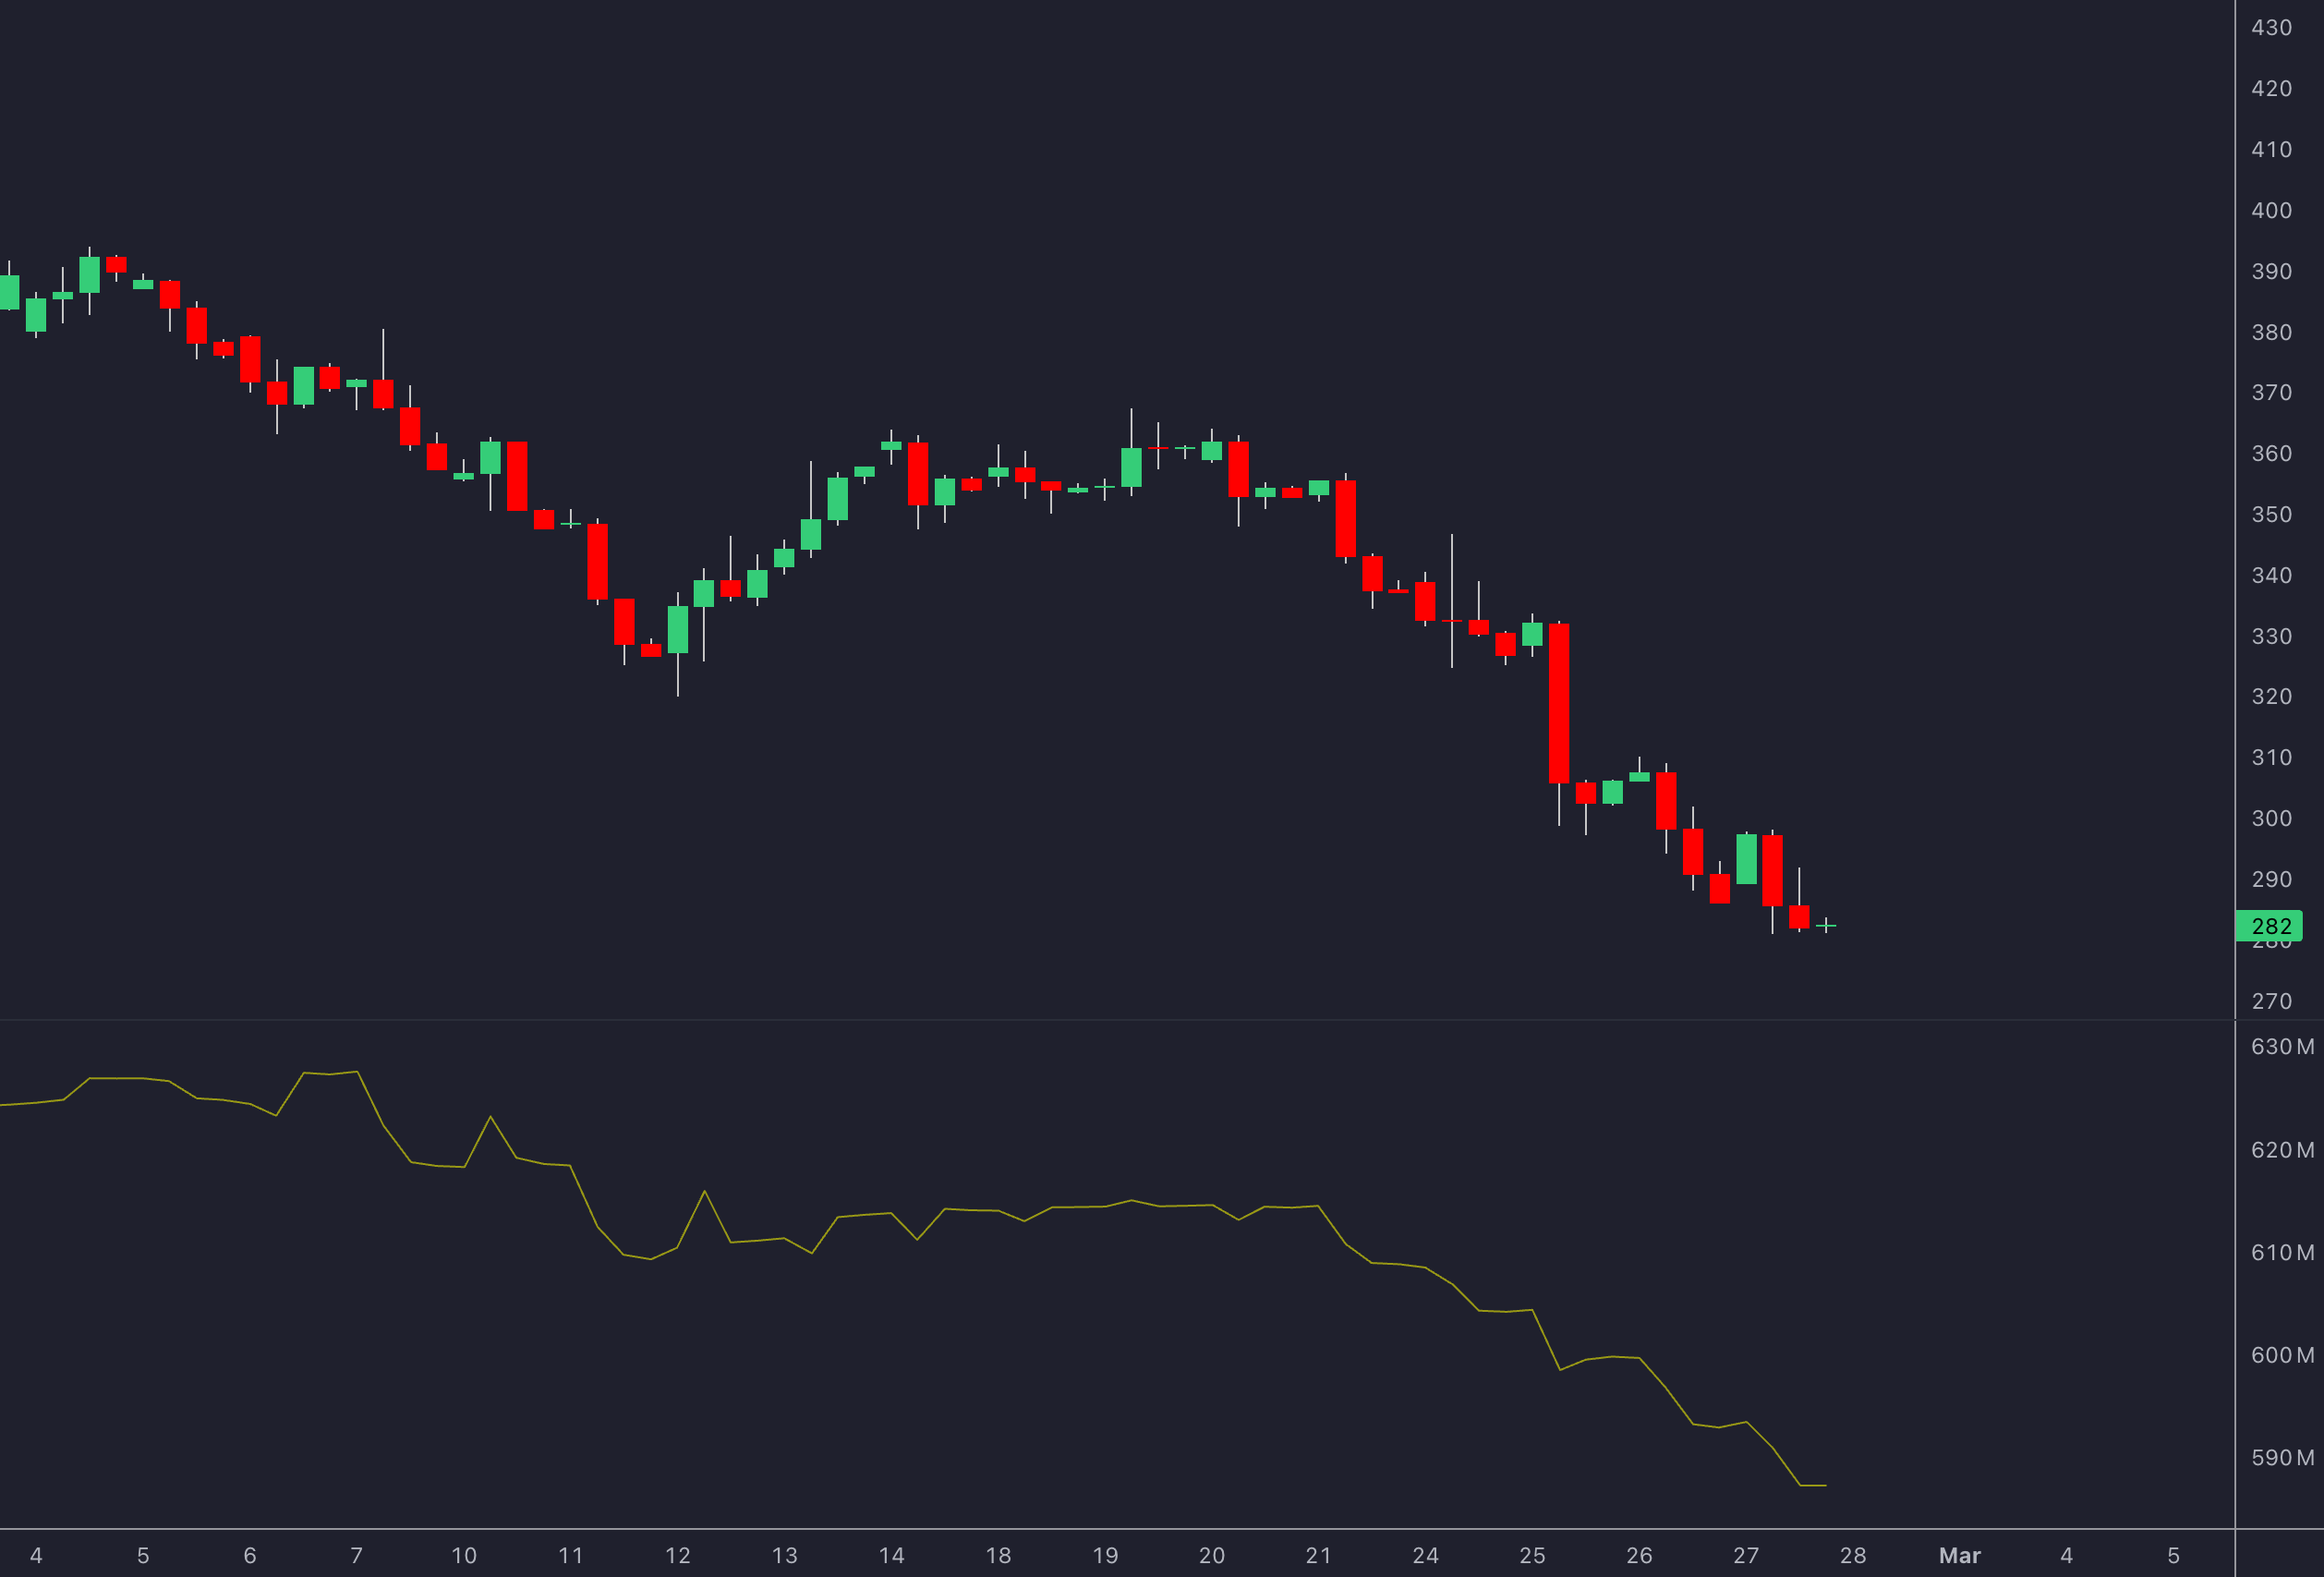
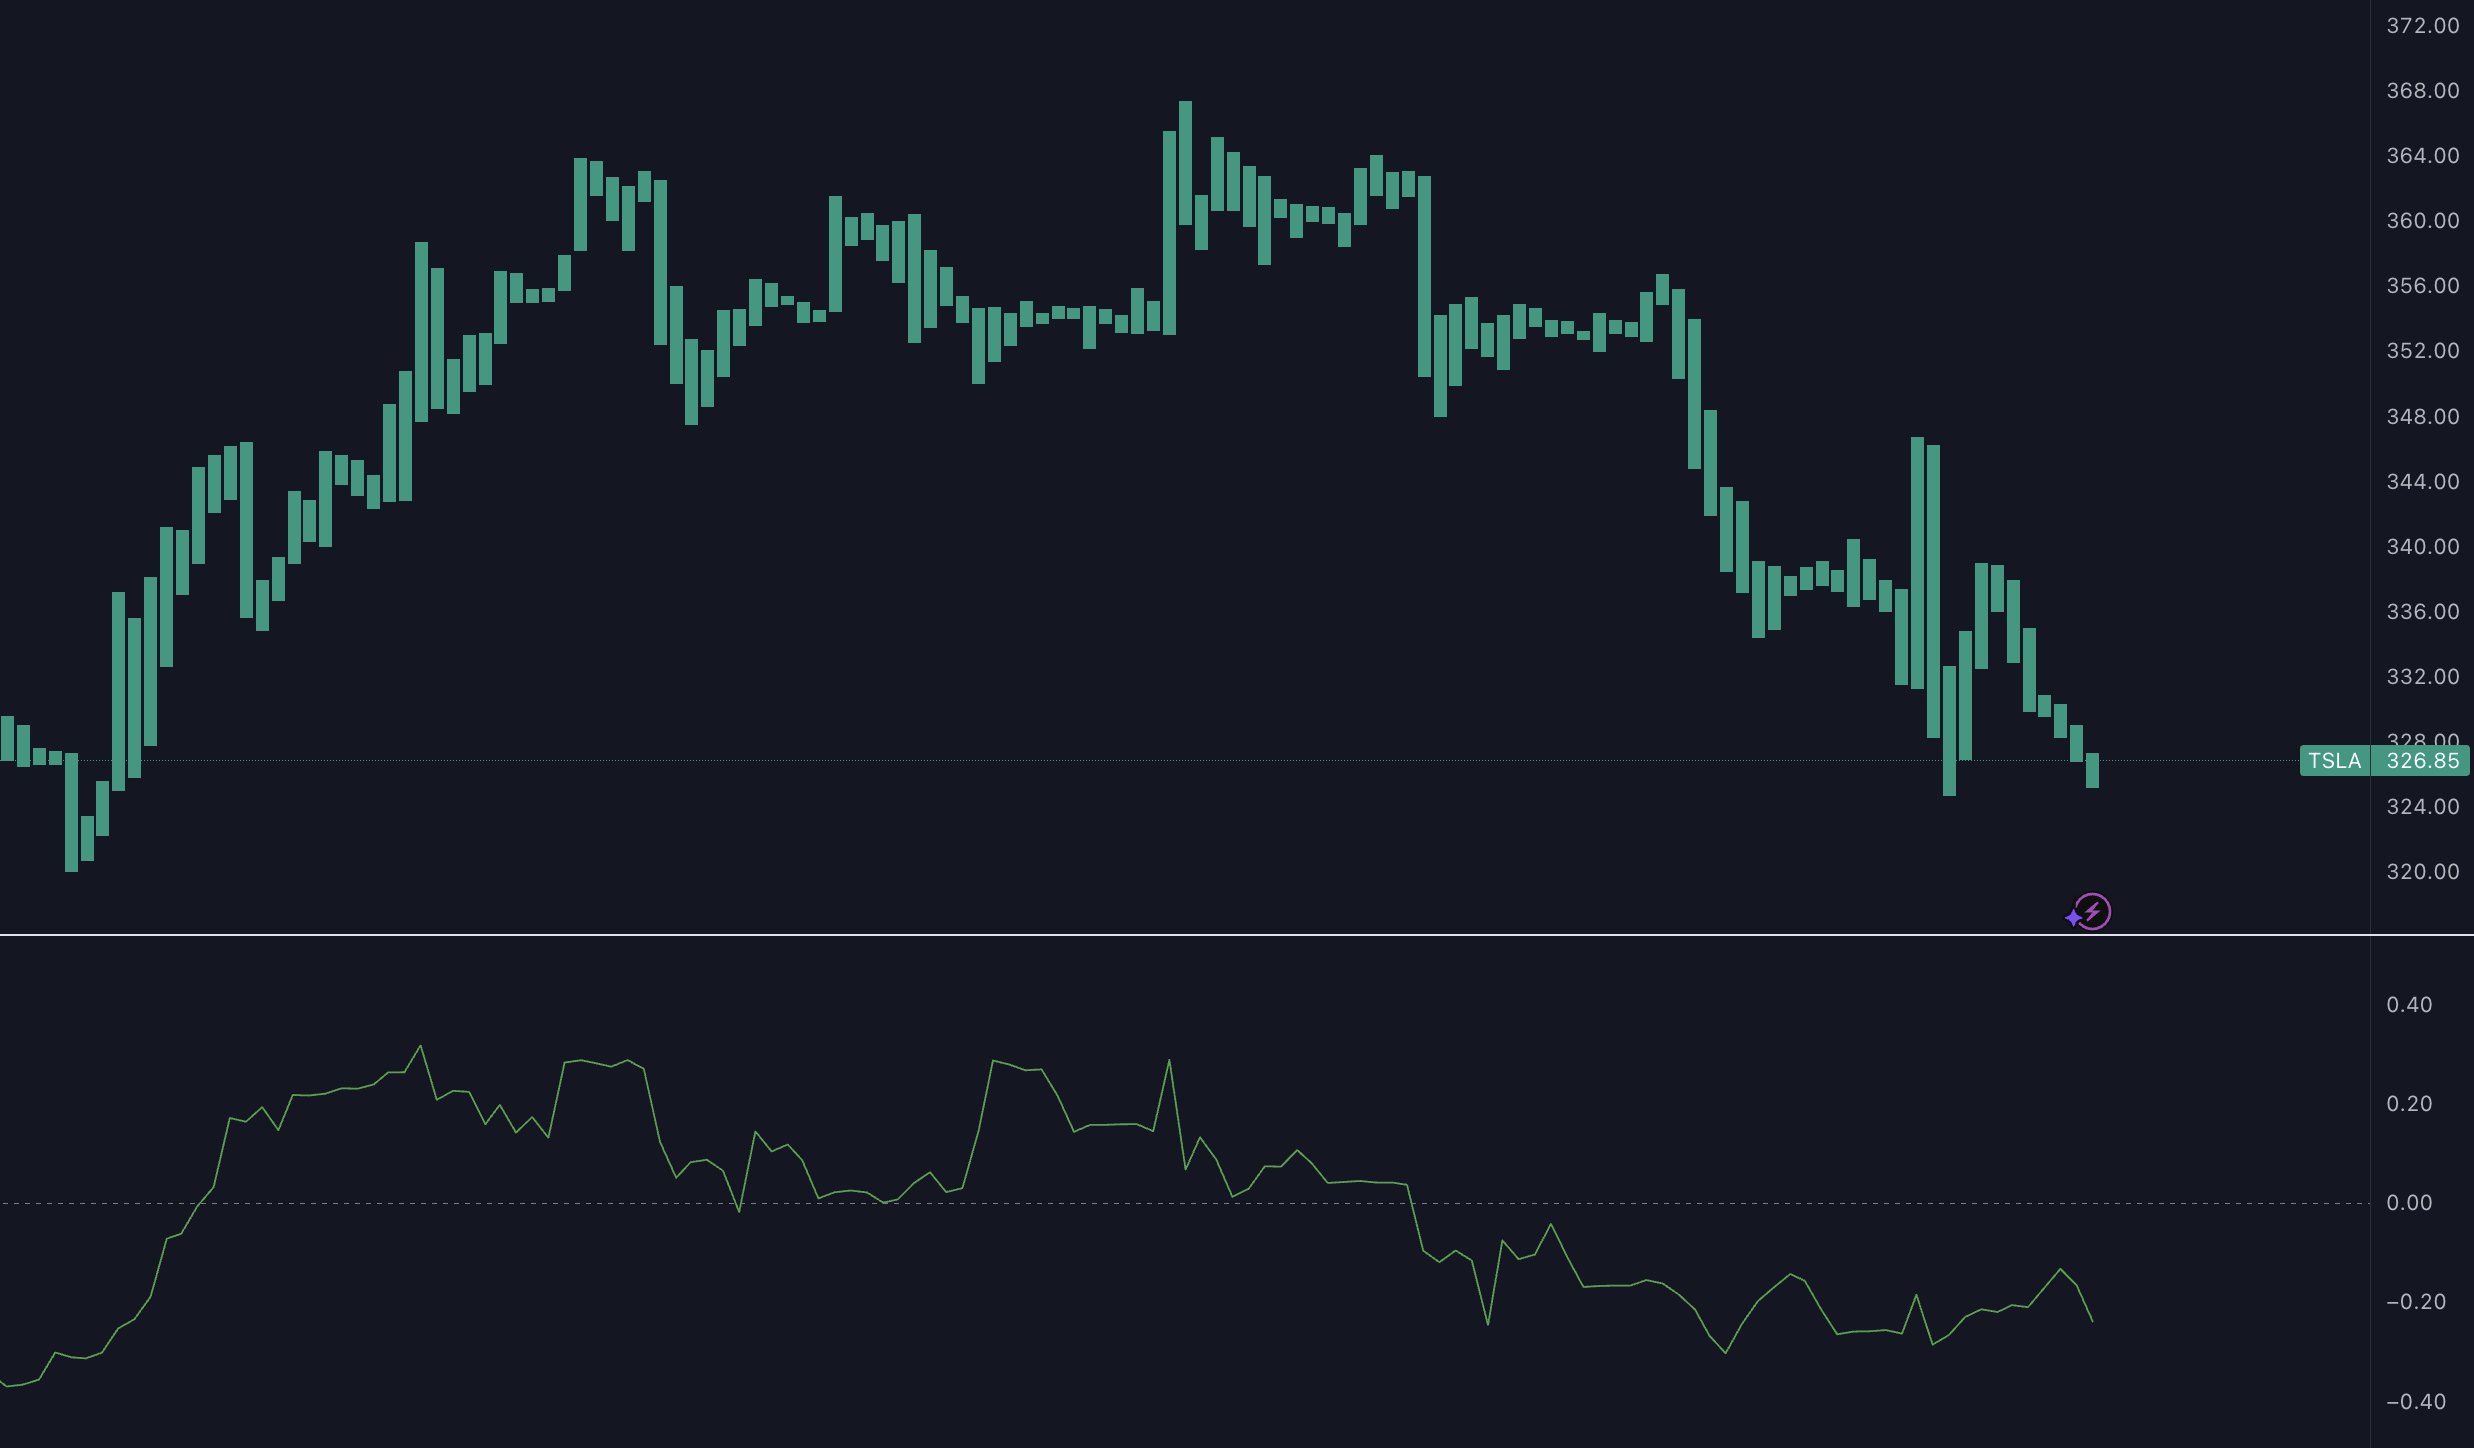
Recent market activity showcases the practical value of OBV and CMF for confirming trends and spotting reversals. For instance, during Apple's 12% rally (May-June 2024), OBV consistently aligned with price movement, reflecting strong buying pressure. Meanwhile, CMF's bearish divergence served as an early warning for Tesla's 10% drop in October 2024 [1].
These examples emphasize the importance of selecting the right indicator, which often hinges on how customizable and platform-friendly the solution is.
Customization and Integration Capabilities
While standard indicators offer limited flexibility, advanced tools allow traders to adjust for volatility and analyze multiple timeframes. The Oscillator Matrix Money Flow, for example, not only detects overflow but also lets users set custom Money Flow thresholds for more precise insights.
"By combining factors like volatility, volume, and price action, modern indicators offer deeper insights into market dynamics compared to traditional methods", says a top technical analyst in the trading community [1].
Strategy Compatibility
Each indicator suits a particular trading style:
- VWAP shines in intraday trading, helping day traders track price-volume trends.
- CMF and A/D Line are better for swing traders needing multi-day insights.
- OBV is ideal for long-term investors seeking reliable trend confirmation.
- Oscillator Matrix Money Flow is best for identifying market overflow and potential reversals.
Your choice of indicator will depend on your trading objectives, style, and the tools you have access to, as outlined in the comparison above.
Conclusion
Comparing volume indicators reveals how each serves different purposes, helping traders make informed decisions. Using multiple indicators together often gives a clearer view of the market. For example, combining OBV's ability to confirm trends with VWAP's precise intraday insights offers a more detailed understanding of market movements, as seen in Apple's rally and Tesla's decline.
How to Use These Indicators Effectively
Modern trading solutions have addressed some of the challenges with traditional volume analysis. Advanced indicators like the Oscillator Matrix Money Flow incorporate overflow detection and Money Flow thresholds, giving traders a more in-depth look at market liquidity and potential reversals.
Real-World Uses
These indicators and insights can be applied across different trading styles:
- Day traders can use VWAP for real-time market insights.
- Swing traders benefit from indicators like CMF and A/D Line to track medium-term trends.
- Long-term investors rely on OBV to confirm broader market trends.
- Trend reversal seekers can leverage the Oscillator Matrix Money Flow to spot overflow conditions.
The key is for traders to adapt their approach based on their style while staying aware of each indicator's limitations. Advanced tools that detect overflow add extra layers of confidence to trading strategies.
FAQs
What is the most accurate volume indicator?
On-Balance Volume (OBV) is often considered one of the most dependable indicators for spotting unusual volume patterns. Its simple calculation makes it handy for identifying shifts in market pressure. That said, its effectiveness depends on your trading strategy and timeframe.
| Indicator | Best Use Case |
|---|---|
| OBV | Tracking trends and gauging buying/selling pressure |
| VWAP | Intraday trading with precise average price levels |
| A/D Line | Spotting accumulation or distribution phases |
| CMF | Evaluating momentum and spotting potential trend reversals |
"Higher volume indicates stronger market conviction." [2]
Key Trading Insights: Volume analysis works best when combined with other factors. For example, high-volume breakouts usually signal stronger moves than low-volume ones. On the flip side, falling volume during a price trend can be a sign of weakness. Advanced indicators like the Oscillator Matrix Money Flow add another layer by factoring in overflow and Money Flow thresholds, making it easier to pinpoint unusual volume patterns.
Ultimately, the success of any volume indicator lies in how well you integrate it into your overall trading strategy. Each indicator has its strengths, and when used together, they can provide a more complete picture of market activity.