Explore how bid and ask prices affect trading success, from understanding spreads to utilizing advanced analysis tools for better decision-making.
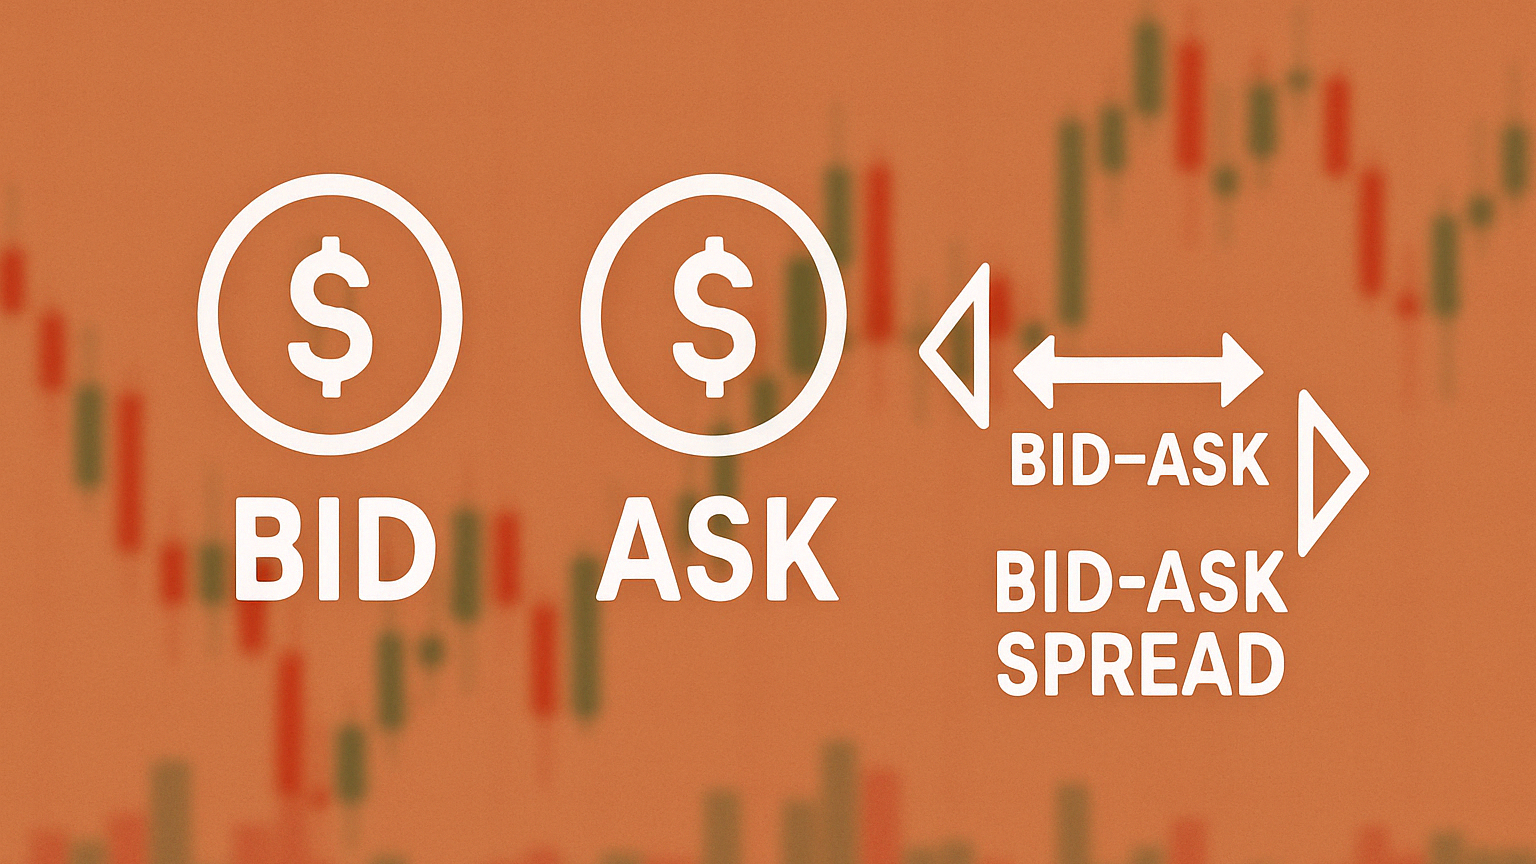
Understanding bid and ask prices is crucial for trading. The bid price is the highest amount a buyer offers, while the ask price is the lowest a seller accepts. The difference between them, the bid‑ask spread, reflects market liquidity and impacts trading costs. Here's what you need to know:
- Tight spreads (e.g., major stocks or currency pairs) mean lower costs and higher liquidity.
- Wider spreads (e.g., small‑cap stocks) indicate higher costs and lower liquidity.
- Volatility can widen spreads, increasing trading expenses.
Features like Depth of Market (DOM) provide real‑time bid‑ask analysis, identify entry/exit points, and help you understand evolving market conditions. Combining these capabilities with traditional spread analysis can improve decision‑making and reduce trading costs.
How Markets REALLY Work – Depth of Market (DOM)
Quick Comparison
| Feature | Automated Tools | Manual Bid‑Ask Analysis |
|---|---|---|
| Ease of Use | Automated, user‑friendly | Time‑consuming, requires expertise |
| Cost | $24.99–$59.99/month | Often free, but lacks advanced capabilities |
| Accuracy | Algorithm‑driven analysis | Relies on trader interpretation |
| Learning Curve | Low, with built‑in features | High, requires deep market knowledge |
| Real‑Time Insights | Yes, with alerts and historical data | Limited to manual monitoring |
For better results, focus on assets with tight spreads, trade during high‑liquidity periods, and use limit orders to control costs. Pairing automated features with manual analysis ensures a balanced approach to understanding market dynamics.
1. Price Analysis Features
The Depth of Market (DOM) functionality provides real‑time insights into bid‑ask activity. Its display includes five key columns: PRICE, BID, SELL, BUY, and ASK, giving traders a clear view of market movements. By combining 24‑hour historical data with live updates, it adds valuable context to your analysis and helps refine trading strategies.
"The DOM tool allows me to see the market faster and confirm entries/exits."
Here are some standout capabilities in modern bid‑ask analysis:
| Feature | Function | Trading Impact |
|---|---|---|
| Volume Profile | Highlights price areas with high volume | Helps identify support/resistance levels |
| Time & Sales Panel | Displays detailed trade information | Useful for spotting absorption patterns |
| Key Intraday Levels | Marks up to 24 critical price points | Assists in finding trading opportunities |
These features integrate seamlessly with platforms such as TradingView, NinjaTrader, MetaTrader 4/5, and Thinkorswim.
With thousands of users, the DOM tool continues to serve traders seeking precise market insights.
2. Core Bid‑Ask Trading Concepts
Bid‑ask dynamics play a key role in determining trading costs and execution efficiency. These dynamics shift based on market conditions, directly impacting traders' outcomes.
The bid‑ask spread is a critical factor in trading costs. For example, in highly liquid currency markets, spreads can be as small as 0.01%. On the other hand, small‑cap stocks often have spreads between 1% and 2%, which can significantly affect returns.
Market liquidity heavily influences spread behavior. Here's a quick breakdown:
| Market Type | Typical Spread | Trading Volume Impact |
|---|---|---|
| Major Currency Pairs | Extremely narrow (0.01%) | High liquidity, smooth execution |
| Large‑Cap Stocks | Moderate | $515 B average daily volume (2023) |
| Fixed‑Income ETPs | Around 0.25% | Low spreads, cost‑effective trading |
| Small‑Cap Stocks | 1–2% or higher | Limited liquidity, higher transaction costs |
Other factors, like market‑maker activity and volatility, also shape bid‑ask spreads. During periods of high volatility, spreads often widen, leading to increased costs and less predictable price movements.
For better trading outcomes, focus on assets with consistent volume and tight spreads. For instance, fixed‑income exchange‑traded products (ETPs) usually have an average spread of 0.25%, offering a cost‑efficient option for regular trading.
The forces of supply and demand are at the heart of bid‑ask dynamics. High demand narrows spreads, cutting costs, while low activity or market stress can cause spreads to widen significantly. Recognizing these patterns helps traders time entries/exits, gauge sentiment, and size positions wisely.
Understanding these principles is essential for navigating price movements effectively. Advanced analysis features build on these concepts, offering deeper insights into market behavior.
Advantages and Limitations
| Feature | Automated Tools | Traditional Bid‑Ask Analysis |
|---|---|---|
| Price Forecasting | Adjustable memory settings for exit strategies | Limited to current data and manual trend evaluation |
| Market Analysis | Automated pattern detection and classification | Based on manual spread calculations and market‑maker behavior |
| Cost Structure | $24.99–$59.99/month subscription | Often free with basic data, though advanced feeds may incur fees |
| Learning Curve | Intuitive interface with built‑in automation | Requires deep market expertise |
| Real‑time Alerts | Built‑in notifications for price action and macro events | Manual monitoring or basic price alerts |
| Accuracy | Algorithm‑driven analysis with pattern recognition | Relies on trader interpretation |
Challenges to Keep in Mind
Traditional bid‑ask analysis comes with:
- Time‑consuming monitoring and manual calculations
- A steep learning curve for accurate signal interpretation
- The need for constant attention to price movements
Automated features have their own considerations:
- Subscription fees may deter some users
- Depends on platform uptime and technical support
- Risk of overreliance on automated signals
- Requires proper setup to achieve optimal performance
Many traders succeed by combining both approaches. Automation saves time and provides insights, but pairing it with traditional analysis ensures a well‑rounded view of market dynamics.
Key Findings
Our review of bid‑ask dynamics highlights practical ways to cut trading costs. For instance, trading 1,000 shares with a $0.05 spread costs $50 per trade. With 20 trades a month, this adds up to $12,000 annually. These insights set the stage for cost‑saving strategies and market analysis.
Market Conditions and Trading Costs
Trading costs are heavily influenced by market conditions. Here's a breakdown of spreads and strategies based on market type:
| Market Type | Spreads | Suggested Strategy |
|---|---|---|
| High Liquidity | Narrow spreads, fast execution | Scalping, day trading |
| Low Liquidity | Wide spreads, slower execution | Swing trading, position trading |
| Volatile Markets | Variable spreads, higher risk | Limit orders, smaller positions |
Strategies to Reduce Costs
The DOM tool provides 24‑hour historical data, helping traders pinpoint optimal entry and exit points. Pairing this with traditional spread analysis can sharpen your decision‑making. Here are some additional cost‑saving tips:
- Trade during high‑liquidity periods for better pricing.
- Use limit orders to control execution prices.
- Monitor spreads continuously and adapt strategies as needed.
- Break large orders into smaller pieces in less liquid markets.