Learn to differentiate between true breakouts and false breakouts in trading to enhance your decision-making and avoid costly mistakes.
In trading, distinguishing between breakouts and false breakouts can help you avoid losses and seize real opportunities. A breakout occurs when an asset's price moves decisively past support or resistance levels, often with high volume, signaling a potential trend shift. False breakouts, however, are misleading moves where prices briefly cross key levels but quickly reverse, often due to low volume or market manipulation.
Key Differences:
- Volume: True breakouts show a significant volume surge; false breakouts don't.
- Price Action: Strong, decisive candles for real breakouts; indecisive patterns like doji for false ones.
- Market Context: True breakouts align with trends; false breakouts occur in isolation.
- Retests: Real breakouts hold the level on retests; false ones fail quickly.
- Movement: Sustained moves for true breakouts; quick reversals for false breakouts.
Quick Comparison:
| Characteristic | True Breakouts | False Breakouts |
|---|---|---|
| Volume | High, 50%+ increase | Low or declining |
| Price Action | Strong candles, minimal wicks | Indecisive patterns (e.g., doji) |
| Market Context | Matches broader trends | Happens in isolation |
| Retests | Holds broken level | Fails on first retest |
| Movement | Sustained beyond level | Reverses quickly |
To spot real breakouts, focus on volume spikes, candlestick patterns, and multi-timeframe analysis. Leverage the advanced indicators available on TradingView through LuxAlgo to identify patterns, test strategies, and set customized alerts for better decision-making. By mastering these techniques, you can trade with more confidence and precision.
Breakouts vs False Breakouts: Main Differences
What Are Breakouts and False Breakouts
A breakout happens when an asset's price moves decisively past a well-established support or resistance level, often accompanied by high trading volume. This signals a potential shift or continuation in trend. For example, if a stock trades between $50 and $55 for weeks, a breakout occurs when the price closes above $55 with strong volume[1].
On the flip side, false breakouts (or fakeouts) are misleading moves where the price briefly goes beyond support or resistance levels but quickly reverses. These can trap traders who act too soon without proper confirmation. In forex markets, around 60-70% of breakouts turn out to be false signals[4].
Comparison Chart
| Characteristic | True Breakouts | False Breakouts |
|---|---|---|
| Volume | 50% or more increase in average trading volume | Low or declining volume during the move |
| Price Action | Strong, decisive candles with little to no wicks | Doji patterns or shooting star candles |
| Market Context | Matches broader trends and fundamentals | Happens in isolation without supporting factors |
| Retest Behavior | Holds broken level as new support/resistance | Fails to maintain the level on first retest |
| Price Movement | Sustained move beyond the level[1] | Minimal movement before reversing direction |
Take Tesla (TSLA) as an example: in Q1 2023, it briefly broke above the $900 resistance level but quickly reversed due to low trading volume. This is a textbook case of a false breakout.
Newer traders often fall into the trap of false breakouts, while experienced traders focus on confirming signals, especially through volume analysis[1].
These distinctions lay the groundwork for identifying breakouts effectively, which we'll dive into next by examining candlestick patterns and volume trends.
Advanced Technical Analysis: False Breakout Traps
How to Spot Real vs False Breakouts
Building on volume and price action analysis, these techniques can help you determine whether a breakout is genuine or not:
Reading Candlestick Signals
Candlestick patterns can provide valuable clues. For example, a bullish engulfing candle after a resistance break often signals strong buying interest[1]. On the other hand, patterns like long-legged doji near breakout levels may indicate market indecision[2]. If you notice pin bars or shooting stars shortly after a breakout, it could mean price rejection[5].
Additionally, patterns like three white soldiers during an upward breakout or three black crows during a downward breakout suggest sustained momentum and commitment from traders[3].
Understanding Volume Signals
Volume is one of the most reliable indicators for validating breakouts. Genuine breakouts usually show a 2-3x surge in volume compared to the average trading activity[6]. This spike often reflects strong institutional involvement and real market interest.
Here are some key volume patterns to watch for:
- Initial surge: Indicates strong participation as the breakout begins.
- Follow-through volume: Confirms ongoing momentum.
- Pullback volume: Should decrease after the breakout.
- Gradual pre-breakout increase: Suggests growing interest before the breakout occurs.
Checking Multiple Timeframes
Analyzing multiple timeframes can help you avoid being misled by false signals. A valid breakout should align across at least three timeframes:
- Lower timeframe (e.g., 5-minute): Offers insight into immediate price movements.
- Intermediate timeframe (e.g., 1-hour): Shows momentum more clearly.
- Higher timeframe (e.g., daily): Validates the overall trend.
For example, what looks like a breakout on a 5-minute chart might just be noise when viewed on a daily chart. Tools like LuxAlgo's SuperTrend Ribbon can simplify this process by showing trend strength across multiple timeframes. Additionally, Volume Flow can help identify institutional activity, further confirming whether a breakout is real.
Trading Methods for Both Scenarios
Trading Real Breakouts
When dealing with confirmed breakouts, managing your position size and controlling risk are essential. A smart strategy involves splitting your entry into tiers and planning for profit-taking along the way.
For entries, wait for a candle to close firmly above resistance (for long positions) or below support (for short positions). Place your initial stop-loss just below the breakout level for long trades or just above it for short trades. Aim for a risk-reward ratio of at least 1:2, though 1:3 or better is ideal.
Here’s how to execute:
- Entry: Divide into 2-3 tiers (e.g., 40% at the breakout, 30% on a pullback).
- Stop-Loss: Position it 0.5% below/above the breakout level.
- Profit Targets: Set targets at 4% and 7% gains.
Features like LuxAlgo's Volume Profile can help pinpoint accumulation areas, while the Order Flow Matrix can reveal institutional activity – both useful for gauging the strength of a breakout.
Trading False Breakouts
False breakout strategies require quick reactions to price rejection. Unlike real breakouts, these setups rely on spotting reversal signals promptly.
Key steps include:
- Enter when reversal candlesticks appear, placing stops 0.25-0.5% beyond the false breakout level.
- Profit Targets: Look to exit at the origin point of the false breakout move.
Use breakout strategies in trending markets, while false breakout methods work best during consolidation. LuxAlgo’s features, such as the Volume Profile and institutional-level order flow analysis, help identify key price levels and patterns in both scenarios.
Tools for Better Analysis
LuxAlgo Pattern Recognition and Volume Analysis
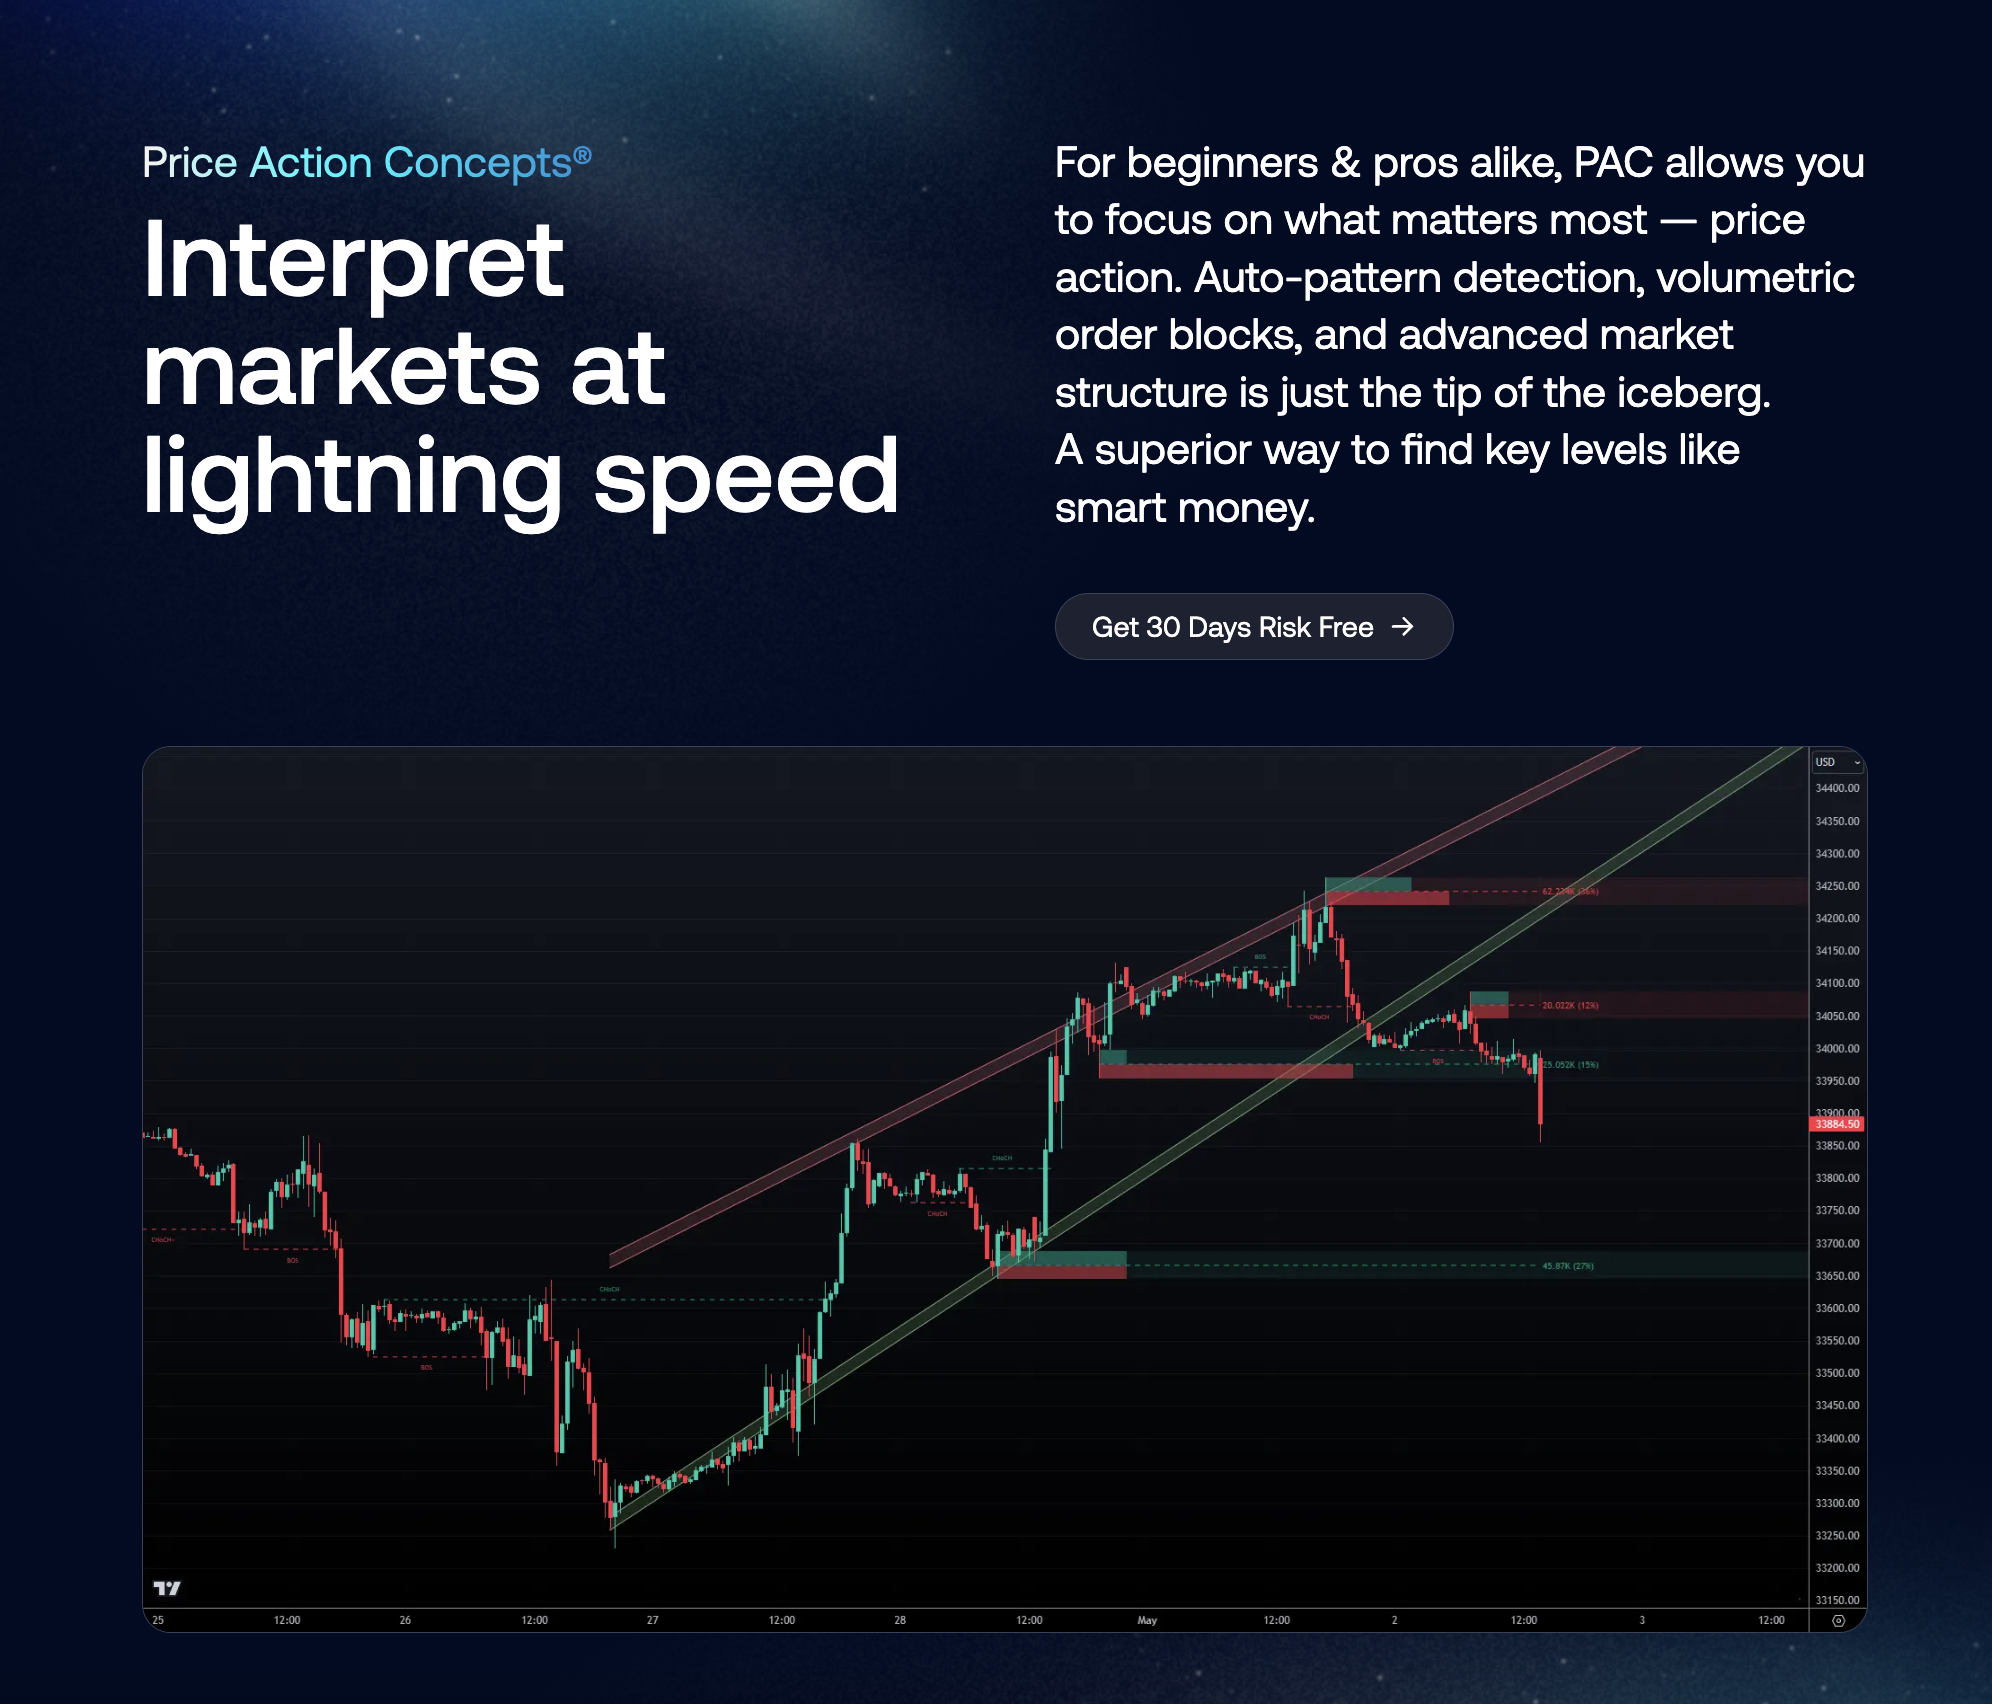
The Price Action Concepts (PAC) toolkit is equipped with advanced pattern recognition features that automatically detect a wide range of chart patterns to help you identify key market structures.
Testing with LuxAlgo AI
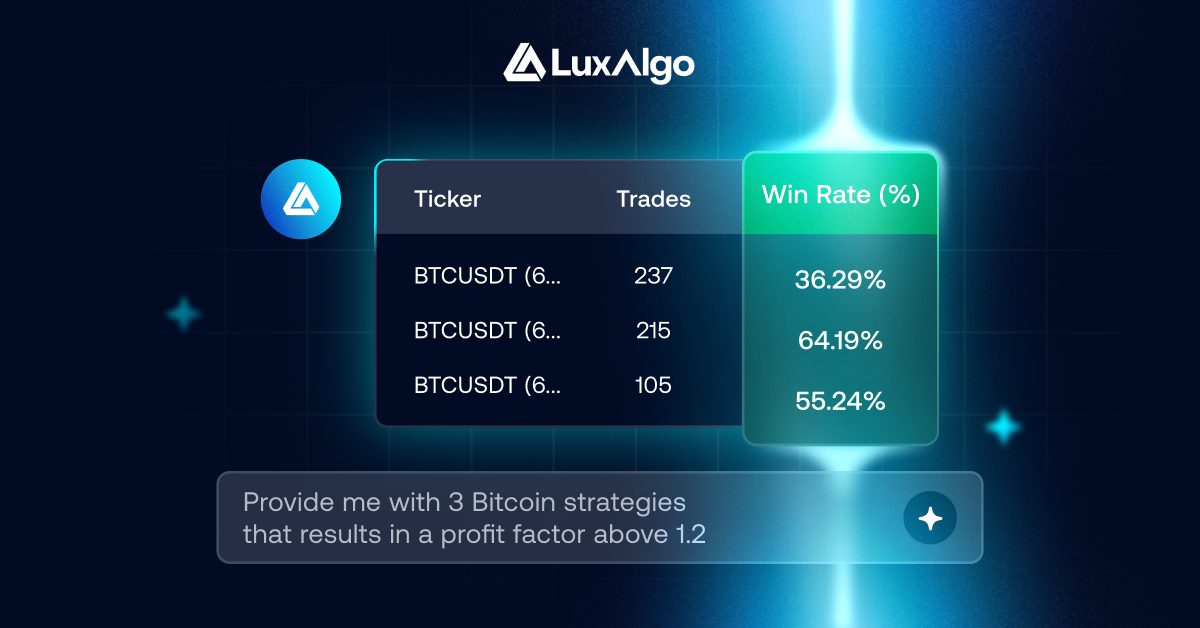
LuxAlgo's AI Backtesting Assistant allows traders to test breakout strategies using historical data. This feature helps refine strategies by:
- Analyzing extensive historical data to uncover successful breakout patterns.
- Testing different strategy variations under various market conditions.
- Fine-tuning entry points, stop-loss levels, and profit targets.
Setting Up Trade Alerts
LuxAlgo integrates with TradingView to enable customized breakout alerts. Here’s how to set up alerts effectively:
- Configure alerts for specific chart patterns.
- Add volume thresholds to filter out breakouts with low trading activity.
- Set alerts that require confirmation across multiple timeframes.
These multi-layered alerts ensure traders only act on breakouts with strong volume and institutional backing. Additionally, alerts can be linked to third-party platforms for automated trading when breakout criteria are met [3].
Conclusion
To successfully navigate breakout trading, using multiple confirmation methods with technical indicators is essential. Identifying true breakouts often hinges on combining factors like sustained volume increases and synchronized signals across different timeframes[1][3].
Effective risk management is equally critical in breakout trading[2]. This approach helps filter out false signals by relying on techniques like candlestick patterns and volume analysis.
By following these techniques, traders can focus on:
- Validating signals with multiple indicators across timeframes
- Confirming momentum through volume analysis
- Refining strategies using features available via LuxAlgo and historical data
- Regularly assessing and fine-tuning their approach
This process underscores the importance of blending technical validation, momentum confirmation, disciplined risk management, and ongoing performance reviews. By consistently applying these methods, traders can improve their ability to spot profitable breakouts while avoiding costly missteps[1][2].
FAQs
What is the best indicator to confirm a breakout?
Volume is often considered one of the most dependable measures for confirming breakouts, especially when paired with momentum indicators like RSI and MACD, as well as multi-timeframe analysis[3].
Here are some key technical indicators for confirming a breakout:
- Volume Analysis: Look for significant spikes in volume, often signaling institutional activity.
- Moving Averages: Pay attention to price movements crossing above or below important moving averages.
- RSI (Relative Strength Index): Check for overbought or oversold conditions (above 70 or below 30).
- MACD: Use crossovers to confirm the direction of the trend.
Multi-timeframe analysis also plays a crucial role in verifying breakouts, as it provides a broader perspective on the market trend.
For traders seeking advanced features, LuxAlgo’s Breakout Detector combines price action and volume data to help identify stronger breakout setups.