Learn how Chaikin Money Flow combines price and volume to analyze market trends and assess buying or selling pressure effectively.
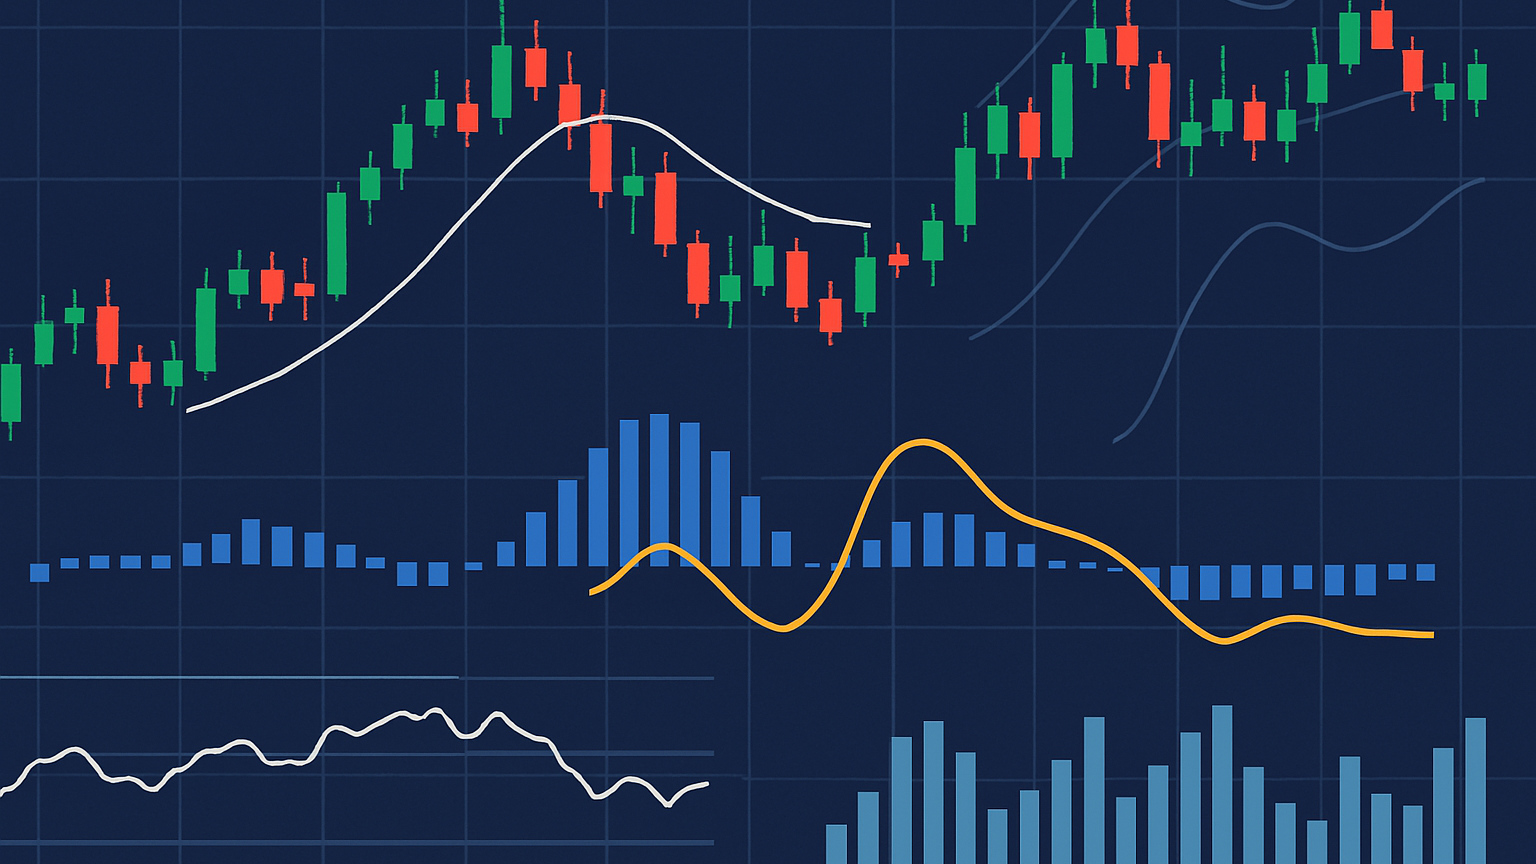
The Chaikin Money Flow (CMF) is a technical indicator that combines price and volume data to assess buying and selling pressure in the market. It helps traders confirm trends, identify potential reversals, and analyze market sentiment. Here's what you need to know:
- Formula: CMF uses the Money Flow Multiplier and trading volume to calculate Money Flow Volume, which is then averaged over a chosen period.
- Timeframes:
- 21-period CMF: Best for short-term trading.
- 63-period CMF: Suited for medium-term trends.
- 252-period CMF: Ideal for long-term analysis.
- Key Signals:
- Positive CMF values indicate buying pressure.
- Negative CMF values suggest selling pressure.
- Divergences between CMF and price hint at trend reversals.
While CMF is useful for analyzing trends, it can produce false signals in volatile markets. Combining it with the advanced signal analysis and volume insights provided by LuxAlgo can improve accuracy by reducing noise and validating signals. CMF works best as part of a broader trading strategy.
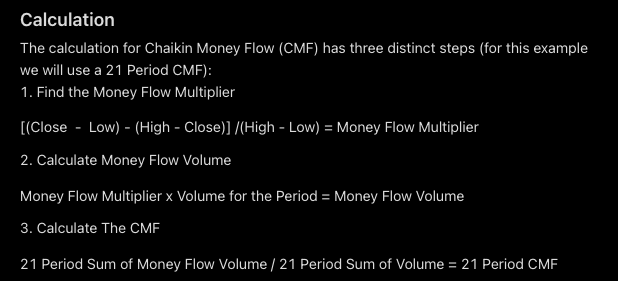
Formula and Calculation of Chaikin Money Flow
The Chaikin Money Flow (CMF) combines price and volume data to assess buying and selling activity. It uses a few key components to deliver insights into market trends.
Money Flow Multiplier Formula
This formula identifies where the closing price falls within the trading range, with results ranging from -1 to +1. A positive value suggests the close is near the high, indicating buying activity, while a negative value points to selling activity.
Money Flow Multiplier = [(Close - Low) - (High - Close)] / (High - Low)
Money Flow Volume and CMF Calculation
To find the Money Flow Volume, multiply the Money Flow Multiplier by the trading volume:
Money Flow Volume = Money Flow Multiplier × Volume
CMF is then calculated by summing the Money Flow Volume over a specific period and dividing it by the total volume for that same period.
Choosing the CMF Period
The period you select for CMF analysis depends on your trading goals:
- 21-period CMF: Ideal for short-term trading and capturing quick price changes.
- 63-period CMF: Useful for analyzing medium-term trends.
- 252-period CMF: Best for identifying long-term market trends.
Shorter periods highlight rapid market movements, while longer periods help smooth out noise and reveal broader trends. Understanding these calculations allows traders to incorporate CMF into their strategies effectively.
Using Chaikin Money Flow in Trading
Confirming Trends with CMF
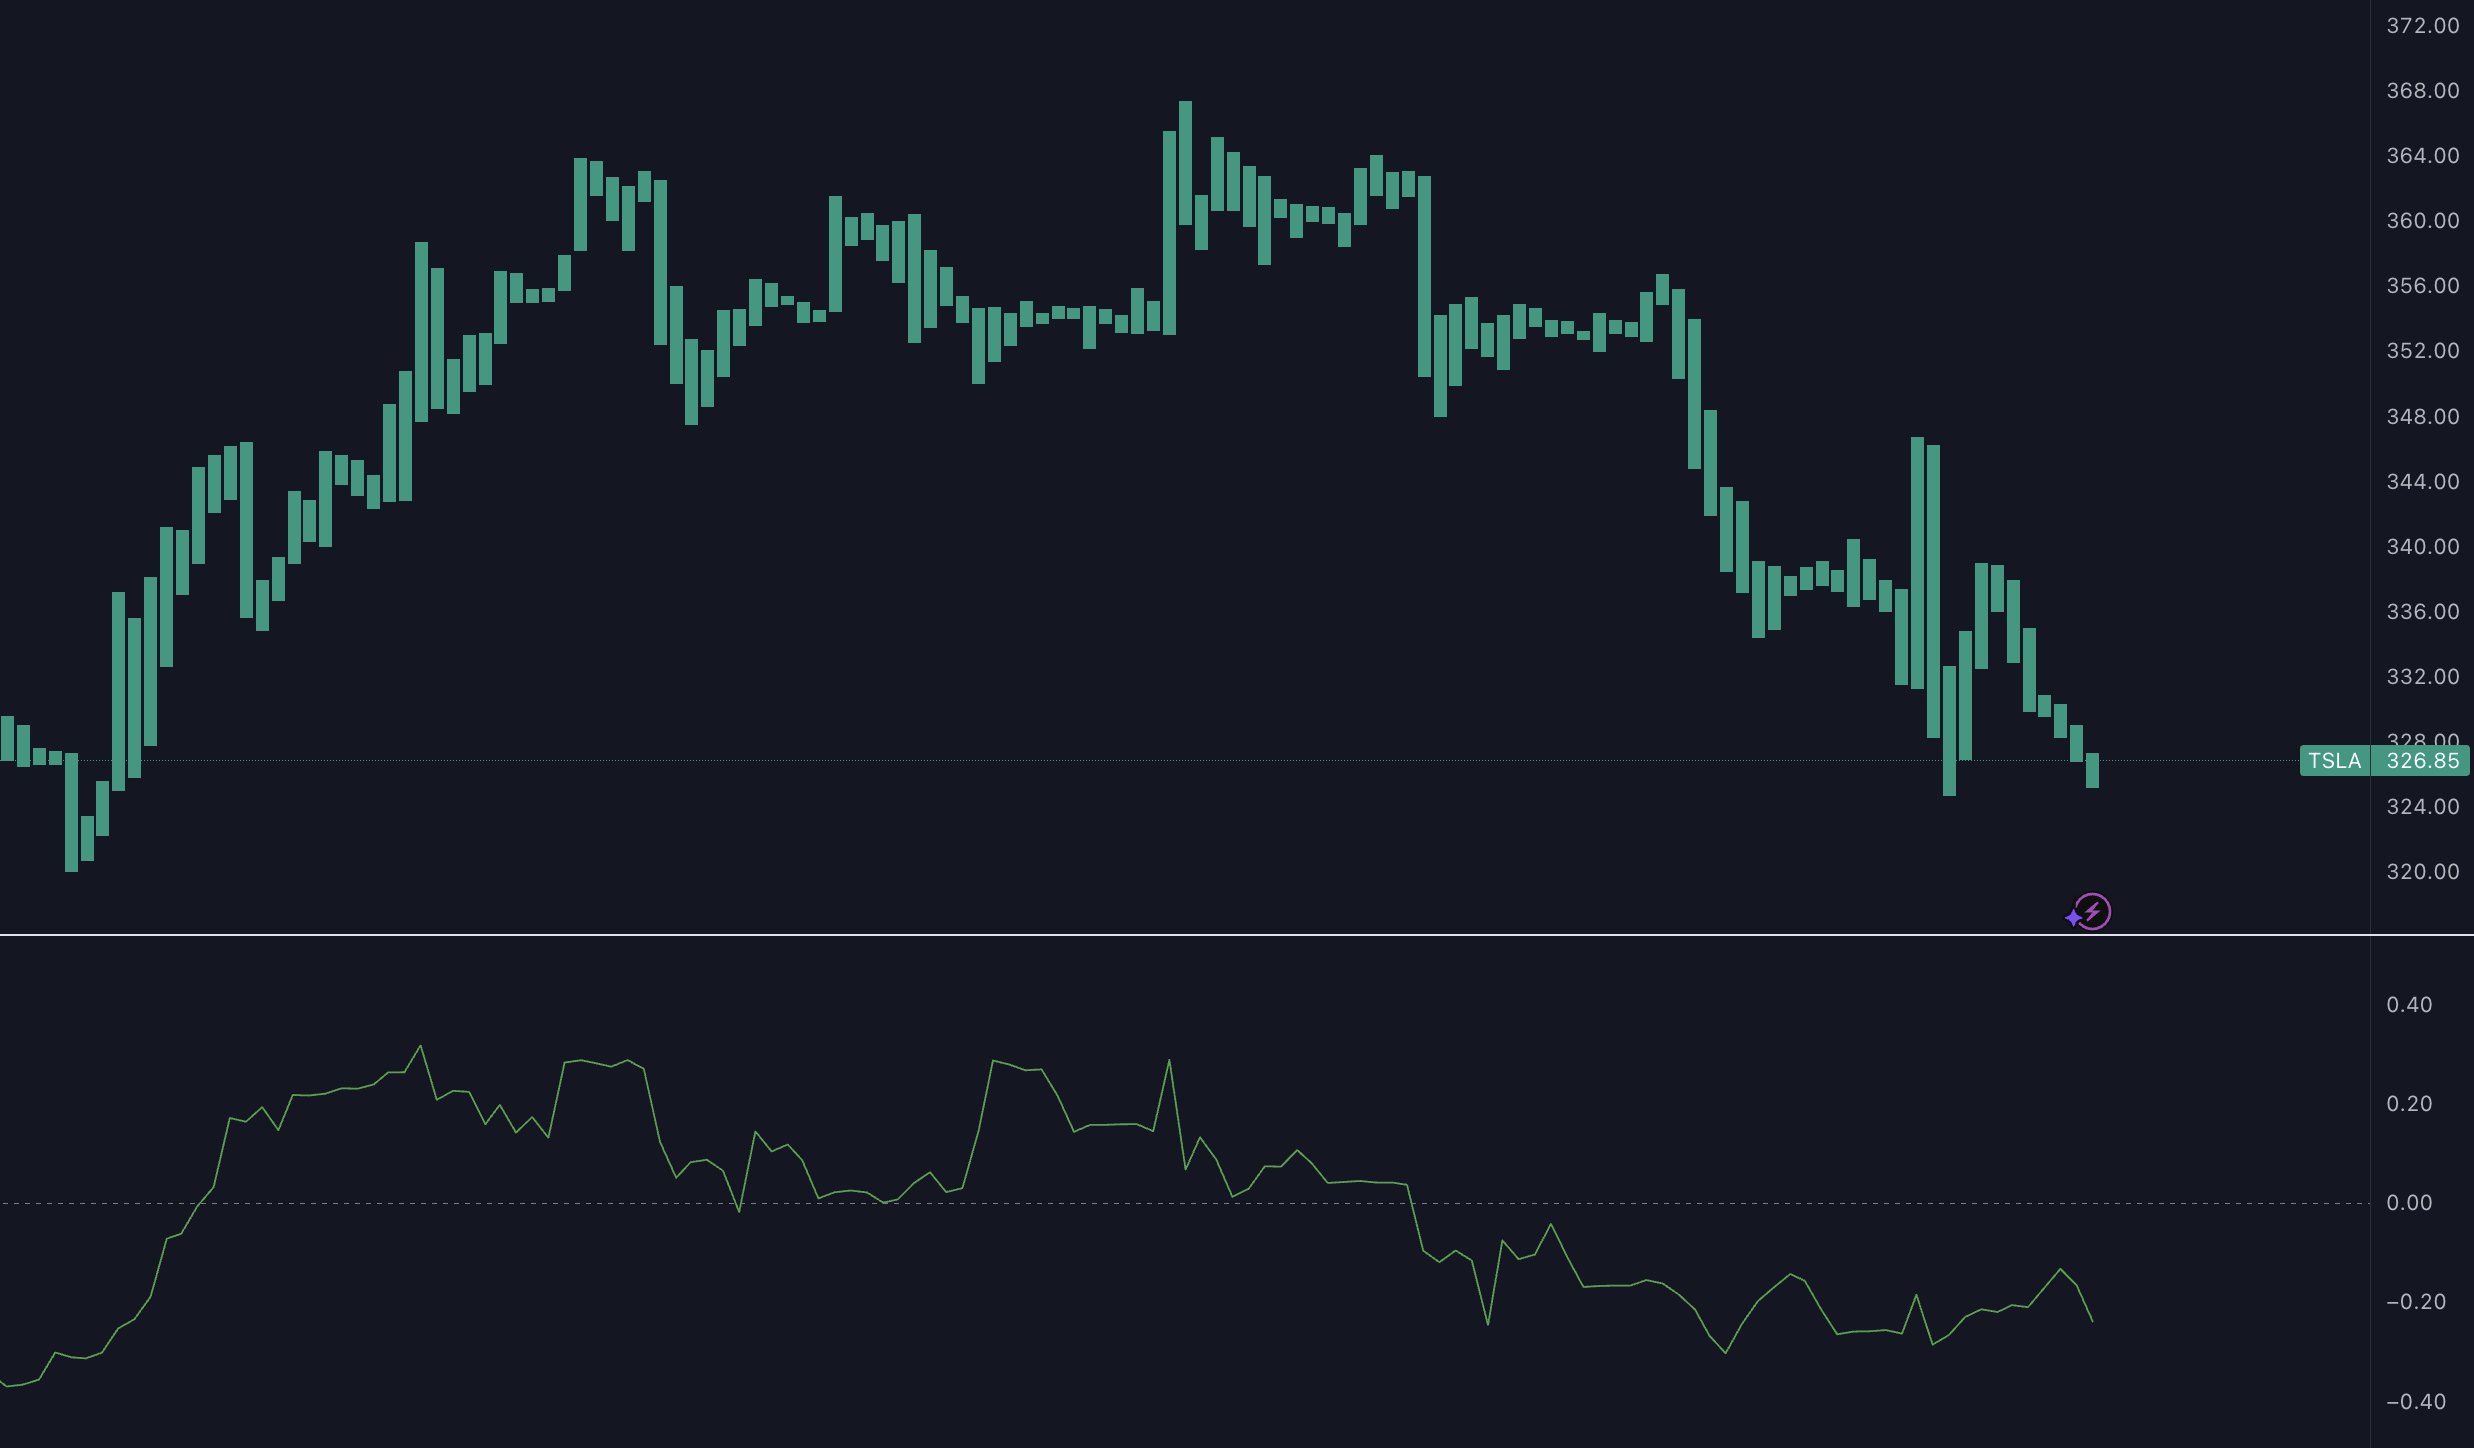
The Chaikin Money Flow (CMF) is a handy indicator for verifying market trends and price movements. When CMF values stay positive, it shows buying pressure during uptrends. On the flip side, negative values point to selling pressure in downtrends.
Pay attention to how price action aligns with CMF. For instance, higher highs in both price and CMF support bullish momentum during an uptrend. This alignment can boost a trader's confidence in trend-following strategies.
Analyzing Crosses and Divergences
When CMF crosses above zero, it signals growing buying pressure. A move below zero indicates increasing selling pressure. CMF divergences, where price action and CMF behavior don't match, often suggest potential trend reversals. Here's a breakdown:
| Divergence Type | Price Action | CMF Behavior | Signal Indication |
|---|---|---|---|
| Bullish | New Price Low | Higher CMF Low | Possible Upward Reversal |
| Bearish | New Price High | Lower CMF High | Possible Downward Reversal |
| Regular | Trending Up/Down | CMF Confirms | Likely Trend Continuation |
CMF Limitations
While CMF is useful, it can sometimes give false signals in volatile markets due to its sensitivity to price changes. Using shorter periods captures quick shifts but might increase noise, while longer periods smooth out fluctuations but could miss short-term moves.
To get more reliable insights, combine CMF with other indicators or analysis methods. This approach helps reduce the impact of its limitations and improves overall trading strategies.
Enhancing CMF Analysis with the LuxAlgo Oscillator Matrix
Overview of the LuxAlgo Oscillator Matrix
The LuxAlgo Oscillator Matrix is an exclusive solution that refines technical analysis by integrating volume insights with trend detection. Designed to complement indicators like CMF, the Oscillator Matrix provides longer-term trend indications that support shorter-term signals, helping traders identify potential reversals and confirm market momentum. For more details, refer to the official introduction.
How the Oscillator Matrix Enhances CMF Analysis
By overlaying its sophisticated analysis, the Oscillator Matrix filters market noise and offers clearer signals when used alongside CMF. It incorporates aspects of money flow and momentum to identify turning points and validate trends, thereby strengthening your overall trading strategy.
Benefits of Using the Oscillator Matrix
The integration of the Oscillator Matrix with CMF analysis provides several advantages:
- Enhanced Signal Clarity: Reduces noise and minimizes false signals.
- Trend Confirmation: Offers longer-term trend insights that support short-term signals.
- Improved Risk Management: Helps identify market turning points to better manage entries and exits.
Conclusion: Key Points on Chaikin Money Flow
The Chaikin Money Flow (CMF) indicator uses price and volume data to measure market momentum and assess buying or selling pressure. It helps traders evaluate trend strength, spot possible reversals, and understand changes in market sentiment.
The CMF formula relies on a Money Flow Multiplier (ranging from -1 to +1) and trading volume to analyze market activity. Shorter timeframes highlight quick shifts, while longer ones reveal broader trends, allowing traders to match the indicator to their specific strategies.
CMF is particularly useful for:
- Confirming trend direction and strength
- Spotting potential reversals through divergences
- Validating breakouts with volume analysis
Advanced insights from the LuxAlgo Oscillator Matrix further enhance CMF’s utility by minimizing noise, improving signal clarity, and offering valuable trend confirmations. Integrating these tools allows traders to fine-tune strategies and manage risk more effectively.
Keep in mind, CMF is most effective when used alongside other technical indicators and fundamental analysis. Its true value lies in being part of a broader trading strategy that leverages modern, data-driven insights.
FAQs
Here are answers to some common questions traders often ask about using CMF in their strategies.
What is the Chaikin Money Flow indicator?
The Chaikin Money Flow (CMF) is a technical indicator based on volume. It helps gauge whether there's more buying or selling pressure on an asset over a specific timeframe, commonly 21 days. Positive readings point to buying pressure (accumulation), while negative readings indicate selling pressure (distribution).
How is the Chaikin Money Flow calculated?
CMF combines the Money Flow Multiplier with trading volume to determine Money Flow Volume (MFV). This value is then averaged over a chosen period to get the final CMF value. Essentially, it shows how price movement within a trading range aligns with volume, offering insights into market pressure.
How do you calculate Chaikin Money Flow?
To calculate CMF:
- Find the Money Flow Multiplier.
- Multiply it by the trading volume to get Money Flow Volume (MFV).
- Add up the MFV over your chosen period, then divide it by the total volume for that period.
The timeframe can be adjusted based on trading style. Shorter periods often suit day traders, while longer ones are better for position traders.