Understanding open and close prices is crucial for traders to analyze market trends and refine their strategies effectively.
Open and close prices are vital tools for understanding market trends and making trading decisions. The opening price reflects the market's reaction to overnight news, while the closing price summarizes the day's activity and sentiment. Together, they help traders analyze gaps, confirm trends, and plan strategies.
Key Takeaways:
- Opening Price: Influenced by pre-market trading, global markets, and overnight news.
- Closing Price: A reliable benchmark for trend analysis, support/resistance levels, and portfolio performance.
- Gap Analysis: Price gaps between sessions signal potential trading opportunities.
- Trading Strategies: Use open-close data with indicators like VWAP, moving averages, and volume patterns for better timing.
Quick Overview of Platforms:
| Platform | Features | Cost |
|---|---|---|
| TradingView | Advanced charting, community scripts | $29.95/month |
| ProRealTime | Unlimited indicators, clean interface | Free or premium |
| LuxAlgo | Library of free indicators; Essential plan ($24.99/mo) adds Price Action Concepts toolkit & screener; Premium ($39.99/mo) adds Signals & Overlays toolkit & screener; Ultimate ($59.99/mo) unlocks AI Backtesting Assistant | $0 – $59.99/month |
Start analyzing open and close prices today by setting up a charting platform, identifying gaps, and combining data with technical indicators for informed trading decisions.
Understanding Daily Open Prices
Factors Affecting Open Prices
The daily opening price is shaped by several elements that set the tone for pre-market conditions. Here's a breakdown of the main factors:
| Factor | Influence on Opening Price |
|---|---|
| Pre-market Trading | Early electronic trades directly affect pricing. |
| Economic Reports | Data like GDP, employment stats, and inflation released before the market opens. |
| Global Markets | The performance of Asian and European stock exchanges. |
| Futures Data | Index futures hint at market direction. |
| Overnight News | Events and announcements outside regular trading hours. |
These factors come together in processes like the Nasdaq’s “opening cross” to set the official opening price.
Trading Decisions at Market Open
When the market opens at 9:30 a.m. Eastern Time, traders often rely on specific strategies to navigate the early activity. A common guideline, the “10 a.m. rule,” suggests that a stock’s price direction is typically established by 10 a.m. Eastern.
To make informed decisions, traders analyze futures, global market performance, trading volume, and overnight news. For instance, significant gaps between a previous close and the opening price often signal trading opportunities. Gap-fade strategies look for corrections after the initial move, while breakaway-gap strategies focus on strong volume and momentum.
In one example, Apple (AAPL) closed at $228.87 on September 19, 2024, then opened at $229.97 on the next session—highlighting a 1.10-point gap that traders could exploit.
Daily Close Prices and Market Analysis
Close Price Significance
The closing price represents the outcome of all trading activity for the day, making it a reliable benchmark for market valuation. Unlike intraday prices, which can be influenced by short-term volatility, the closing price provides a clearer picture of overall sentiment.
“The closing price is the most important price in the stock market. It reflects the collective opinion of buyers and sellers, can help identify trends, confirm trading signals, and forms the basis for support and resistance levels.” – Balakrishna Shenoy
Here’s how closing prices drive market analysis:
| Aspect | Role in Market Analysis |
|---|---|
| Price Discovery | Shows market valuation after processing daily data |
| Trend Confirmation | Higher closes suggest demand; lower closes indicate weakness |
| Technical Reference | Establishes support/resistance levels and chart patterns |
| Performance Metrics | Helps calculate daily returns and assess portfolio performance |
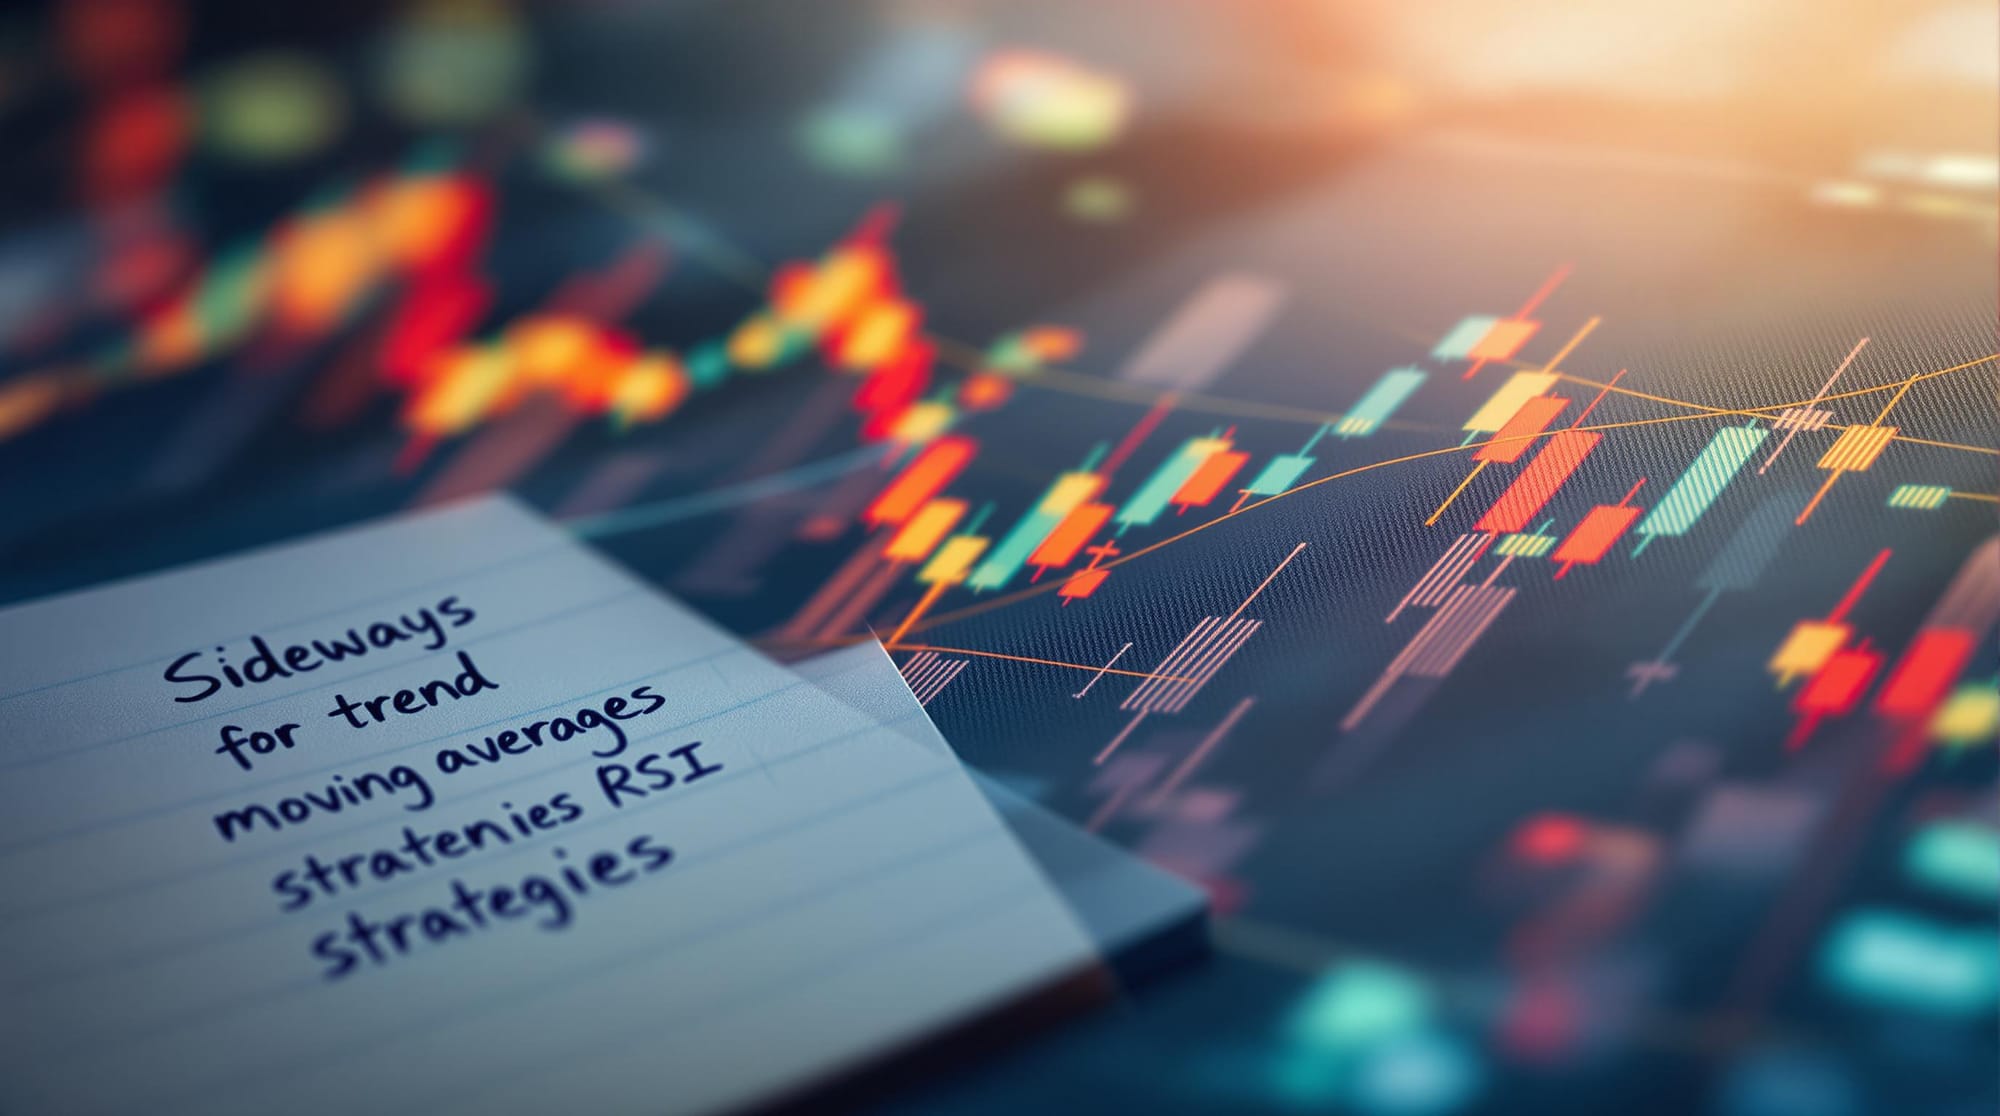
Trend Analysis with Close Prices
Analyzing closing prices helps identify trends and potential reversals. For example, a “sushi roll” strategy tested on the NASDAQ Composite from 1990–2004 returned 29.31% annualized versus 10.66% buy-and-hold.
- Price Position: Relative close within the session range reveals market control.
- Technical Indicators: Interaction with VWAP, moving averages, etc.
- Volume Patterns: Strong volume confirms price moves.
- Trendline Breaks: Breaches signal potential shifts.
Price Analysis Software and Tools
Chart Platform Options
TradingView earns 95% for its charting and technical analysis features, offering customizable charts and advanced indicators—ideal for open-close studies.
ProRealTime Web scores 90% with a distraction-free interface and unlimited indicators in its free tier, making it perfect for detailed price analysis.
| Platform | Best For | Key Features | Cost |
|---|---|---|---|
| TradingView | All-round analysis | Customizable charts; active community | $29.95/mo |
| TradeStation | Broker integration | Free charts with account; TradingView link | Free with account |
| TrendSpider | Automated analysis | AI pattern recognition; simplified tools | $33–97/mo |
| Stock Rover | Portfolio tracking | 650+ metrics; valuation charts | $7.99–27.99/mo |
LuxAlgo Trading Tools
LuxAlgo’s Price Action Concepts (PAC) toolkit automates pattern detection and highlights volumetric order blocks, helping traders confirm trends and spot setups without manual drawing. Its Custom Alert Creator lets you build complex alerts based on open-close relationships across multiple symbols.
LuxAlgo AI Testing Features
The Ultimate subscription ($59.99/mo) unlocks the AI Backtesting Assistant, three TradingView-dedicated backtesters, advanced signal optimization, and weekly automated scans—enabling precise evaluation of open-close strategies.
Conclusion: Applying Open-Close Analysis
Daily open and close prices offer clear insights into market sentiment and trend. Use pre-market data to gauge initial direction, then rely on the close to confirm signals. Combine gap analysis with technical indicators and backtest your strategies using AI tools for best results.