Learn how to identify and trade divergence patterns in technical analysis, enhancing your trading strategy and market predictions.
Divergence is a trading concept where price movements and technical indicators don't align, signaling potential market reversals or trend continuations. Here's what you need to know:
-
Types of Divergence:
- Regular: Indicates possible trend reversals.
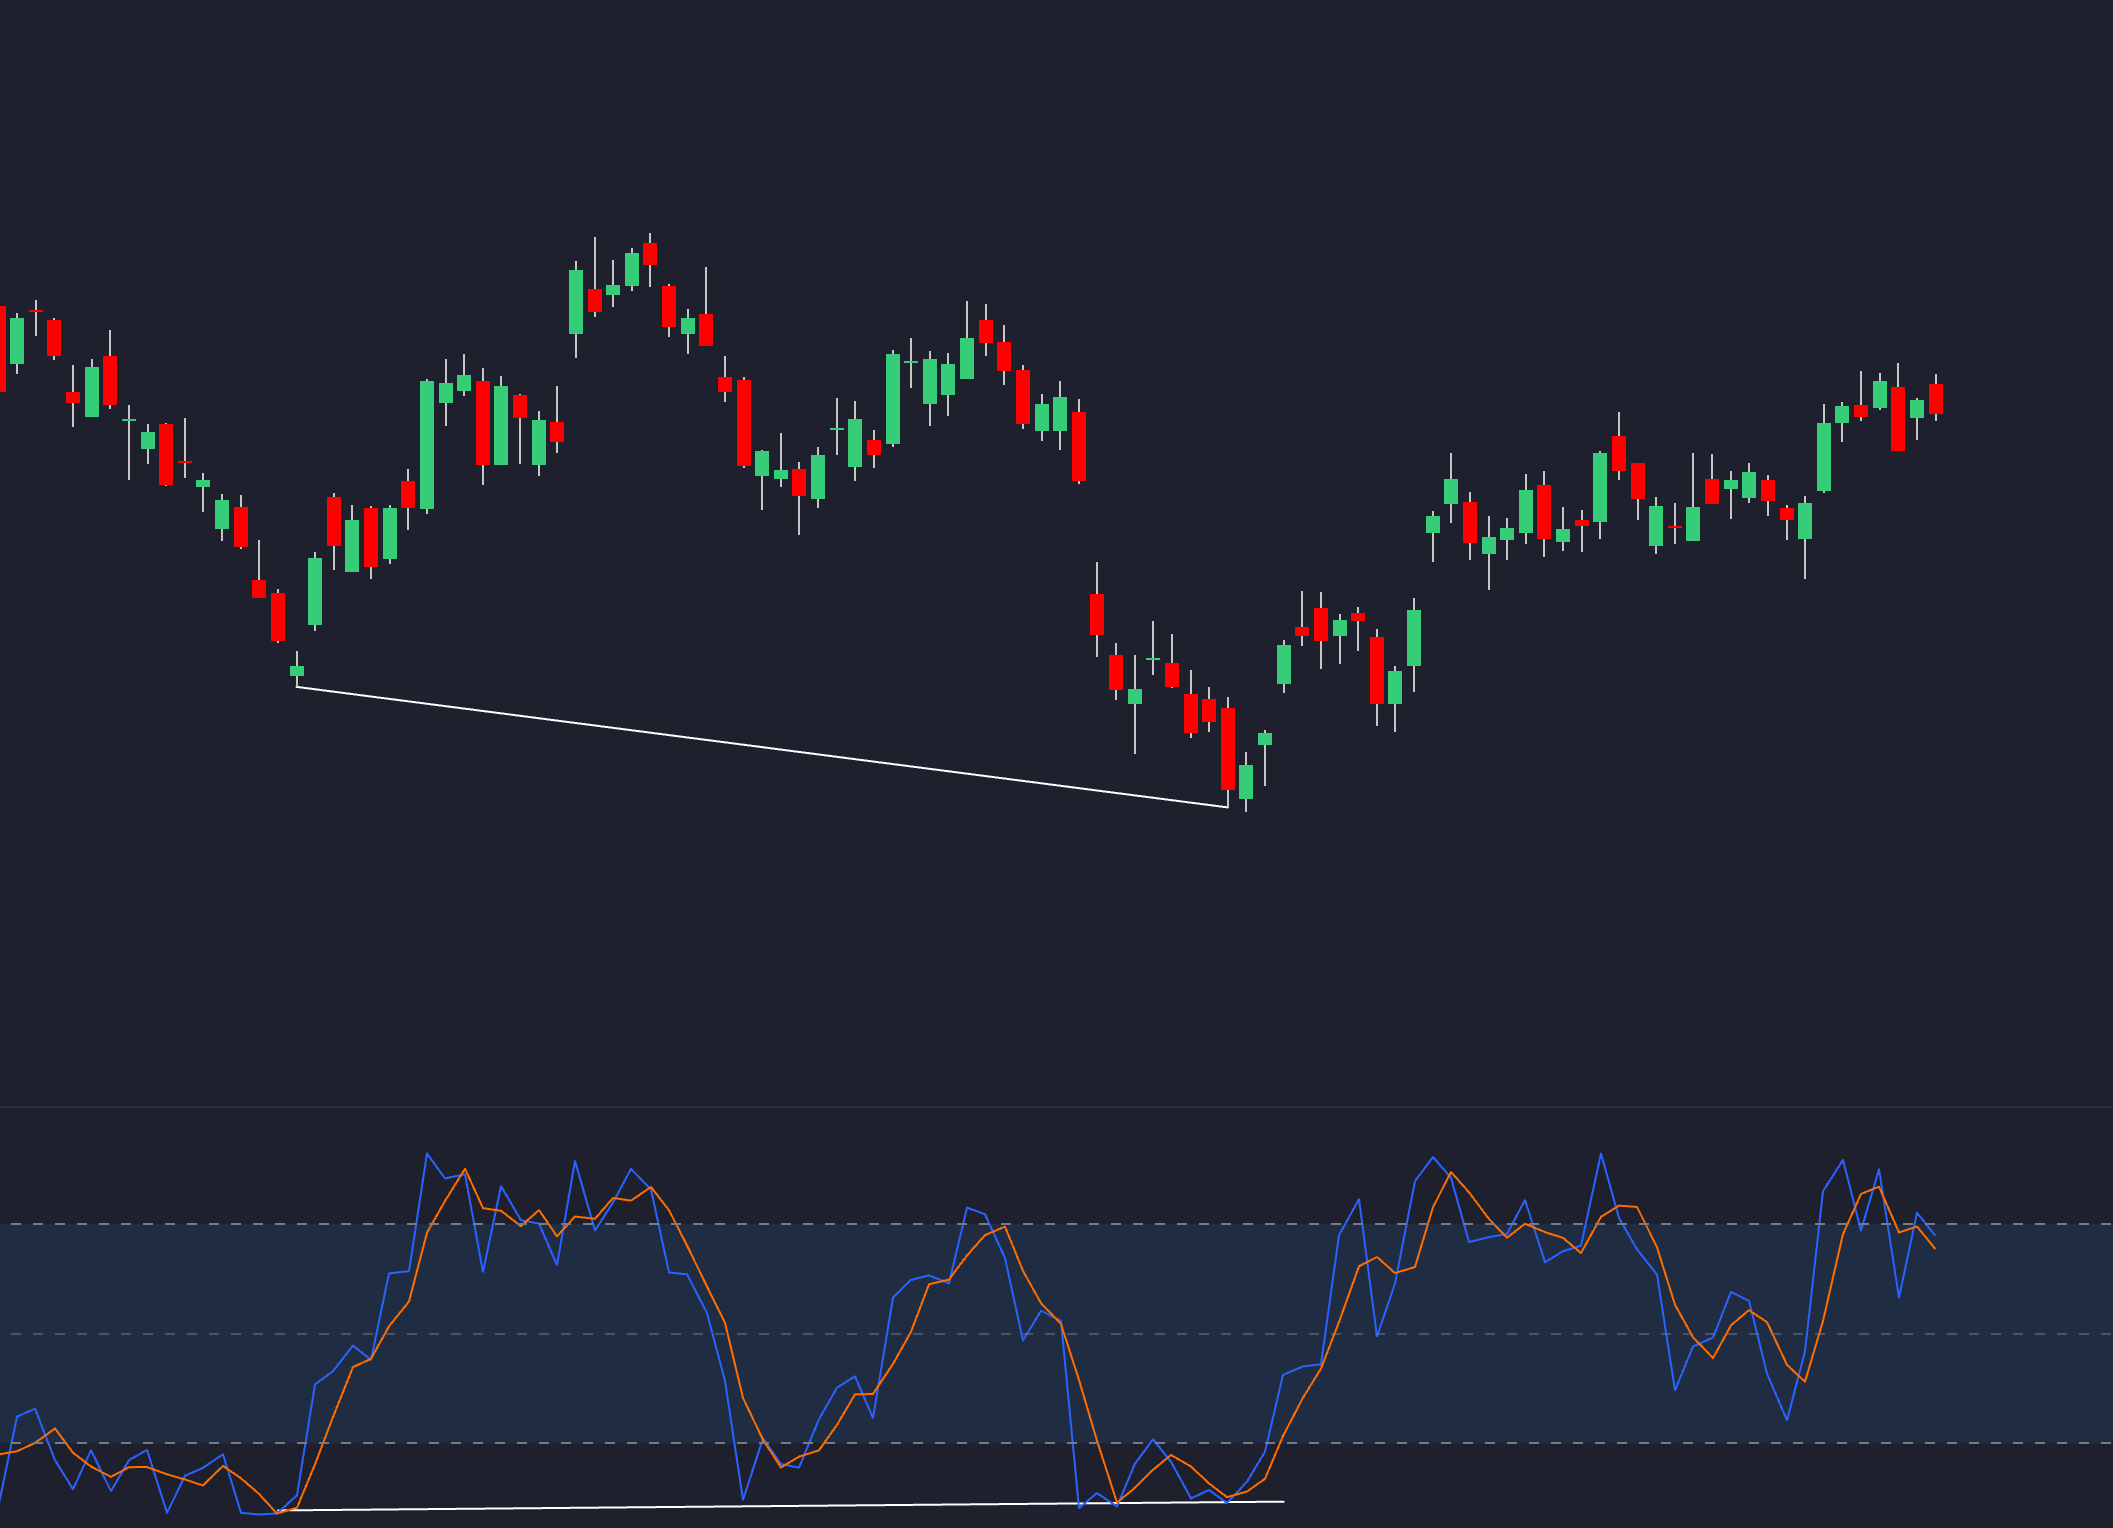
- Bullish: Price makes lower lows, indicator shows higher lows.
- Bearish: Price makes higher highs, indicator shows lower highs.
- Hidden: Confirms trend continuation.
- Bullish: Price makes higher lows, indicator shows lower lows.
- Bearish: Price makes lower highs, indicator shows higher highs.
- Extended: Stronger reversal signals over multiple price swings.
- Regular: Indicates possible trend reversals.
-
Key Indicators:
- RSI: Identifies overbought/oversold conditions.
- MACD: Tracks trends using moving averages.
- Stochastic Oscillator: Best for range-bound markets.
-
Support Tools:
- Volume analysis confirms signal reliability.
- Fibonacci retracement levels pinpoint trade zones.
- Trendlines enhance accuracy.
-
Risk Management:
- Use stop-loss orders (e.g., 2-3 ATR levels).
- Risk only 1-2% of capital per trade.
Divergence trading works across timeframes and market conditions when combined with confirmations like price action, volume, and additional indicators.
How To Trade Regular & Hidden Divergences | Divergence Trading Explained
Main Types of Divergence
Divergence patterns are essential for traders, helping them spot potential trend reversals or continuations by analyzing price movements and technical indicators.
Regular Divergence: Spotting Reversal Opportunities
Regular divergence is a key signal for potential trend reversals. It occurs when the price movement conflicts with the momentum indicated by technical tools.
| Type | Price Action | Indicator Movement | Signal |
|---|---|---|---|
| Bullish Regular | Lower lows | Higher lows | Possible upward reversal |
| Bearish Regular | Higher highs | Lower highs | Possible downward reversal |
For example, in September 2022, the EUR/USD pair showed bearish regular divergence on daily charts. While the price hit higher highs, the RSI displayed lower highs. This pattern preceded a 3.2% drop over two weeks.
Hidden Divergence: Supporting Trend Continuations
Hidden divergence is useful for confirming the strength of an ongoing trend. Unlike regular divergence, it highlights opportunities within the current trend.
"Hidden divergence is accurate in confirming trend continuations approximately 75-80% of the time in strong trending markets." [3]
| Type | Price Action | Indicator Movement | Signal |
|---|---|---|---|
| Bullish Hidden | Higher lows (uptrend) | Lower lows | Trend continuation upward |
| Bearish Hidden | Lower highs (downtrend) | Higher highs | Trend continuation downward |
Extended Divergence: A Stronger Reversal Signal
Extended divergence takes regular divergence a step further by forming over multiple price swings. Its prolonged development often indicates stronger potential reversals.
Key traits of extended divergence include:
- Formation across several price swings rather than a single move
- Stronger reversal signals due to its extended nature
- Requires additional confirmation before acting
- Commonly observed on higher timeframes, hinting at larger market shifts
This pattern is particularly valuable for traders focusing on long-term market changes, as it signals more pronounced shifts in trend direction.
Divergence Detection Methods
Spotting divergence patterns involves analyzing technical indicators to uncover potential market reversals or trend continuations. Each tool provides a different way of interpreting price and momentum discrepancies.
RSI Divergence Patterns

The Relative Strength Index (RSI) is a popular tool for identifying divergence. Set the RSI to 14 periods and look for mismatches between price action and momentum trends, especially around the overbought (70+) and oversold (30-) zones.
- Bullish divergence happens when the price makes lower lows, but RSI shows higher lows. This often hints at a possible upward reversal.
- Bearish divergence occurs when the price hits higher highs, but RSI registers lower highs, signaling a potential downward shift.
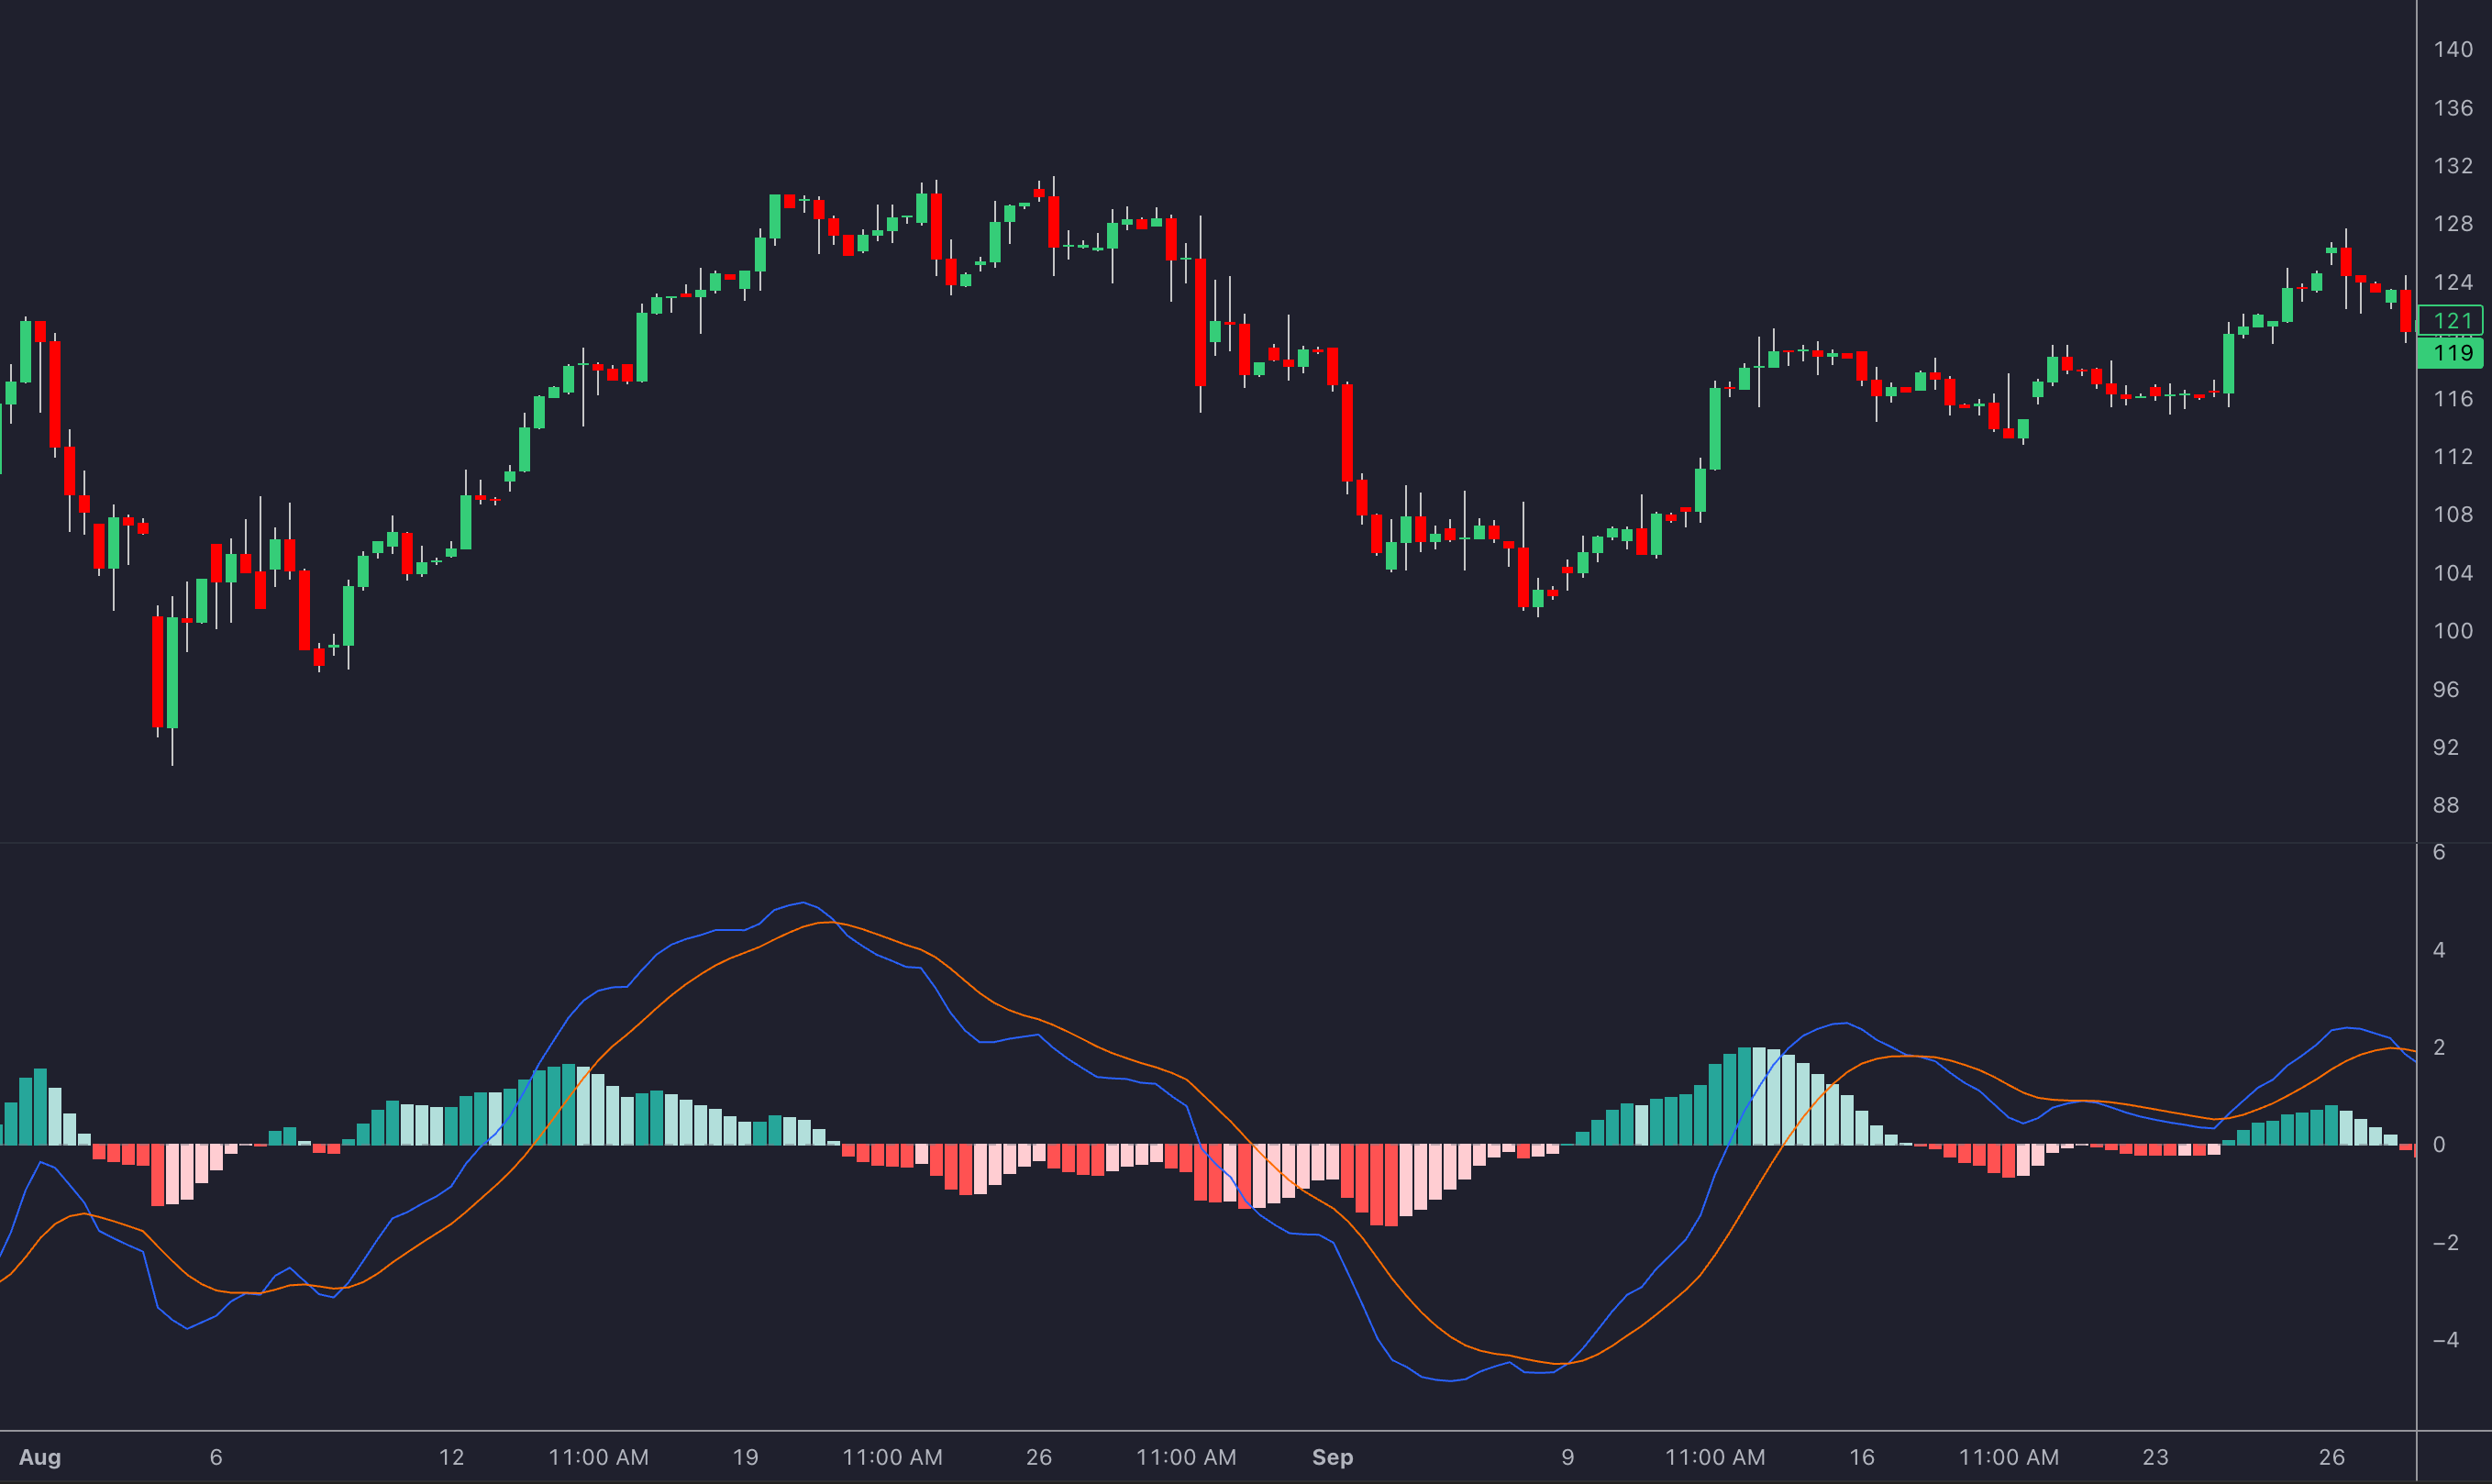
MACD Divergence Signals
The MACD histogram is another effective way to detect divergence. Here's a breakdown of key patterns:
| Divergence Type | Price Action | MACD Signal | Implication |
|---|---|---|---|
| Bullish Regular | Lower lows | Higher lows in histogram | Possible upward reversal |
| Bearish Regular | Higher highs | Lower highs in histogram | Possible downward reversal |
| Bullish Hidden | Higher lows | Lower lows in histogram | Continuation of uptrend |
| Bearish Hidden | Lower highs | Higher highs in histogram | Continuation of downtrend |
Stochastic Divergence in Sideways Markets
The Stochastic Oscillator works particularly well for detecting divergence in range-bound markets. It focuses on conflicts between the %K and %D lines, especially when values are within the 20-80 range.
Key tips for Stochastic divergence:
- Look for divergence signals within the 20-80 range.
- Confirm these signals with price action at support or resistance levels.
- Pay attention to divergence on both the %K and %D lines for stronger signals.
Combining these methods with tools like volume analysis can provide even greater clarity, which we’ll explore next.
Supporting Tools for Divergence Trading
Volume analysis, Fibonacci retracement levels, and trendline analysis can sharpen divergence signals and improve trading outcomes. These tools work together to make divergence patterns more actionable.
Volume Analysis with Divergence
Volume acts as a key confirmation for divergence signals. When price and momentum indicators diverge, volume patterns help verify the signal's reliability. According to John Bollinger's research, divergence signals supported by matching volume patterns showed a 68% boost in accuracy[1][4].
| Volume Pattern | Signal Confirmation |
|---|---|
| Rising with price lows | Bullish reversal |
| Falling with price highs | Bearish reversal |
| Stable during pullbacks | Trend continuation |
While volume helps confirm momentum shifts, Fibonacci retracement levels can pinpoint entry and exit points for trades.
Fibonacci Levels and Divergence
Fibonacci retracement levels are excellent for identifying precise trade zones when paired with divergence signals. Research by Thomas Bulkowski highlighted that using the 61.8% retracement level alongside divergence signals led to successful trades 64% of the time[2][5].
Key Fibonacci levels to watch:
- 38.2% - Initial retracement level
- 50.0% - Mid-point retracement
- 61.8% - Golden ratio retracement
Adding trendline analysis to the mix offers even more clarity for divergence trades.
Trendline Analysis for Divergence
Divergence signals paired with trendline confirmation have a 72% success rate, compared to 53% without it[3][6].
To use trendlines effectively:
- Draw lines connecting recent highs or lows in the price chart.
- Look for trendline breaks that align with volume and price action.
These tools, when used together, can provide a stronger foundation for making informed trading decisions.
Managing Risks in Divergence Trading
Studies reveal that traders using multiple timeframe analysis alongside divergence signals see 68% better success rates compared to those who stick to single-timeframe strategies[1]. These methods build on the confirmation tools discussed earlier, addressing specific challenges unique to divergence trading.
Common Divergence Trading Mistakes
Traders often make predictable errors when working with divergence patterns. A common mistake is relying too heavily on divergence signals while ignoring other technical factors. For instance, entering a long trade based solely on bullish RSI divergence, while overlooking key resistance levels or conflicting trend indicators, can drastically lower the chances of success[1][7].
| Mistake | Consequences | How to Avoid It |
|---|---|---|
| Focusing on one indicator | More false signals | Use multiple indicators |
| Neglecting timeframes | Poor timing of trades | Consider multiple timeframe analysis |
| Entering too early | Increased losses | Wait for price action confirmation |
| Oversized trades | Higher risk exposure | Stick to proper position sizing |
Risk Control Methods
Experts recommend risking only 1-2% of your trading capital on each divergence trade[6]. This approach helps protect your account during inevitable losses.
Stop-loss placement is another key factor in managing risk. Using the ATR (Average True Range) indicator to set dynamic stops is particularly effective. For example, placing stop-loss orders 2-3 ATR levels away from your entry ensures you account for market volatility while safeguarding your capital[7]. This method works well with trendline and Fibonacci strategies discussed earlier.
Proven Divergence Trading Rules
To succeed with divergence trading, follow established rules. The most important one? Wait for price confirmation before entering a trade. Look for confirmation through price action and volume patterns.
Start by focusing on divergence signals on daily charts before moving to lower timeframes[2].
Lastly, use the confirmation tools mentioned earlier in this guide. Layering these methods enhances signal accuracy and aligns your trades with broader market trends.
Summary: Key Points About Divergence
Divergence analysis is a useful approach for spotting potential market reversals and trend continuations. As covered earlier, using tools like RSI, MACD, and Stochastic indicators alongside other technical analysis methods can lead to better trading decisions.
These signals become more reliable when paired with tools such as Fibonacci retracements [2]. Incorporating trendlines or Fibonacci levels further strengthens the accuracy of these signals, as discussed in previous strategies.
Here are some important aspects to keep in mind for successful divergence trading:
- Recognize both regular and hidden divergence patterns.
- Use multiple technical indicators to confirm signals.
- Watch price movements closely for additional confirmation.
- Stick to clear risk management practices.
Combining divergence signals with the broader market trend increases the chances of better trade results [1][2]. Success in divergence trading relies on confirming signals through price action and maintaining disciplined risk management [3][5].
FAQs
What is an example of a hidden divergence?
Hidden divergence points to a continuation of the current trend by showing mismatched behavior between price and indicators:
- In an uptrend, the price creates higher lows, while the RSI shows lower lows. This suggests the uptrend is likely to keep going.
- In a downtrend, the price forms lower highs, but MACD peaks are rising. This signals the downtrend is expected to continue.
These patterns align with the trend confirmation strategies we’ve covered earlier.
Key points to keep in mind:
- Always confirm the current trend first.
- Focus on daily or weekly charts for better accuracy.
- Use tools like RSI, MACD, or Stochastic for analysis.