Learn how to identify divergence in trading to signal potential trend reversals or continuations and effectively set price targets.
Divergence in trading occurs when price movement and technical indicators like RSI or MACD don't align, signaling potential trend reversals or continuations. Paired with measured moves, it helps traders set precise price targets and manage risks effectively. Here's what you need to know:
- Regular Divergence: Indicates trend reversals (e.g., bearish when price makes higher highs, but indicators show lower highs).
- Hidden Divergence: Suggests trend continuation during pullbacks.
- Best Indicators: RSI, MACD, and Stochastic Oscillator work well for spotting divergence.
- Measured Moves: Use Fibonacci levels (127.2%, 161.8%) and swing analysis to project price targets.
- Risk Management: Combine divergence signals with ATR for stop-loss levels and volume analysis for confirmation.
2 Main Types of Divergence
Regular Divergence for Reversals
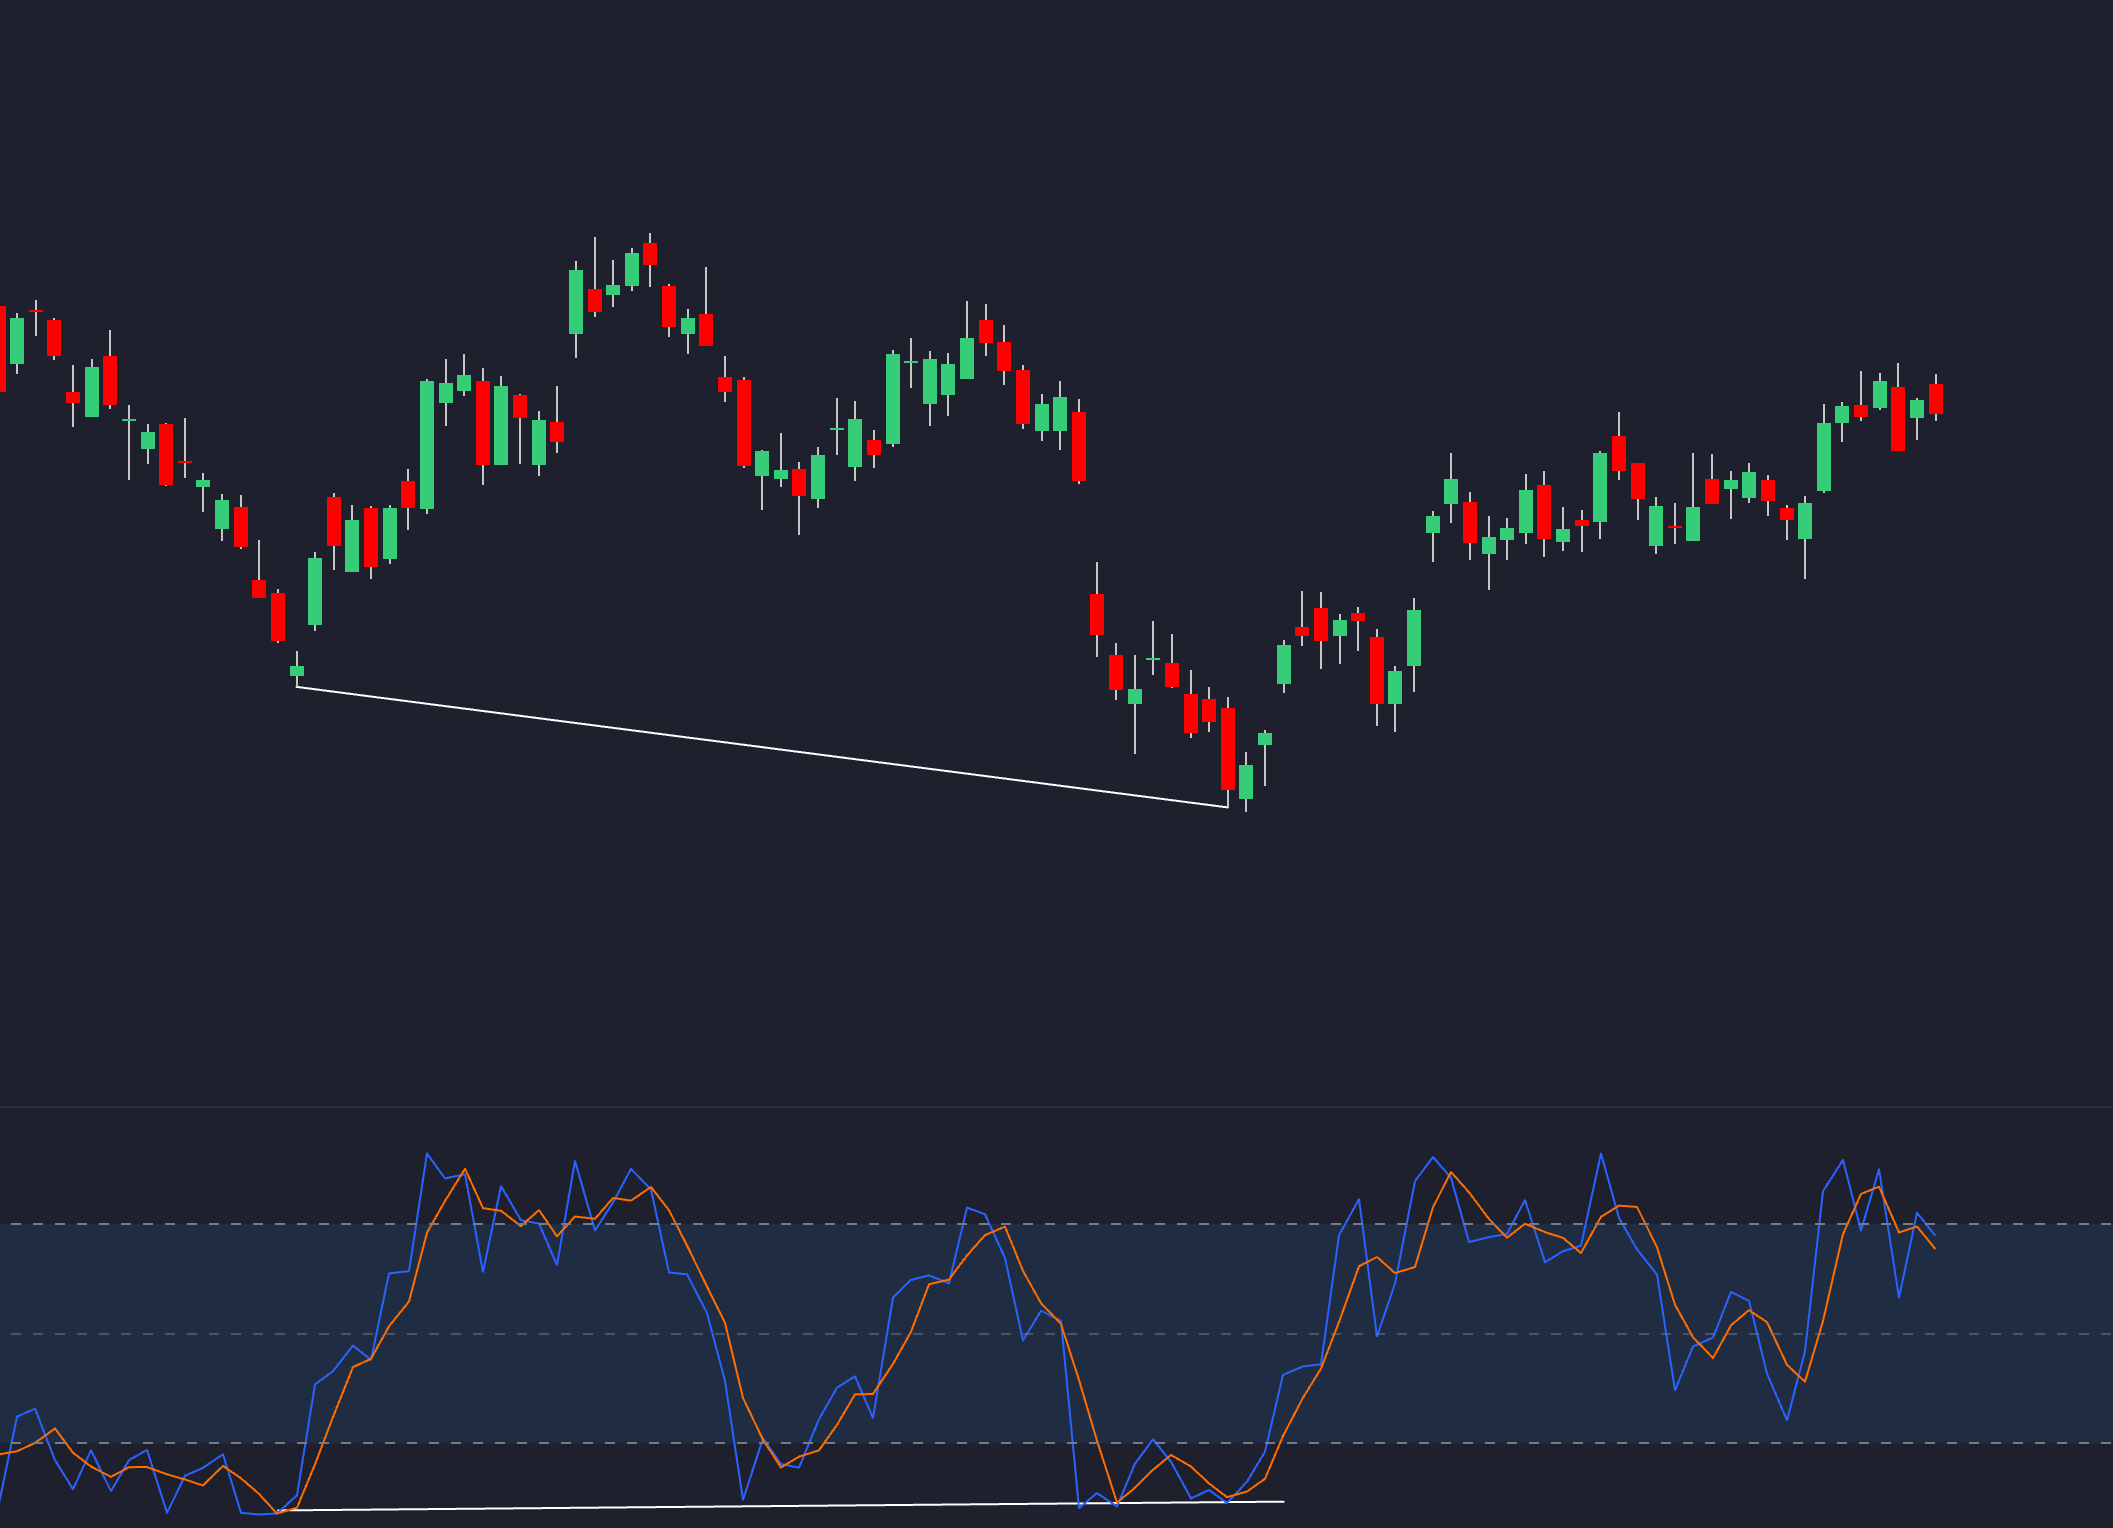
Regular divergence suggests a potential trend reversal when price action and momentum indicators don’t align. If the price hits new highs or lows but the indicator doesn’t follow suit, it could mean the current trend is losing strength and might reverse.
There are two types:
- Bearish: The price makes higher highs, but the indicator shows lower highs. This often hints at a coming downward reversal.
- Bullish: The price makes lower lows, while the indicator shows higher lows. This signals a possible upward reversal.
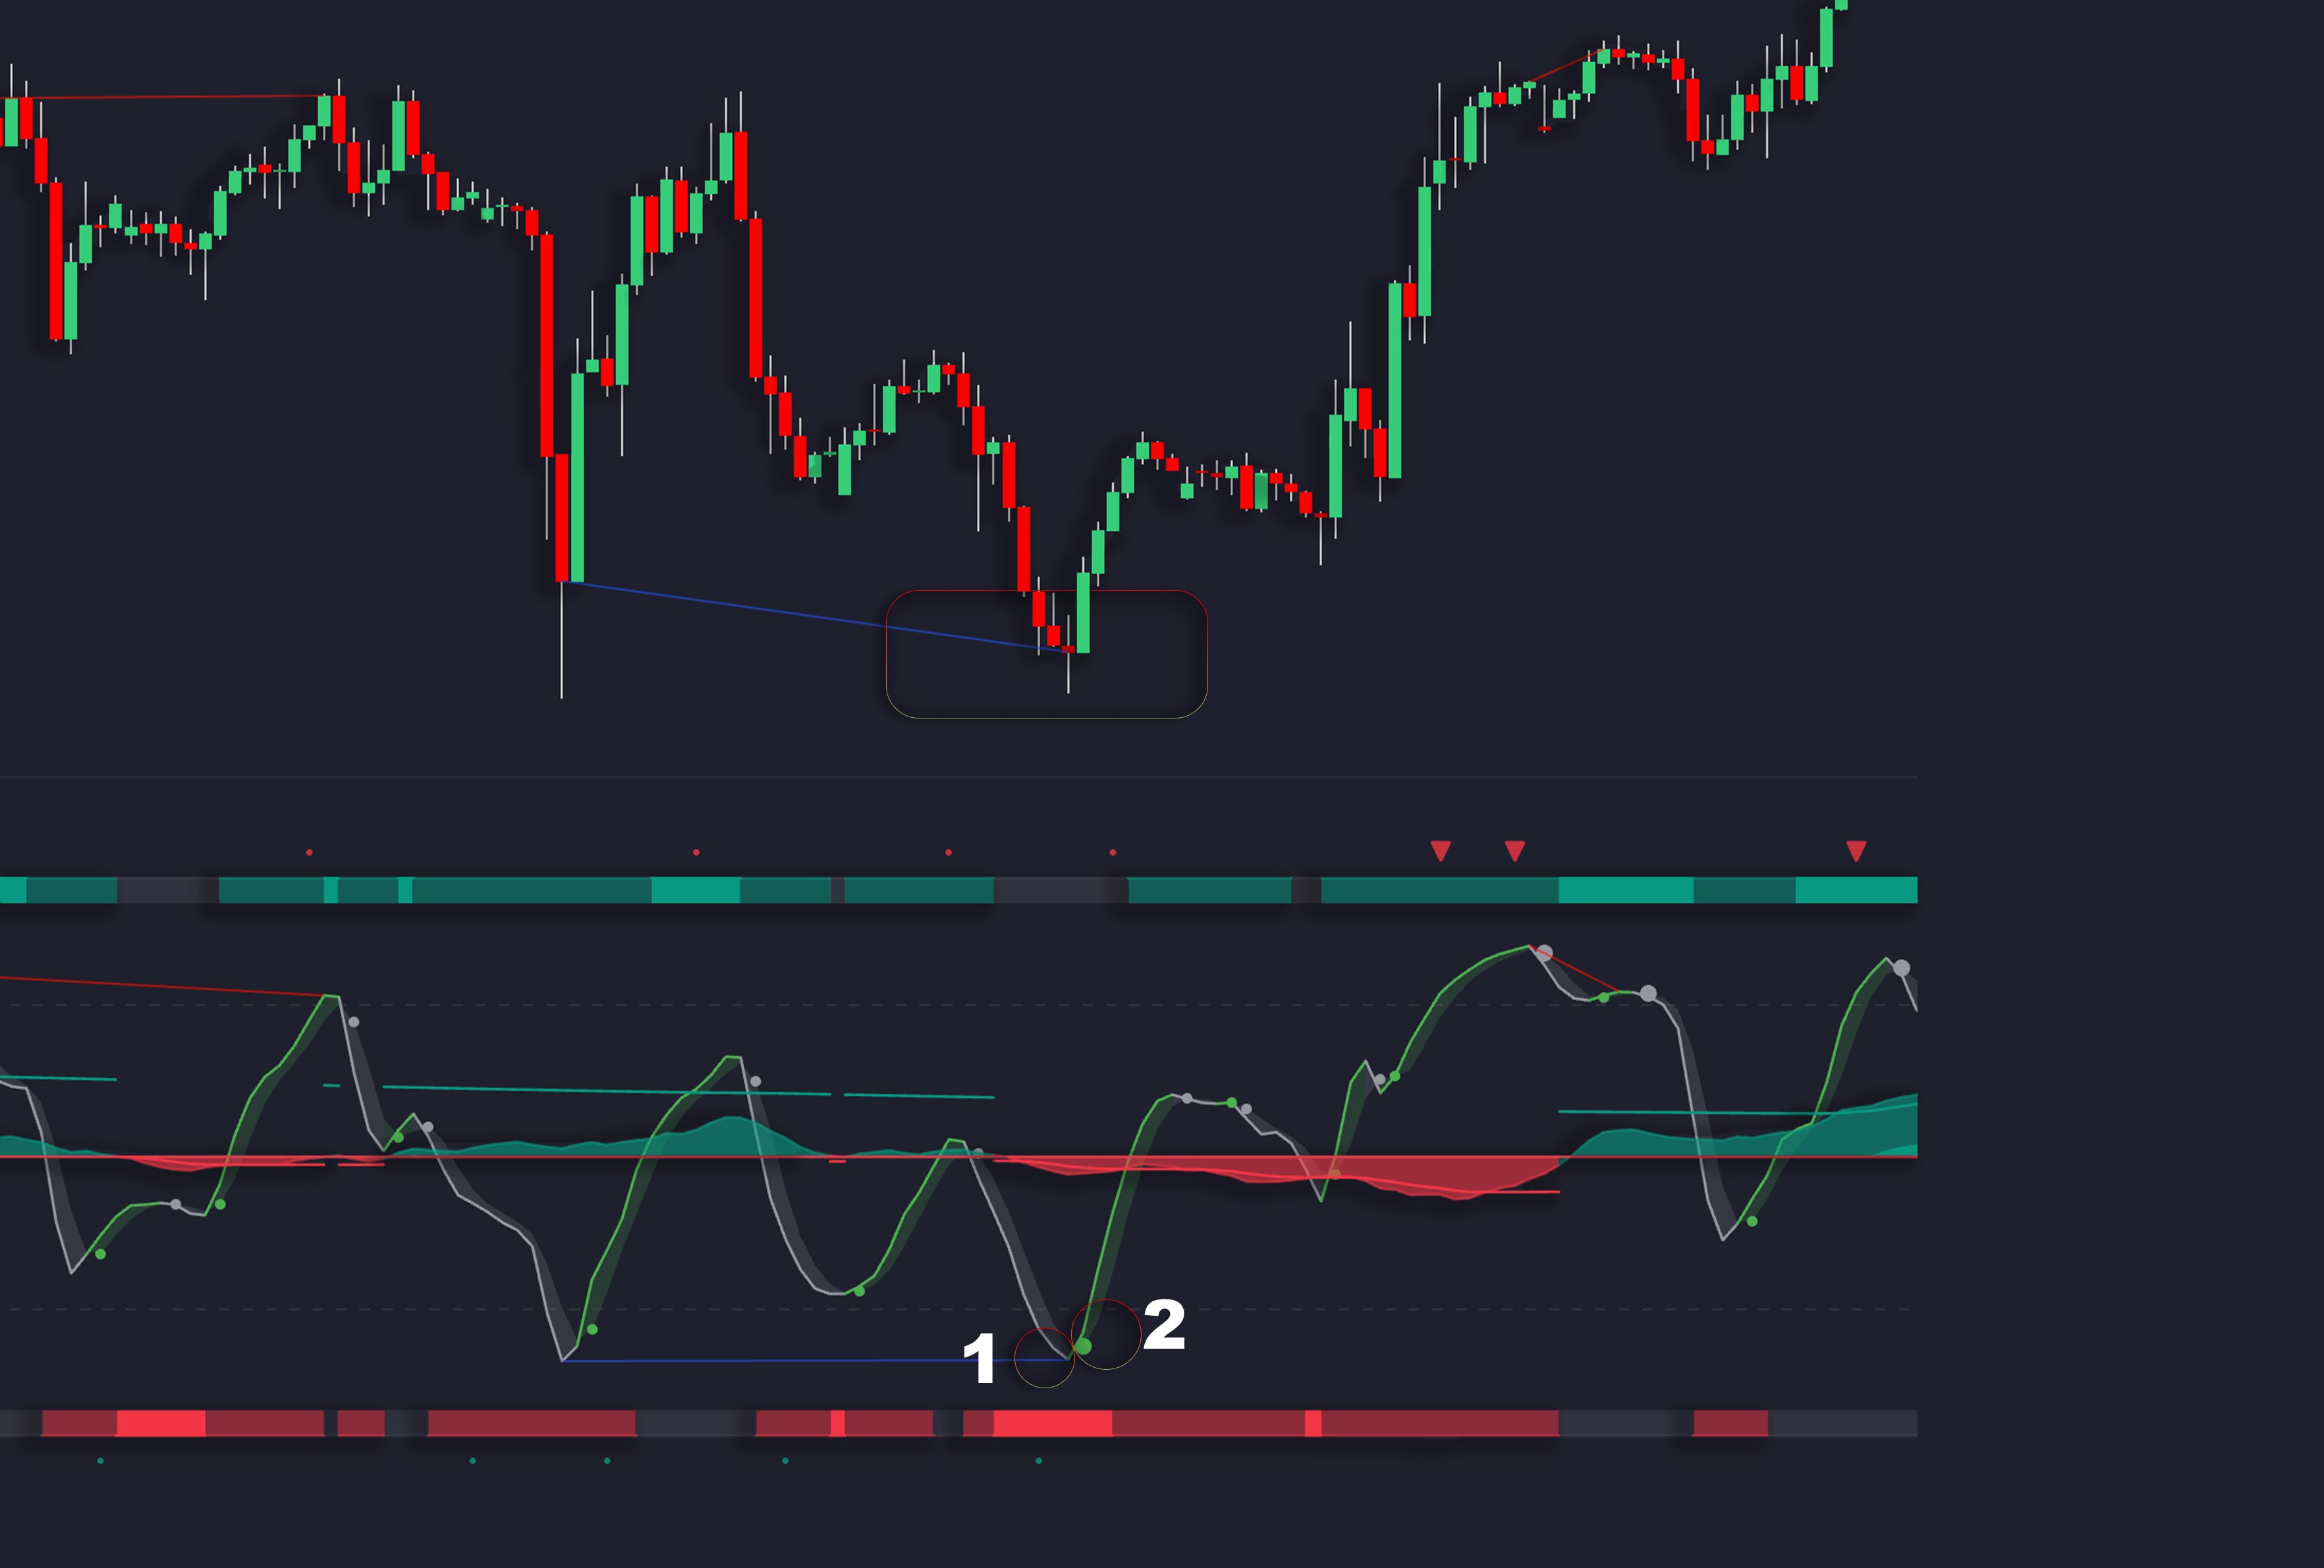
Hidden Divergence for Trend Continuation
Hidden divergence helps spot chances to rejoin an ongoing trend during pullbacks. In an uptrend, bullish hidden divergence occurs when the price forms higher lows, but the indicator forms lower lows. In a downtrend, bearish hidden divergence happens when the price creates lower highs, while the indicator shows higher highs. These signals often align with Fibonacci retracement levels, which are key in setting price targets.
Regular vs Hidden Divergence Comparison
| Characteristic | Regular Divergence | Hidden Divergence |
|---|---|---|
| Primary Signal | Trend Reversal | Trend Continuation |
| Reliability | Easier to spot | Higher reliability |
| Market Context | At market tops/bottoms | During trend corrections |
| Risk Level | Higher (against trend) | Lower (with trend) |
Both types of divergence are essential for analyzing price movements and setting measured move targets. For better accuracy, focus on daily or weekly charts. Pair divergence signals with other confirmation methods like volume or price patterns for stronger analysis.
How To Trade Regular & Hidden Divergences | Divergence Trading Explained
Best Indicators for Divergence
To effectively spot divergence patterns, three momentum indicators stand out: RSI, MACD, and the Stochastic Oscillator. Each has its own strengths for this trading strategy.
RSI, MACD, and Stochastic Setup
The Relative Strength Index (RSI) is a go-to for divergence trading, especially when using the standard 14-period setting. Its overbought (70) and oversold (30) levels make it easier to identify divergence patterns. Pay close attention to signals near these extremes, as they often point to stronger potential reversals [2].
The Moving Average Convergence Divergence (MACD) is ideal for spotting trend changes. Stick to the standard settings of 12, 26, and 9 periods for consistent performance.
| Indicator | Optimal Settings | Best Market Conditions | Success Rate |
|---|---|---|---|
| RSI | 14 periods | Overbought/Oversold levels | 62% on EUR/USD 4H [3] |
| Stochastic | 14, 3, 3 | Ranging markets |
Selecting the right time frame can make these indicators even more effective under different market conditions.
Choosing Time Frames and Market Conditions
Tailor your approach based on the type of market you're trading in:
Trending Markets:
- Use daily charts to identify the overall trend.
- Switch to 4-hour charts for pinpointing entry opportunities.
- Look for hidden divergence to align with the current trend.
Ranging Markets:
- Focus on shorter time frames like 1-hour or 4-hour charts.
- Pay extra attention to signals from the Stochastic Oscillator.
- Combine divergence signals with key support and resistance levels.
For better accuracy, pair these indicators with volume analysis. A volume spike during a breakout often confirms divergence signals, making your projections for price moves more reliable. This layered approach boosts trading precision and helps refine target calculations.
Price Targets with Measured Moves
Measured Moves Basics
Once divergence signals are identified, measured moves help translate these patterns into price targets using a three-step process. Here's how it works:
- Initial swing (A-B): The first price movement.
- Correction (B-C): A pullback or retracement.
- Projected move from C: The target price, based on the distance of the initial swing.
For example, in an uptrend, if bearish divergence appears at point B, the projected target is calculated by matching the distance of the initial swing [5].
Fibonacci and Swing Analysis
Fibonacci extensions can refine these projections, building on retracement levels. Here's how different levels are used:
| Fibonacci Level | Purpose |
|---|---|
| 127.2% | Conservative target |
| 161.8% | Moderate target |
| 261.8% | Aggressive target |
You can confirm these levels by analyzing recent swing highs and lows, especially when divergence is present [4][1].
Entry and Exit Points
To execute trades effectively:
- Confirm divergence signals: Align them with key price levels identified from patterns.
- Take partial profits: Exit part of the position at measured move targets.
- Use trailing stops: Protect gains on the remaining position.
Volatility adjustments are essential. Use the Average True Range (ATR) to adapt targets. For high volatility, extend targets by 2-3 times the ATR value [3].
Set three clear targets:
- Primary: Based on the measured move.
- Secondary: The 127.2% Fibonacci extension.
- Maximum: The 161.8% Fibonacci extension.
In highly volatile conditions, consider extending targets by 10-20% beyond the base projections [3].
Trading Methods Using Both Tools
Volume and Time Frame Confirmation
Once you've spotted divergence signals and set price targets, it's essential to confirm these setups using volume and multiple timeframes. Volume is a key factor in validating divergence patterns. For instance, in bullish divergence scenarios, you should see an increase in volume as the price hits a lower low while the indicator forms a higher low [2]. Combine these volume signals with the price targets you identified using Fibonacci extensions for better accuracy.
Start by analyzing higher timeframes to determine the overall trend. Then, move to lower timeframes for pinpointing entry points. This layered approach gives you a clearer picture and improves the reliability of your trades.
Stop-Loss and Risk Rules
Placing stop-loss orders for divergence-based trades requires attention to both market volatility and the structure of the pattern. The Average True Range (ATR) indicator is a helpful tool here, as it allows you to adjust stop distances based on current market conditions [3].
Here are some basic stop-loss guidelines:
- For bullish setups: Place the stop below the divergence low plus the ATR value.
- For bearish setups: Place the stop above the divergence high plus the ATR value.
- Limit your risk to 1-2% of your account equity and consider reducing position sizes during volatile market conditions.
As the price nears the measured move targets (like the 61.8% Fibonacci levels mentioned earlier), you can gradually adjust your stop-loss levels. This risk management strategy helps protect your capital while allowing room for price movement.
Software Tools for Divergence Trading
To effectively use divergence strategies, you need reliable technical capabilities. LuxAlgo’s features make this process much more efficient.
LuxAlgo Oscillator Matrix Functionality
The Oscillator Matrix helps identify divergence across different timeframes using color-coded alerts and historical pattern examples. These features are designed to sharpen your ability to recognize patterns, building on the move identification skills discussed earlier. By providing verified examples, this functionality aids in improving pattern recognition over time.
LuxAlgo AI Backtesting Platform
LuxAlgo’s AI Backtesting Platform allows traders to test strategies in various market conditions while automatically fine-tuning entry and exit parameters. These realistic simulations factor in elements like slippage and trading fees. The AI also refines Fibonacci-based targets and risk settings to ensure they align with real-world conditions.
Key features include:
- Stress-testing trading strategies under different scenarios.
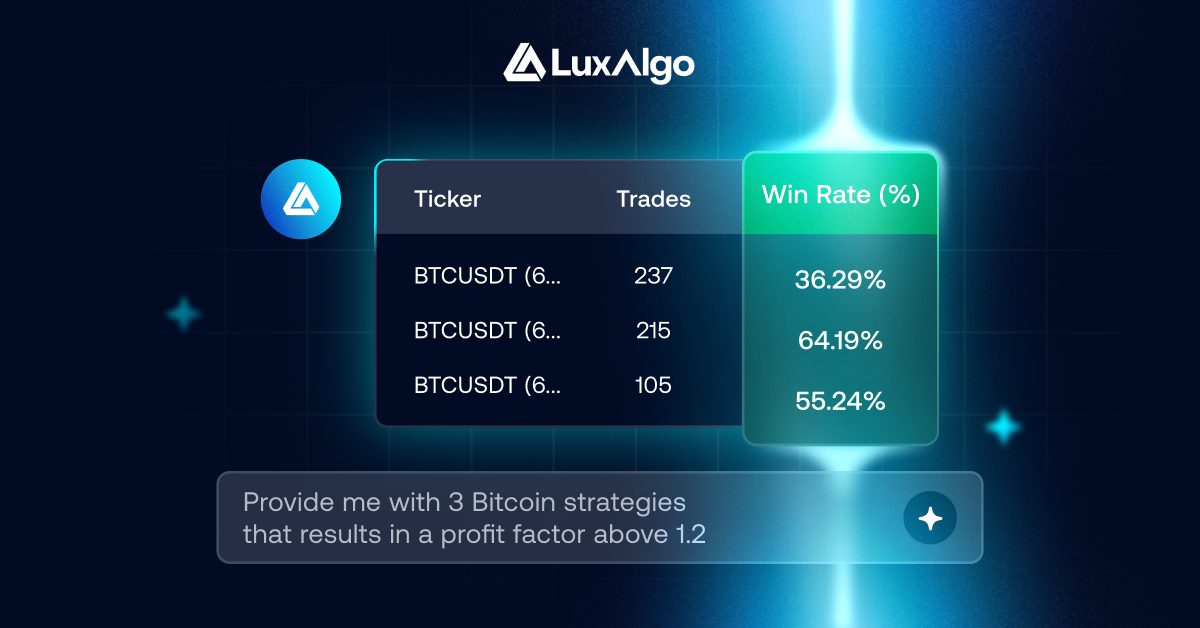
Market Scanning with LuxAlgo
LuxAlgo’s scanning capabilities make it easier to spot divergence opportunities across markets. You can customize filters to suit your trading preferences, ensuring precision in your analysis.
| Feature | Benefit |
|---|---|
| Multi-Timeframe Alignment | Validates trade setups |
| Volume Correlation | Reduces false signals |
| Sector-Specific Focus | Targets specific market areas |
These capabilities integrate with platforms like TradingView, MetaTrader 4, and MetaTrader 5. Scanning functionalities are available through subscription plans: Premium ($39.99/month) and Ultimate ($59.99/month). This automated scanning complements the manual techniques explained earlier, offering a balanced approach to divergence trading.
Common Errors and Fixes
Divergence traders often face three major challenges: relying too much on a single signal, failing to adjust for market volatility, and neglecting thorough backtesting. These mistakes can disrupt the measured move strategies previously discussed, making confirmation methods essential for hitting accurate price targets.
Multiple Signal Confirmation
Strengthen your divergence analysis by using additional confirmation techniques. Here are a few effective methods:
| Method | Benefit |
|---|---|
| Price Patterns | Helps verify reversal signals |
| Volume Spikes | Confirms the strength of breakouts |
| Multi-Chart Checks | Reduces the chances of false signals |
Always pair divergence signals with at least one other technical indicator. Start by analyzing higher timeframes before moving to lower ones for a comprehensive view.
Adjusting for Market Volatility
Volatility plays a huge role in the success of divergence trading. To improve your results under different market conditions:
- Use ATR (Average True Range) indicators to track volatility levels.
- Adjust your analysis methods to align with current market behavior.
- Backtest these adjustments using capabilities like LuxAlgo’s AI Backtesting Platform to understand how volatility impacts Fibonacci-based price targets.
Recognizing market conditions and tailoring your approach is crucial. Before applying these changes in live trading, test them on historical charts. Pay close attention to how price interacts with Fibonacci extensions during high-volatility periods, as outlined in the Price Targets section.
Conclusion
Pairing divergence with measured move analysis offers a structured way to forecast price changes and manage risk effectively. This method ties directly into the article's main strategy: using divergence patterns to pinpoint entry points and measured moves to set clear exit targets.
To apply this approach successfully, traders need to focus on three key areas:
Confirming Signals with Multiple Indicators
Relying on price action, volume, and multiple indicators to confirm divergence makes signals more dependable than using any single method [3]. Setting stop-loss levels based on key chart points, rather than arbitrary distances, also helps safeguard against false signals.
Leveraging Technical Capabilities
Modern trading platforms make it easier to spot and analyze divergence patterns. With advanced scanning and analysis features, traders can test their strategies on historical data, improving the precision of both entries and exits.
Adapting to Market Conditions
Market volatility plays a big role in divergence trading. Tools like the Average True Range (ATR) indicator help adjust target calculations, while combining this with Fibonacci extensions ensures profit targets remain aligned with market dynamics.
FAQs
What is the rule of divergence in trading?
Divergence happens when the movement of price and an indicator don't match. For example, if the price forms higher highs but the indicator shows lower highs, it's bearish divergence. On the other hand, if the price forms lower lows while the indicator shows higher lows, it's bullish divergence. This concept becomes more effective when paired with measured move target calculations mentioned earlier.
How to see divergence in trading?
To spot divergence in trading:
- Compare price swings with extremes in indicators like RSI, MACD, or Stochastic.
- Use a multi-timeframe approach, as explained in the Trading Methods section.
- Look for volume spikes to confirm signals.
Do professional traders use divergence?
Absolutely. Experienced traders combine divergence with volume analysis, multi-timeframe confirmation, and capabilities like LuxAlgo’s Oscillator Matrix and market scanning to refine their signals. This approach aligns with the multi-timeframe confirmation strategies discussed in the Trading Methods section.


