Explore the significance of Doji candlesticks in trading, their types, and how to use them effectively for market analysis.
Doji candlesticks are key indicators of market indecision in technical trading. They form when a security’s opening and closing prices are nearly identical, creating a small or non-existent body with visible wicks. Here's a quick breakdown:
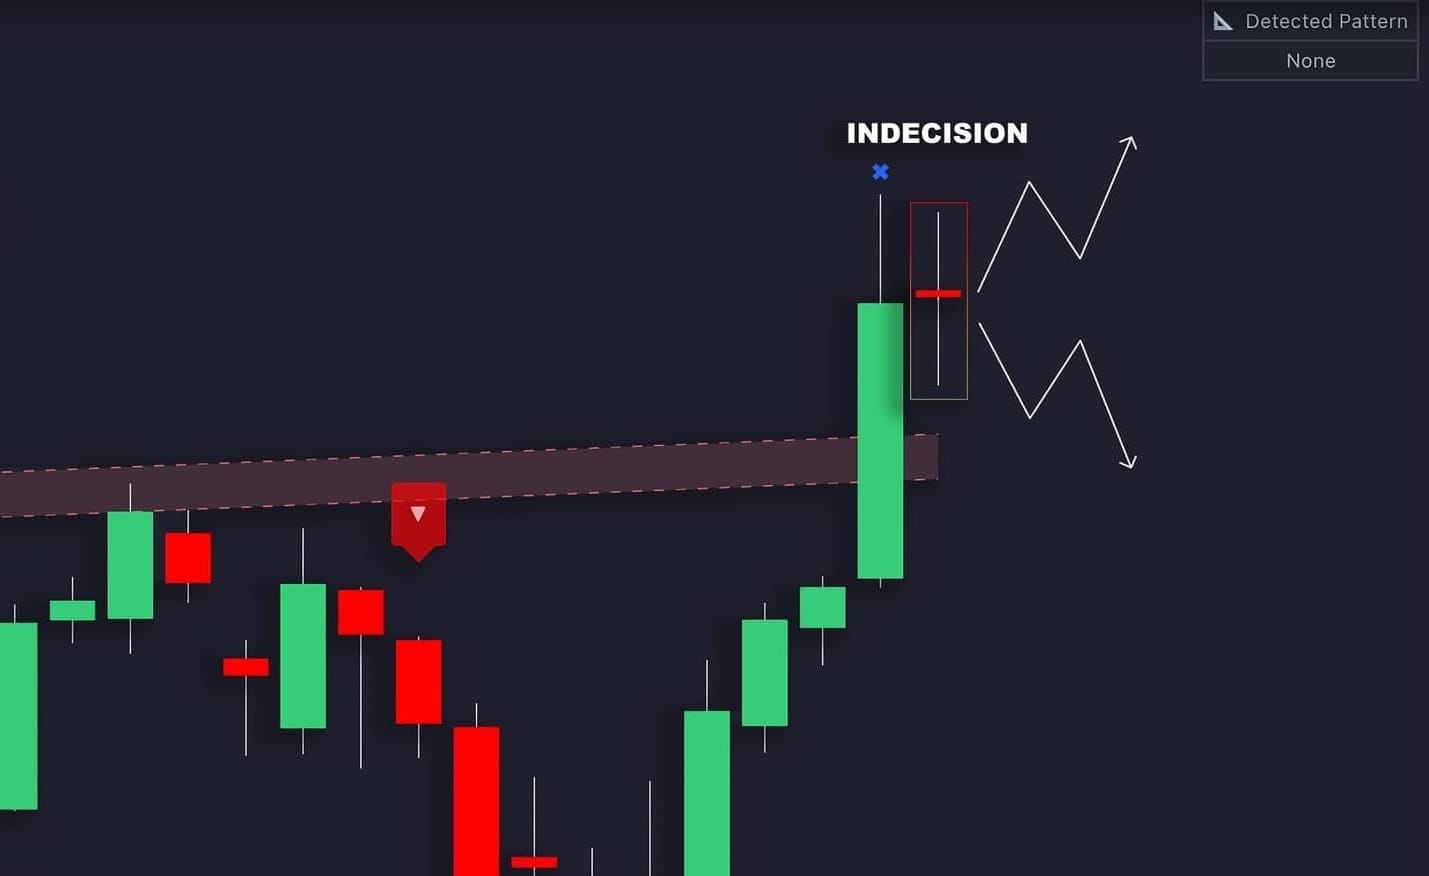
- What Is a Doji? A candlestick pattern signaling balance between buyers and sellers.
- Types of Doji Patterns: Basic, Dragonfly (bullish), Gravestone (bearish), Long-Legged (high volatility), and 4-Price (rare, no volatility).
- When to Use: Most effective at trend extremes (tops or bottoms) or near support/resistance levels.
- Key Factors: High trading volume strengthens signals; combine with tools like RSI or Bollinger Bands for confirmation.
- Common Errors: Avoid relying on a single Doji. Always analyze within broader trends and across multiple timeframes.
Quick Comparison of Doji Types
| Doji Type | Signal | Key Feature |
|---|---|---|
| Basic | Neutral | Equal-length shadows, small body |
| Dragonfly | Bullish reversal | Long lower shadow |
| Gravestone | Bearish reversal | Long upper shadow |
| Long-Legged | High indecision | Extended shadows |
| 4-Price | No volatility | Open, high, low, close are equal |
To trade effectively with Doji patterns, analyze their context, confirm signals with other indicators, and manage risks carefully. Let’s dive deeper into how these patterns work and how to apply them.
How to use Doji candlestick | Doji candlestick explained
4 Main Doji Patterns
Doji candlestick patterns are essential tools for traders, offering insights into market reversals and trends. Let's dive into four key types of Doji patterns and what they signal.
Basic Doji Pattern
The Basic Doji forms when the open and close prices are nearly identical, showing a balance between buyers and sellers. Shadows of roughly equal length indicate a period of market consolidation and indecision .
Dragonfly vs Gravestone Doji
These two patterns provide contrasting signals about market conditions and potential reversals:
| Characteristic | Dragonfly Doji | Gravestone Doji |
|---|---|---|
| Formation | Open, high, and close prices align, with a long lower shadow | Open, low, and close prices align, with a long upper shadow |
| Market Signal | Suggests a bullish reversal | Indicates a bearish reversal |
| Trading Volume | High volume strengthens its reliability | Alone, it has about a 50% success rate |
| Key Indicator | Reflects selling exhaustion | Highlights weakening buyer momentum |
These patterns are most useful when they appear at critical points in a trend.
"The dragonfly doji is a Japanese candlestick pattern that acts as an indication of investor indecision and a possible trend reversal." - Investopedia
A Dragonfly Doji is particularly effective at signaling a bullish reversal when it forms at the bottom of a downtrend, especially with high trading volume . On the other hand, a Gravestone Doji often points to a bearish reversal when it appears at the peak of an uptrend .
Long-Legged and 4-Price Doji
These advanced patterns provide further insights into market behavior:
- Long-Legged Doji: Defined by its extended shadows, this pattern reflects heightened volatility and significant indecision .
- 4-Price Doji: A rare formation where the open, high, low, and close prices are identical, signaling a complete lack of volatility .
To use these patterns effectively, traders should consider the broader market context. Look for them near key support and resistance levels or during strong trends, and confirm their signals with other technical indicators . This approach can help refine trading decisions and improve accuracy.
Reading Doji in Market Context
Understanding the market context in which Doji patterns appear is key to making informed trading decisions. By combining the foundational Doji formations with broader market conditions, traders can gain more precise insights.
Doji During Trends
The meaning of a Doji pattern shifts depending on the current market trend. In an uptrend, it often signals that buyers may be losing momentum, hinting at a possible reversal. Conversely, in a downtrend, it could indicate seller exhaustion, pointing to a potential bottom formation .
The pattern becomes more reliable when it aligns with critical trend points:
| Market Condition | Doji Signal | Required Confirmation |
|---|---|---|
| Strong Uptrend | Possible reversal warning | A bearish candle following the Doji |
| Strong Downtrend | Potential trend bottom | A bullish candle after the Doji |
| Sideways Market | Ongoing consolidation | Analysis across multiple timeframes |
These signals gain even more weight when they occur at key price levels.
Doji at Key Price Levels
Doji patterns are particularly meaningful when they appear near established support or resistance zones. For example, in August 2023, the USD/JPY market saw a Doji form near a resistance level, leading to a prolonged lateral range before a breakout was confirmed .
Here’s how to approach trading decisions at these levels:
- A Doji within a support zone reinforces that area as a strong level.
- When a Doji forms at a new low, it can establish a fresh support zone.
- Place stop-loss orders based on closing prices rather than intra-session highs or lows .
A notable instance occurred in March 2023 in the gold market. Following a strong bullish candle, a Doji session created a resistance level that saw multiple false breakouts to the upside . Volume analysis can further enhance the interpretation of these signals.
Volume and Doji Signals
Volume plays a critical role in the strength of Doji signals. For instance, high-volume Doji formations on the EUR/USD (1.10473 resistance) and GBP/USD (1.30016 support) daily charts highlight stronger market indecision . These high-volume patterns carry more weight because they reflect increased market activity .
Here’s how volume influences Doji signals:
| Volume Level | Signal Strength | Trading Implication |
|---|---|---|
| High Volume | Strong signal | Indicates a likely reversal or continuation |
| Average Volume | Moderate signal | Needs further confirmation |
| Low Volume | Weak signal | Requires strong additional confirmation |
Doji Trading Methods
Trading with Doji patterns involves recognizing these candlestick formations and managing risks effectively.
Doji Reversal Trades
Doji reversal trades focus on identifying potential trend changes, especially when these patterns appear at market extremes.
| Trade Type | Entry Condition | Stop-Loss Placement |
|---|---|---|
| Bullish Reversal | Enter a buy order above the Doji high after confirmation | Place stop-loss below the Doji low |
| Bearish Reversal | Enter a sell order below the Doji low after confirmation | Place stop-loss above the Doji high |
"The Doji rule is very simple. The price/trend will usually move in the direction of how the price opens after a Doji. This rule creates high probability candlestick trade entry set-ups." – Stephen W. Bigalow
After identifying reversal patterns, examine how Doji formations behave in trending markets.
Doji Trend Trades
In trending markets, Doji patterns can signal either reversals or pauses in momentum. These patterns reflect market indecision, so it's essential to analyze them in context. Key considerations include:
- Look for clusters of Doji patterns at trend extremes, as these may indicate a shift in sentiment.
- Check volume levels; Doji patterns with high volume often carry more weight.
- Evaluate the broader market trend and momentum before making a trading decision.
For instance, a Doji appearing after a prolonged uptrend, combined with above-average trading volume, might suggest a higher chance of a reversal.
Doji with Technical Tools
To improve accuracy, combine Doji patterns with other technical indicators. This can help confirm signals and reduce the likelihood of false entries.
| Indicator | Purpose | Signal Confirmation |
|---|---|---|
| RSI | Detect overbought or oversold conditions | Look for RSI divergence near the Doji |
| MACD | Measure trend momentum | Monitor MACD crossovers close to the Doji |
| Bollinger Bands | Assess volatility | Watch for Doji formations near the band edges |
Trades should only be executed when the Doji aligns with at least two supporting technical indicators. This layered approach helps filter out unreliable signals and increases the chances of trading success.
"The Doji is the most recognized candlestick signal. It also is an extremely high probability trade indicator." – Stephen W. Bigalow
Doji Analysis Mistakes to Avoid
Avoiding common errors in Doji analysis can help traders use these patterns more effectively within their overall trading strategy.
Single Doji Limitations
Relying solely on a single Doji candlestick is a frequent mistake. On its own, a Doji doesn't guarantee a price reversal or continuation. Its significance increases when analyzed alongside broader market factors.
| Context Factor | Impact on Doji Significance | Action Required |
|---|---|---|
| Market Trend | More relevant at extreme points of a trend | Confirm the trend's direction |
| Price Level | Gains importance near support or resistance zones | Observe price behavior |
| Volume | Strengthens the signal's credibility | Compare with average daily volume |
Traders should seek additional confirmation before making trading decisions . Incorporating multiple timeframes can further enhance the accuracy of Doji analysis.
Multiple Timeframe Analysis
Examining Doji patterns across different timeframes helps filter out market noise and provides a clearer picture for trading decisions.
Some effective steps include:
- Start with higher timeframes (daily or weekly) to understand the main trend.
- Use mid-level timeframes to pinpoint potential entry points.
- Shift to lower timeframes to fine-tune entry timing and manage risk.
- Validate Doji signals across multiple timeframes for stronger confidence.
"Multi-timeframe trading describes a trading approach where the trader combines different trading timeframes to improve decision-making and optimize their chart analyses." - Rolf
Testing and refining strategies based on these insights is a crucial next step.
Testing Doji Strategies
One mistake many traders make is skipping the testing phase for their Doji-based strategies. To succeed, it's important to systematically test and refine your approach.
| Testing Component | Purpose | Implementation |
|---|---|---|
| Historical Analysis | Assess pattern reliability | Test at least 30 trades per timeframe |
| Risk Management | Define stop-loss levels | Place stops just outside the Doji range |
| Pattern Confirmation | Minimize false signals | Combine with indicators like volume and trend direction |
Practicing on a demo account can help fine-tune your ability to recognize and act on Doji patterns .
Conclusion
Main Points Review
Understanding Doji candlesticks can help traders identify potential market reversals or continuations. These patterns, originating from Japanese trading methods, reflect market sentiment when interpreted correctly. Their importance grows when they appear at key price levels, especially with high trading volume to back them up.
| Key Aspect | Trading Implication | Validation Method |
|---|---|---|
| Key Price Levels | Most relevant at support/resistance | Trend analysis and price action |
| Volume Confirmation | Adds credibility to the signal | Compare with average daily volume |
| Market Context | Crucial for proper interpretation | Analyze across multiple timeframes |
Steps to Apply Doji Analysis
Here’s how to put this knowledge into action:
- Pattern Identification: Ensure the candle's body is no more than 5% of the total range to qualify as a Doji .
- Context Analysis: Examine the pattern’s location within broader trends and near critical support or resistance zones.
- Signal Confirmation: Before acting, validate the signal using tools like RSI, Bollinger Bands, or volume analysis.
Tools for Doji Trading
Take your trading to the next level with the right tools:
- ATAS: Known for its advanced cluster charts, ATAS offers customizable settings for thorough volume analysis.
- LuxAlgo: Offers many free indicators on the LuxAlgo Library for Doji candlestick trading, including the Reversal Candlestick Structure.
- TradingView: Provides a comprehensive charting platform with robust tools for analyzing Doji candlestick patterns.
Combining these tools with solid risk management strategies can help refine your skills and improve your trading outcomes.


