Learn how Fibonacci retracements can help traders identify potential market reversals using key mathematical ratios.
Fibonacci retracements are a popular method in technical analysis, helping traders identify potential market reversal points by using specific mathematical ratios. These levels – 23.6%, 38.2%, 50%, and 61.8% – are plotted between a price’s high and low to highlight areas of support or resistance . The 61.8% level, also known as the " golden retracement ", is considered the most important.
Key Takeaways:
- What They Do: Help predict where prices might reverse during pullbacks.
- Common Levels: 23.6%, 38.2%, 50%, 61.8%, and 78.6%.
- How to Use: Identify swing highs and lows , then apply Fibonacci levels to spot entry or exit points.
- Best Practices: Combine with other indicators like moving averages, RSI, or volume for confirmation.
For example, if a stock rises from $10 to $15, the 61.8% retracement level would be around $11.91, potentially acting as a support zone. These levels are widely used across markets like stocks, forex, and crypto.
Fibonacci retracements work best in trending markets and should be supplemented with other indicators for improved accuracy.
The Ultimate Fibonacci Retracement Tool Guide
Math Behind Fibonacci Retracements
Fibonacci retracements are based on mathematical relationships found in the Fibonacci sequence. These relationships provide a structured way to analyze price movements, as shown in trading examples later.
Key Fibonacci Ratios
The Fibonacci sequence (0, 1, 1, 2, 3, 5, 8, 13, 21, 34, …) forms the foundation for these ratios. Each ratio is derived from specific relationships within the sequence and plays a distinct role in technical analysis:
| Ratio | How It's Derived | Importance in Trading |
|---|---|---|
| 23.6% | Divide a Fibonacci number by one three places ahead | Indicates a shallow pullback |
| 38.2% | Divide a Fibonacci number by one two places ahead | Marks a moderate retracement |
| 61.8% | 1 divided by the golden ratio (1/1.618) | Known as the "golden retracement" |
These ratios help traders identify potential price reversal zones by turning price swings into actionable levels.
The 61.8% retracement, often called the "golden retracement", ties directly to the golden ratio (1.618), a number that appears in various natural patterns and financial market behaviors [1] [4].
How to Calculate Fibonacci Levels
To calculate these levels, apply the Fibonacci ratios to the price range between two swing points. For example, if a stock moves from $50 (low) to $100 (high):
- 23.6% level: $100 - ($50 × 0.236) = $88.20
- 61.8% level: $100 - ($50 × 0.618) = $69.10
Studies suggest that using Fibonacci levels alongside other technical indicators can improve their usefulness [5].
Using Fibonacci Retracements in Trading
Finding Price Swings
To use Fibonacci retracements effectively, it's important to identify the right price swings. Focus on major market movements rather than minor price changes. Look for clear highs and lows that span multiple candlesticks.
In an uptrend, start with a clear bottom (swing low) and follow it to a prominent top (swing high). For example, in the EUR/USD pair, a significant price move might range from 1.0500 (swing low) to 1.1200 (swing high) over several weeks [1]. These larger moves offer more dependable reference points.
| Market Condition | Swing Point Selection |
|---|---|
| Uptrend | Bottom to top (low to high) |
| Downtrend | Top to bottom (high to low) |
| Strong Trend | Use higher timeframes (daily/weekly) |
Setting Up Fibonacci Tools
Most trading platforms make it easy to apply Fibonacci retracements. Here's how to set them up:
- Choose the Fibonacci retracement tool from your platform's technical analysis options.
- For an uptrend, click on the swing low first, then drag to the swing high.
- In a downtrend, start at the swing high and drag to the swing low.
- Make sure your levels align precisely with the swing highs and lows.
For example, in Bitcoin (BTC/USD) analysis, drawing Fibonacci levels from $30,000 to $60,000 can highlight potential support zones [2]. These levels often act as key areas where price reversals or entries might occur.
Trading Examples
A practical example comes from GBP/USD . When the price rose from 1.2000 to 1.2500, a bullish engulfing candle formed around the 50% retracement level (1.2250), signaling a potential entry point.
Additionally, increased trading volume near Fibonacci levels often reinforces their importance [5]. Keep in mind that Fibonacci retracements tend to perform better in strong, trending markets. Their reliability decreases in ranging or sideways markets [1].
Advanced Fibonacci Methods
Pairing with Other Indicators
Fibonacci levels become even more effective when paired with other trading tools. Many traders use these levels as reference points to confirm signals from other indicators. Here are some common combinations:
| Indicator | Confirmation Signal |
|---|---|
| Moving Averages | Price reacts or bounces off a moving average near a Fibonacci level |
| Volume Analysis | A noticeable volume spike occurs at a retracement level |
| RSI | RSI indicates oversold or overbought conditions within a Fibonacci zone |
These combinations can provide more confidence in trade setups by aligning multiple signals.
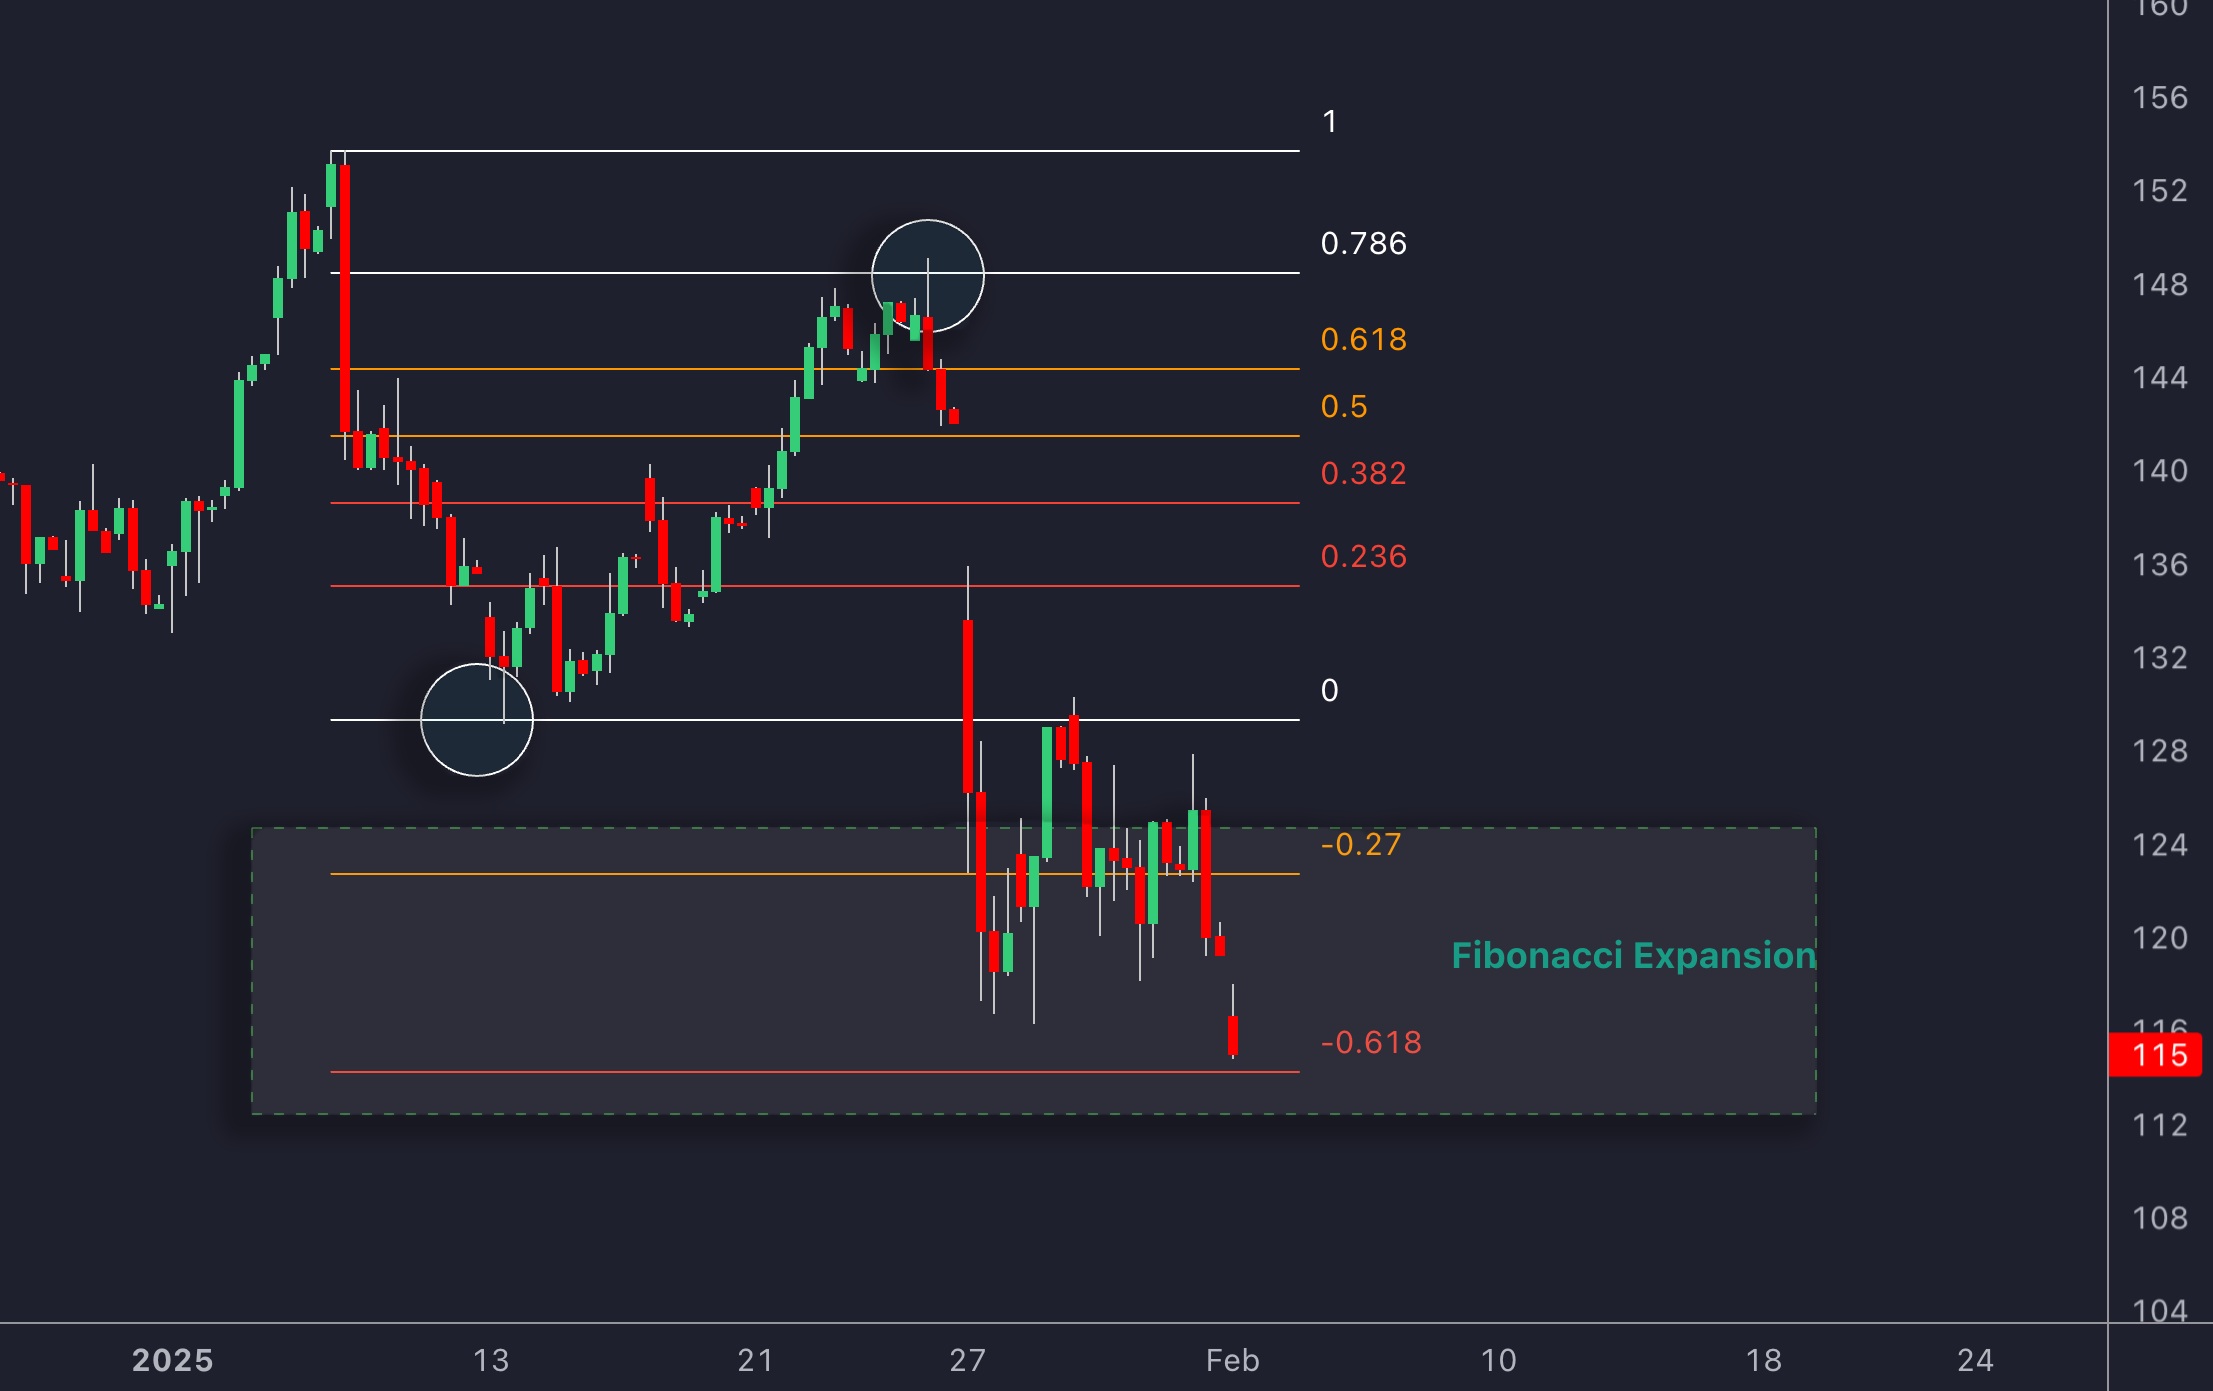
Retracements vs Extensions
Fibonacci tools aren’t just for spotting pullback entries – they’re also useful for setting profit targets through extensions. Popular extension levels like 127.2%, 161.8%, and 261.8% help traders plan exits in trending markets [6] [4]. For instance, in an uptrend, if the price retraces to the 61.8% level and starts moving higher, traders might aim for the 161.8% extension as a target.
The key difference between retracements and extensions lies in their purpose:
| Retracements | Extensions | |
|---|---|---|
| Purpose | Identifying pullback entry points | Setting profit targets |
| Key Levels | 23.6%–61.8% | 127.2%–261.8% |
Risks and Common Mistakes
Accuracy in Market Conditions
Fibonacci analysis can be heavily influenced by market volatility. This makes choosing the right swing points (as discussed earlier) essential for dependable results.
| Market State | Recommended Action |
|---|---|
| High Volatility | Use wider stops and shorter timeframes |
| Low Volatility | Focus on 23.6% and 38.2% retracement levels |
| Trending | Align Fibonacci levels with the overall trend |
| Ranging | Combine Fibonacci with oscillators for better insights |
These adjustments work hand-in-hand with trend alignment strategies covered in earlier examples.
Avoiding Overuse
Burton Malkiel, in "A Random Walk Down Wall Street," highlights that many Fibonacci patterns might just be random price movements. This reinforces the importance of confirming patterns with other tools, as shown in earlier examples.
To keep your strategy effective:
- Always confirm Fibonacci levels with other indicators.
- Treat Fibonacci as a secondary method rather than the sole decision-maker.
- Avoid relying on Fibonacci levels during major news events, as they may lose relevance.
Summary
Main Lessons
Fibonacci retracements offer a clear, math-based approach to spotting potential market reversal points . For example, during Tesla (TSLA)'s May 2023 rally from $160 to $240, the stock found support at the 38.2% level ($209.28). This real-world case highlights how Fibonacci levels can help predict market behavior.
Getting Started
If you want to use Fibonacci retracements effectively in your trading strategy, here’s how:
Practice Methodology
Start by applying swing identification techniques (covered in Section 3) to historical charts:
- Analyze past trends using swing identification methods.
- Observe how prices react at Fibonacci levels.
Advanced Implementation
Take your skills further by focusing on:
- Identifying Fibonacci clusters.
- Adjusting levels dynamically as market conditions change.
- Conducting multi-timeframe analysis to find convergence points.
FAQs
How does the Fibonacci retracement work?
Fibonacci retracement levels are based on ratios derived from the Fibonacci sequence. These levels – 23.6%, 38.2%, 50%, and 61.8% – are plotted as horizontal lines on a chart between key high and low points. They help traders identify potential support and resistance areas where price reversals might occur [1] [6]. This method ties closely to swing identification, where price movement around these levels signals potential turning points.
How does Fibonacci's strategy work?
Fibonacci analysis is often used with a structured approach that includes:
- Entry Points: Key Fibonacci levels, typically between 38.2% and 61.8%.
- Stop Loss Placement: Just beyond the next Fibonacci level.
- Confirmation Signals: Use of technical indicators at these levels.
- Risk Management: Position sizing based on proximity to Fibonacci levels.
This method combines Fibonacci retracement levels with other techniques like price action and additional technical indicators to improve accuracy [5].
What is the most effective Fibonacci retracement level?
The 61.8% level, often called the "golden ratio", is widely regarded as the most reliable, especially when paired with trend confirmation [1]. Its effectiveness depends on market conditions. For instance, the 38.2% and 61.8% levels tend to perform better in trending forex markets [3].
To increase reliability, traders often combine Fibonacci retracements with other technical tools. For example, they might look for candlestick reversal patterns or RSI divergences at these levels to confirm potential reversal zones before making a trade [5].