Explore the Head & Shoulders pattern, a crucial tool for identifying market reversals and optimizing trading strategies.
The Head & Shoulders pattern is a key chart formation in technical analysis that signals a potential market reversal from an uptrend to a downtrend. It consists of three peaks: a higher middle peak (the "head") flanked by two lower peaks (the "shoulders") and a support line called the "neckline." Traders use this pattern to:
- Identify Reversals: Signals a shift from bullish to bearish trends.
- Set Entry Points: A break below the neckline indicates a trading opportunity.
- Manage Risk: Stop-loss orders are placed above the shoulders or head.
- Estimate Targets: Pattern height helps calculate potential price moves.

Key components include:
- Left Shoulder: Initial peak with strong volume.
- Head: Highest peak signaling market exhaustion.
- Right Shoulder: Lower peak with reduced volume.
- Neckline: Support line confirming the pattern when broken.
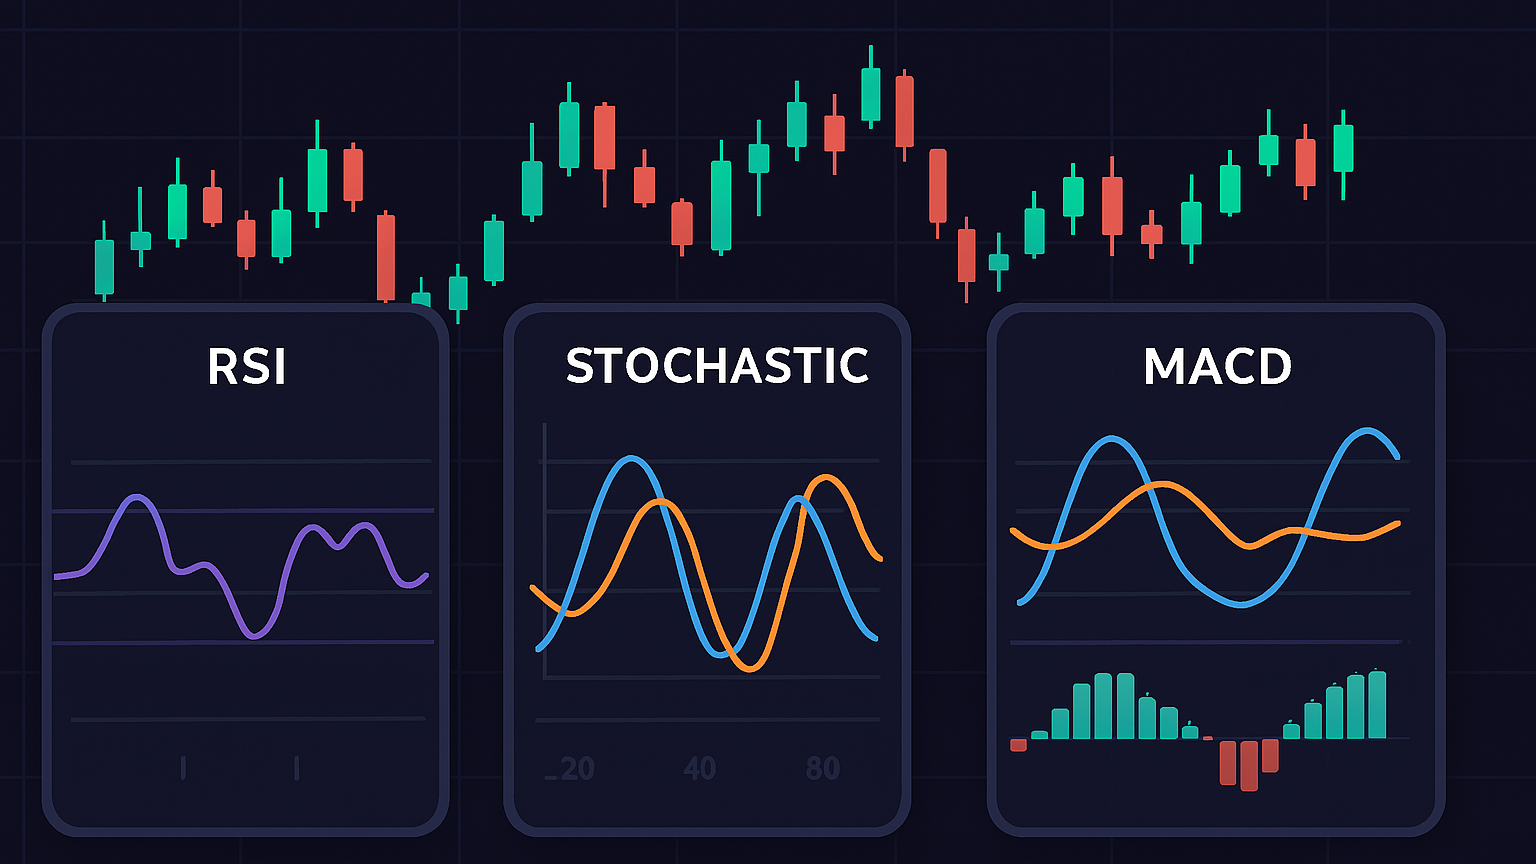
This pattern is reliable across stocks, forex, and cryptocurrencies, especially when combined with volume analysis and other indicators like RSI or MACD.
| Component | Signal | Volume Trend |
|---|---|---|
| Left Shoulder | Initial buying strength | High |
| Head | Market peak | Diminished |
| Right Shoulder | Weakening momentum | Lower than left |
| Neckline Breakout | Confirms pattern completion | Volume surge required |
The Inverse Head & Shoulders is a bullish variation signaling upward reversals. Use this pattern with caution, ensuring all components align before trading.
The Head and Shoulders Pattern Masterclass
Pattern Components
The Head & Shoulders pattern has four main elements that signal a potential market reversal. Knowing these parts helps traders spot and confirm the pattern with confidence.
Left Shoulder
The left shoulder forms during an uptrend. It’s marked by strong buying activity (high volume) that gradually fades as buyers lose momentum.
Head Peak
The head is the highest point in the pattern, marking the peak of the market move and hinting at a possible reversal.
Right Shoulder
The right shoulder typically mirrors the height of the left shoulder. However, it’s accompanied by lower volume, showing reduced buyer interest.
Neckline
The neckline acts as a key support level. It’s drawn by connecting the lows (troughs) between the head and shoulders. A break below this line confirms the pattern and signals a potential trade entry.
Here’s a quick breakdown of the components:
| Component | Volume Characteristic | Key Signal |
|---|---|---|
| Left Shoulder | High volume | Shows initial buying strength |
| Head | Not applicable | Marks the highest point of the trend |
| Right Shoulder | Lower volume than the left | Suggests weakening momentum |
| Neckline | Not applicable | Break below confirms the pattern |
Understanding these components sets the foundation for recognizing and trading the Head & Shoulders pattern effectively.
Pattern Recognition Steps
Here's how to identify the Head & Shoulders pattern in real time. Focus on spotting distinct peaks in a price trend and confirming the pattern's validity through volume analysis.
Chart Pattern Spotting
Look for three peaks during an uptrend, with the middle peak standing out as the highest. The outer peaks (or "shoulders") should have similar heights and durations for a balanced structure.
| Pattern Element | What to Look For | Why It Matters |
|---|---|---|
| Peak Heights | Middle peak higher than the others | Indicates the pattern is forming |
| Shoulder Balance | Outer peaks of similar height | Reflects the symmetry of the pattern |
Volume Check
Volume is a key factor in confirming the pattern. Typically, the volume trend evolves as follows:
"Volume generally follows the price higher on the left shoulder. However, the head is formed on diminished volume indicating the buyers aren't as aggressive as they once were. And on the last rallying attempt - the left shoulder - volume is even lighter than on the head, signaling that the buyers may have exhausted themselves."
This steady decline in volume often signals that momentum is weakening, setting the stage for a potential breakout.
Breakout Signals
To confirm a breakout, watch for these signs:
- Price Action: A clear break below the neckline support level.
- Volume Surge: A noticeable increase in volume during the breakout.
- Confirmation: The price stays below the neckline after the break.
"The head and shoulders pattern is confirmed when the price breaks below the neckline, signaling a potential downtrend."
For a more cautious approach, consider waiting for the price to retest the neckline after the initial break. This retest often provides a better entry point and reduces risk. Using these signals ensures well-timed trade decisions and more effective risk management.
Trading Methods
Trade Entry and Exit
The Head & Shoulders pattern provides three main ways to enter a trade: execute immediately below the neckline, wait for a retest for a potentially better risk-reward setup, or use a pending order once the neckline is clearly defined.
| Entry Strategy | Advantages | Best Used When |
|---|---|---|
| Immediate Entry | Strong confirmation | Volume confirms the breakout |
| Retest Entry | Improved risk-reward ratio | Market hesitates after the breakout |
| Pending Order | Precise execution | Pattern formation is clear |
"Traders must wait for the pattern to complete because a pattern may not develop at all or a partially developed pattern may not complete in the future. Partial or nearly completed patterns should be watched but no trades should be made until the pattern breaks the neckline."
Once you've selected your entry strategy, ensure you manage risk effectively with a well-placed stop-loss.
Stop-Loss Rules
Stop-loss orders are crucial for controlling risk when trading the Head & Shoulders pattern. Here's how you can position them:
| Stop-Loss Position | Risk Level | Protection Level |
|---|---|---|
| Above Right Shoulder | Moderate | Standard protection |
| Above Pattern Head | Higher | Maximum protection |
| Above Neckline Retest | Conservative | Confirms breakout |
With your risk managed, the next step is to set clear profit targets.
Profit Targets
Profit targets are calculated by measuring the height of the pattern and subtracting it from the breakout point. For instance, if the head is at $235 and the neckline is at $225 (a $10 difference), the target would be $215.
| Target Type | Calculation Method | Risk Profile |
|---|---|---|
| Conservative | First key support level | Lower risk |
| Standard | Measured move projection | Balanced risk |
| Aggressive | Extended measured move | Higher risk |
Pattern Variations and Risks
Inverse Pattern
The Inverse Head & Shoulders pattern indicates a potential upward reversal at the end of a downtrend. It consists of three troughs, with the middle one being the lowest. Here's a comparison of the traditional and inverse versions:
| Pattern Element | Traditional H&S | Inverse H&S |
|---|---|---|
| Market Position | Top of Uptrend | Bottom of Downtrend |
| Signal Type | Bearish Reversal | Bullish Reversal |
| Entry Point | Below Neckline | Above Neckline |
| Volume Pattern | Decreasing | Increasing |
Understanding these differences is crucial to avoid misinterpreting signals. Let’s dive into some common mistakes traders make.
Common Mistakes
Trading Head & Shoulders patterns can be tricky, especially if you fall into these common traps:
| Common Error | Impact | Prevention Strategy |
|---|---|---|
| Premature Entry | Leads to false signals | Wait for a neckline break |
| Misreading Volume | Weakens confirmation | Check breakout volume |
| Incorrect Neckline Drawing | Invalidates the pattern | Connect pivots accurately |
Always double-check the pattern's signals against broader economic indicators to improve accuracy. And remember, market conditions play a huge role in pattern reliability.
Market Context
The effectiveness of the Head & Shoulders pattern depends heavily on market conditions and the timeframe being analyzed. Here's how different scenarios can influence its reliability:
| Market Condition | Pattern Reliability | Adjustment Needed |
|---|---|---|
| High Volatility | Lower | Use wider stops |
| Trending Market | Higher | Align with the trend |
| Range-Bound | Moderate | Focus on volume |
The pattern becomes even more reliable when similar formations appear on longer timeframes. It works across a range of asset classes - stocks, commodities, and currencies - and is adaptable to various timeframes, making it a versatile tool for traders.
Summary
Here’s a streamlined recap of the key points and steps to take from the analysis above.
Main Points
The Head & Shoulders pattern is a classic signal for market reversals. Let’s break it down:
| Component | Key Factor | What to Do |
|---|---|---|
| Pattern Validation | Clear shoulders, head, and neckline | Ensure all parts are well-defined |
| Risk Management | Stop-Loss placement | Set stops just above critical levels |
| Entry Timing | Break of neckline | Enter after a clear, high-volume break |
| Profit Planning | Measured move calculation | Use the pattern height to set targets |
These elements summarize the practical takeaways from the detailed discussion.
"The head and shoulders chart pattern is a powerful tool in technical analysis, widely recognised for its ability to signal potential trend reversals in financial markets." - Shaun Murison, Senior Market Analyst
Practice Steps
Use these steps to enhance your trading approach:
- Scan daily charts for clear patterns and analyze volume trends.
- Calculate risk by sizing positions based on the distance between entry and stop-loss.
- Plan entries and exits using the measured move technique from the breakout point.
- Set profit targets by projecting the pattern’s height.
Pair these strategies with helpful indicators:
| Indicator | Purpose | How to Use |
|---|---|---|
| Moving Averages | Confirm trends | Use 50/200-day MAs |
| RSI | Assess momentum | Watch for overbought levels |
| MACD | Identify signals | Look for bearish divergence |
These tools and steps can help refine your trading strategy and improve decision-making.


