How AI Improves Trade Entry Accuracy

AI can help improve the process used to research trade entries, but improved accuracy must be demonstrated. Generating a convincing explanation or a profitable historical chart is not enough. Define the entry, compare it with a baseline, include costs, and test data that did not guide the original choices.
In LuxAlgo’s native charts, Quant, our coding agent, helps turn written trading rules into code you can inspect and run. The Library and available order-flow tools provide additional research context. These capabilities support a repeatable investigation; they do not guarantee optimal entries or remove human bias.
Define Trade Entry Accuracy Before Testing
“Accurate entry” can mean several different things. A price forecast might correctly predict direction over the next five bars while a trade still loses after spreads, slippage, and its exit rules. A high win rate can also conceal occasional large losses.
| Question | Measure to define | Important limitation |
|---|---|---|
| Was the direction right? | Price movement over a fixed horizon chosen beforehand | Does not include a complete trading strategy |
| Did the target come before the stop? | Target, stop, time limit, and order of events | A candle touching both levels may need finer data to resolve |
| Did the strategy improve? | Net results, drawdown, trade count, and costs versus a baseline | Changing exits or risk at the same time obscures the entry’s contribution |
| Can the result hold up? | Performance on data outside development and subsequent observation | A favorable historical sample does not establish future performance |
For example, compare an existing entry with the same entry plus one filter. Keep the market, date range, exits, position-sizing method, and cost assumptions consistent. Record how many trades the filter removes as well as what happens to returns and drawdown. Fewer trades and a higher win rate do not necessarily mean a better strategy.
Different AI Tools Do Different Jobs
A coding agent, a statistical indicator, and a news-analysis model are different tools. Identify the actual input and output before using an “AI” label as evidence of predictive ability.
Quant: Implement and Review a Research Idea
Quant can generate a strategy from plain-language instructions or help convert an indicator into explicit simulated entries and exits. Open Code to review the logic, then Run it on the intended chart. Check that the implementation matches the rule before interpreting results.
Use Inputs for exposed parameters and Properties for simulation settings such as capital, order size, commission, and slippage. A syntax fix does not prove that the trading logic is correct. Nor does saving a script automatically enable alerts or broker execution.
SuperTrend AI: Cluster Performance Across Settings
SuperTrend AI (Clustering) evaluates SuperTrend instances across a factor range and groups their performance scores using k-means. The average factor from the selected cluster supplies the plotted SuperTrend setting. This is more specific than saying it groups similar price patterns or predicts market changes.
The factor range, performance memory, selected cluster, and calculation limits affect its behavior. Adaptive parameter selection is still based on a defined calculation. It does not prove that the selected factor will be best on the next trade, and its displayed performance measure should not be interpreted as a calibrated probability of winning.
Market Sentiment Technicals: A Technical Composite
Market Sentiment Technicals normalizes and combines technical components, including momentum oscillators, trend measures, and market structures. Its panel, meter, and oscillator summarize those readings.
That is technical sentiment derived from price-based calculations. It is not a news-reading system, a survey of traders, or proof of institutional positioning. Several components may respond to the same underlying price move, so agreement among them is not necessarily independent confirmation.
Build a Native Chart Research Workflow
- Choose the market and interval. Confirm the symbol, session, data source, and date range before comparing tests.
- Write the baseline. Specify entry timing, exits, risk, and any session restrictions.
- Add one hypothesis. For example, investigate whether a completed-bar trend filter changes the baseline’s results.
- Review the code and trades. Check several entries and exits against the written specification.
- Evaluate another period. Record results on data that did not guide the initial filter or parameter choices.
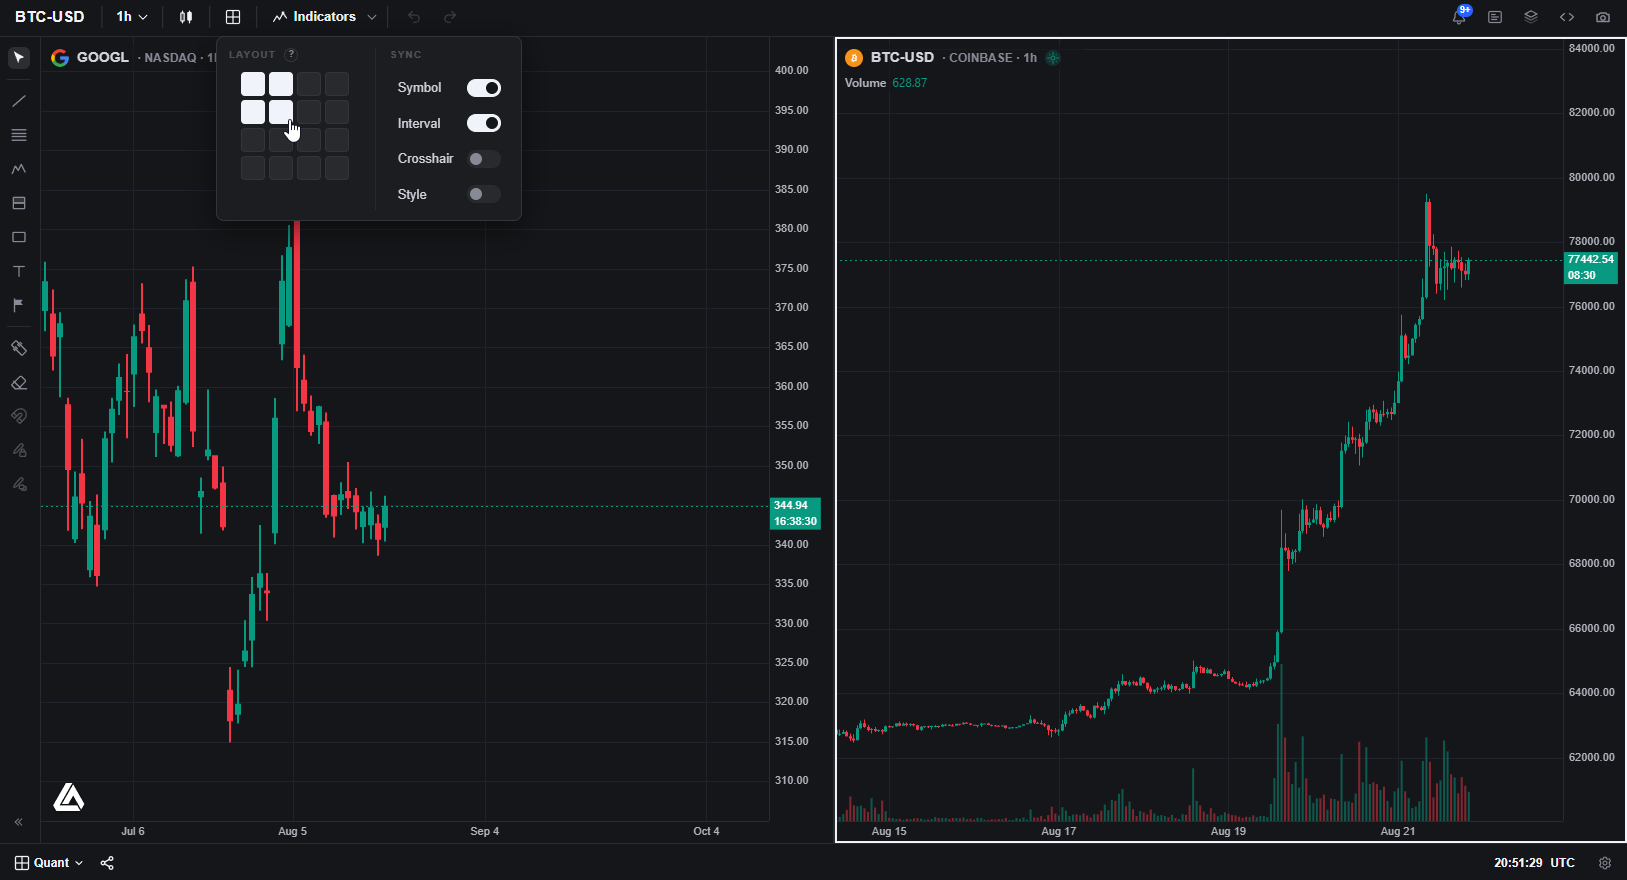
The following short demonstration shows adding indicators to a native LuxAlgo chart. Choose tools for a defined research question rather than adding more indicators simply because they agree with a trade you already want to take.
Avoid Misleading Improvements
Prevent look-ahead. A rule based on a completed candle cannot assume its final values were available earlier inside that candle. Higher-timeframe information also needs to be available at the simulated decision time. If a stop and target occur within the same bar, inspect the execution assumptions instead of choosing the favorable sequence.
Keep track of experiments. Trying many filters and reporting only the winner can make chance look like skill. Keep the baseline, rejected variations, and reasons for each change. Use out-of-sample testing to challenge the selected approach, and avoid repeatedly tuning against the supposed holdout.
Include realistic costs. Spreads, commissions, slippage, and liquidity can matter greatly for frequent entries. A simulated fill is not proof that an order of your size could execute at that price. See backtesting limitations around slippage and liquidity.
Use relevant comparisons. A cross-asset relationship requires correctly aligned timestamps, sessions, and available data. Correlation is not a causal explanation, and a relationship found in one period may change. Do not assume a coding agent automatically supplies a validated cross-asset forecasting model.
Use Additional Context Carefully
Available native order-flow tools can add trade-volume context to price analysis. Check market coverage and what each measure represents. Volume profiles or delta do not guarantee fewer false signals or reveal every participant’s intent.
Before live use, observe the chosen rules in a controlled process and compare actual decisions with the specification. Keep notes on missed entries, early entries, costs, and deviations. A tool can make rules easier to implement consistently while the person selecting, changing, or overriding those rules remains susceptible to bias.
The practical value of AI is that it can help you formulate and investigate more precise questions. An improvement in trade entry quality is a conclusion supported by evidence—not a property guaranteed by the AI label.
FAQs
How does AI trading work?
AI trading tools perform different tasks, such as generating strategy code, classifying data, or analyzing text. In LuxAlgo, Quant helps turn explicit rules into code for review and historical testing. Whether those rules improve trading results depends on the data, implementation, execution assumptions, and evidence from evaluation.
Read next