
Learn how to effectively use indicator overlays in TradingView for market analysis, enhancing your trading strategies with visual insights.
Indicator overlays in TradingView are features that display directly on price charts, helping traders analyze market trends and price movements visually. They are essential for technical analysis and come in various types like Moving Averages, Bollinger Bands, and Fibonacci Retracements. Here's what you need to know:
- Purpose: Highlight trends, volatility, and key price levels.
- Types: Trend overlays (e.g., Golden Cross, Regression Channels) and volatility overlays (e.g., Bollinger Bands, Keltner Channels).
- Setup: Add through the "Indicators & Strategies" menu, customize with Pine Script, and adjust settings like style, inputs, and visibility.
- Comparison: Overlays appear on price charts, unlike oscillators, which are shown in separate panels.
Quick Comparison
| Feature | Overlays | Oscillators |
|---|---|---|
| Display Location | On price chart | Separate panel below the chart |
| Scale | Matches price scale | Own scale |
| Primary Function | Tracks price relationships | Measures momentum/strength |
| Visual Context | Directly tied to price | Requires cross-referencing |
To optimize your use of overlays, keep your chart clean, combine complementary indicators, and test strategies under different market conditions. For advanced setups, use Pine Script or third-party solutions available on TradingView.
The New BBTrend Indicator: Tutorial
Setting Up Overlays on TradingView

Now that we understand how overlays can enhance analysis, let’s dive into how to set them up.
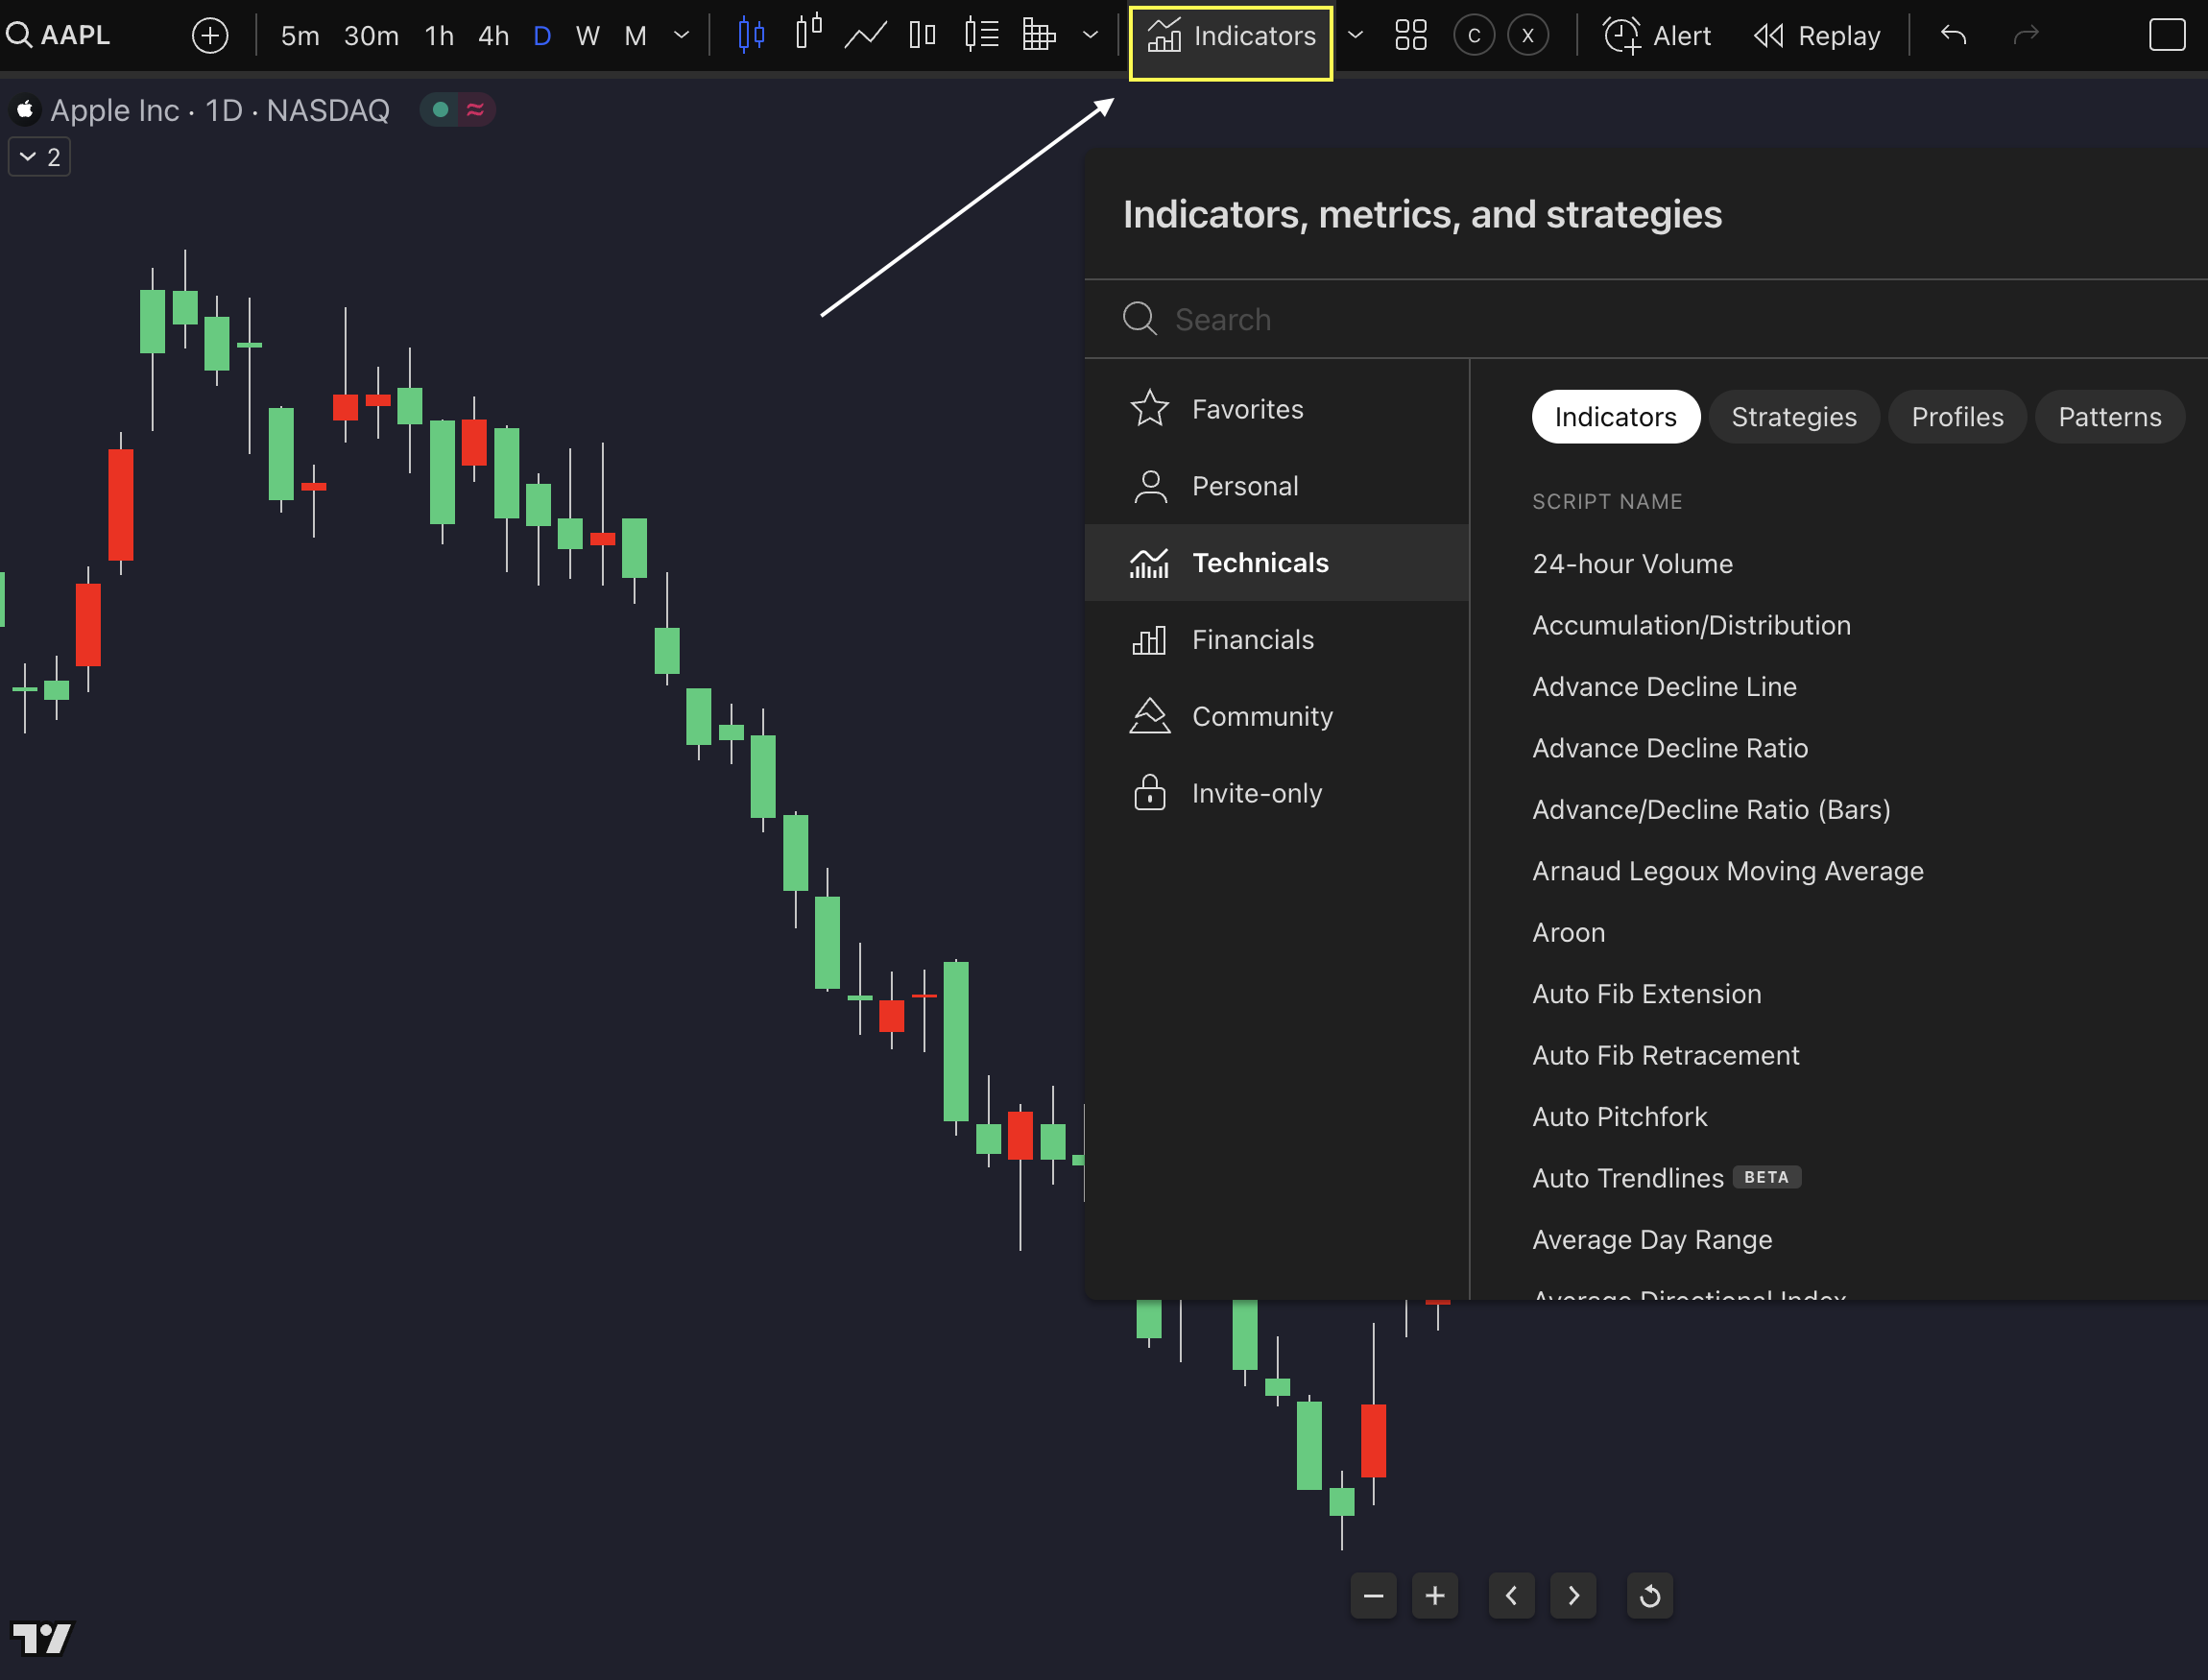
Adding New Overlays
You can add overlays using the Indicators & Strategies dialog (shortcut: Alt+I). Simply press "I" to access the indicator or click the indicator tab on the website. If you prefer, you can drag and drop indicators directly onto your chart.
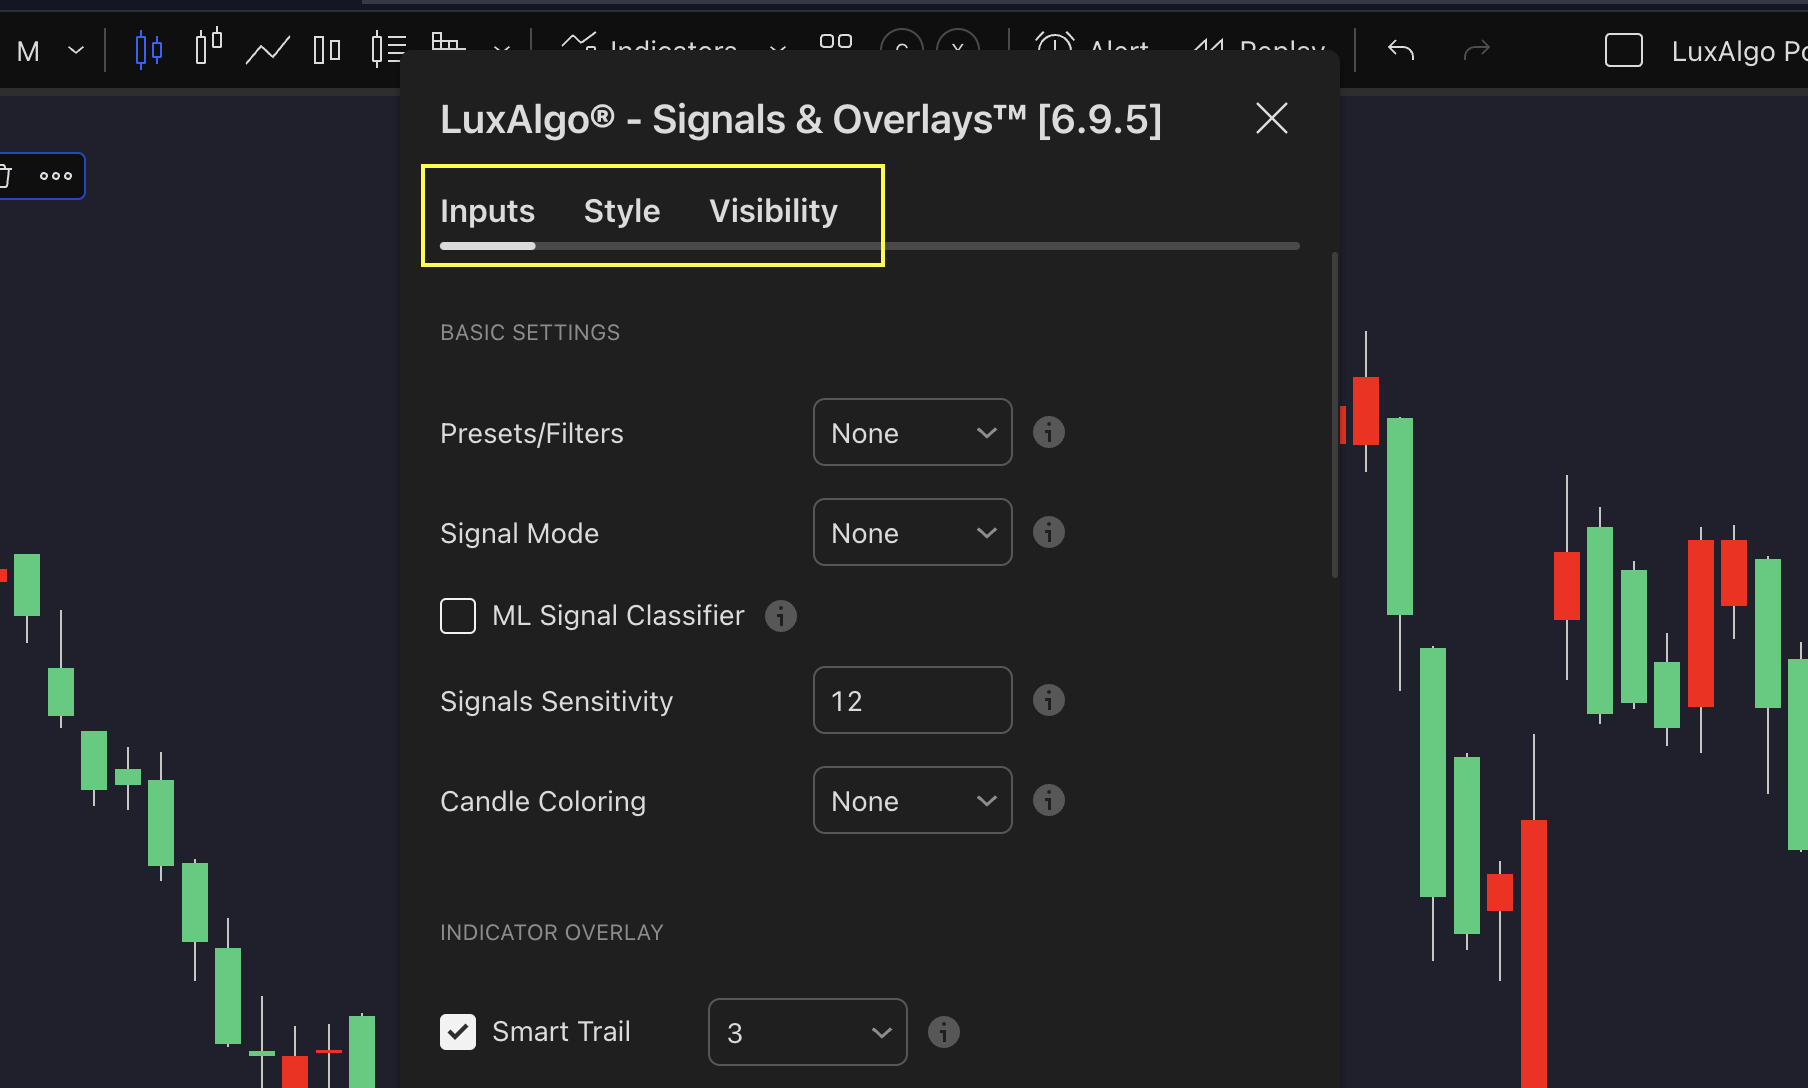
Adjusting Overlay Options
Fine-tune overlays by tweaking these three main settings:
- Style: Adjust visual elements like colors and line thickness for better readability.
- Inputs: Modify key parameters like calculation periods or data sources to suit your analysis.
- Visibility: Control when overlays appear by setting them for specific timeframes.
To access these options, right-click the overlay on your chart or in the legend and select "Settings." These adjustments ensure overlays align consistently on the chart, as discussed earlier in the Overlays vs Oscillators section.
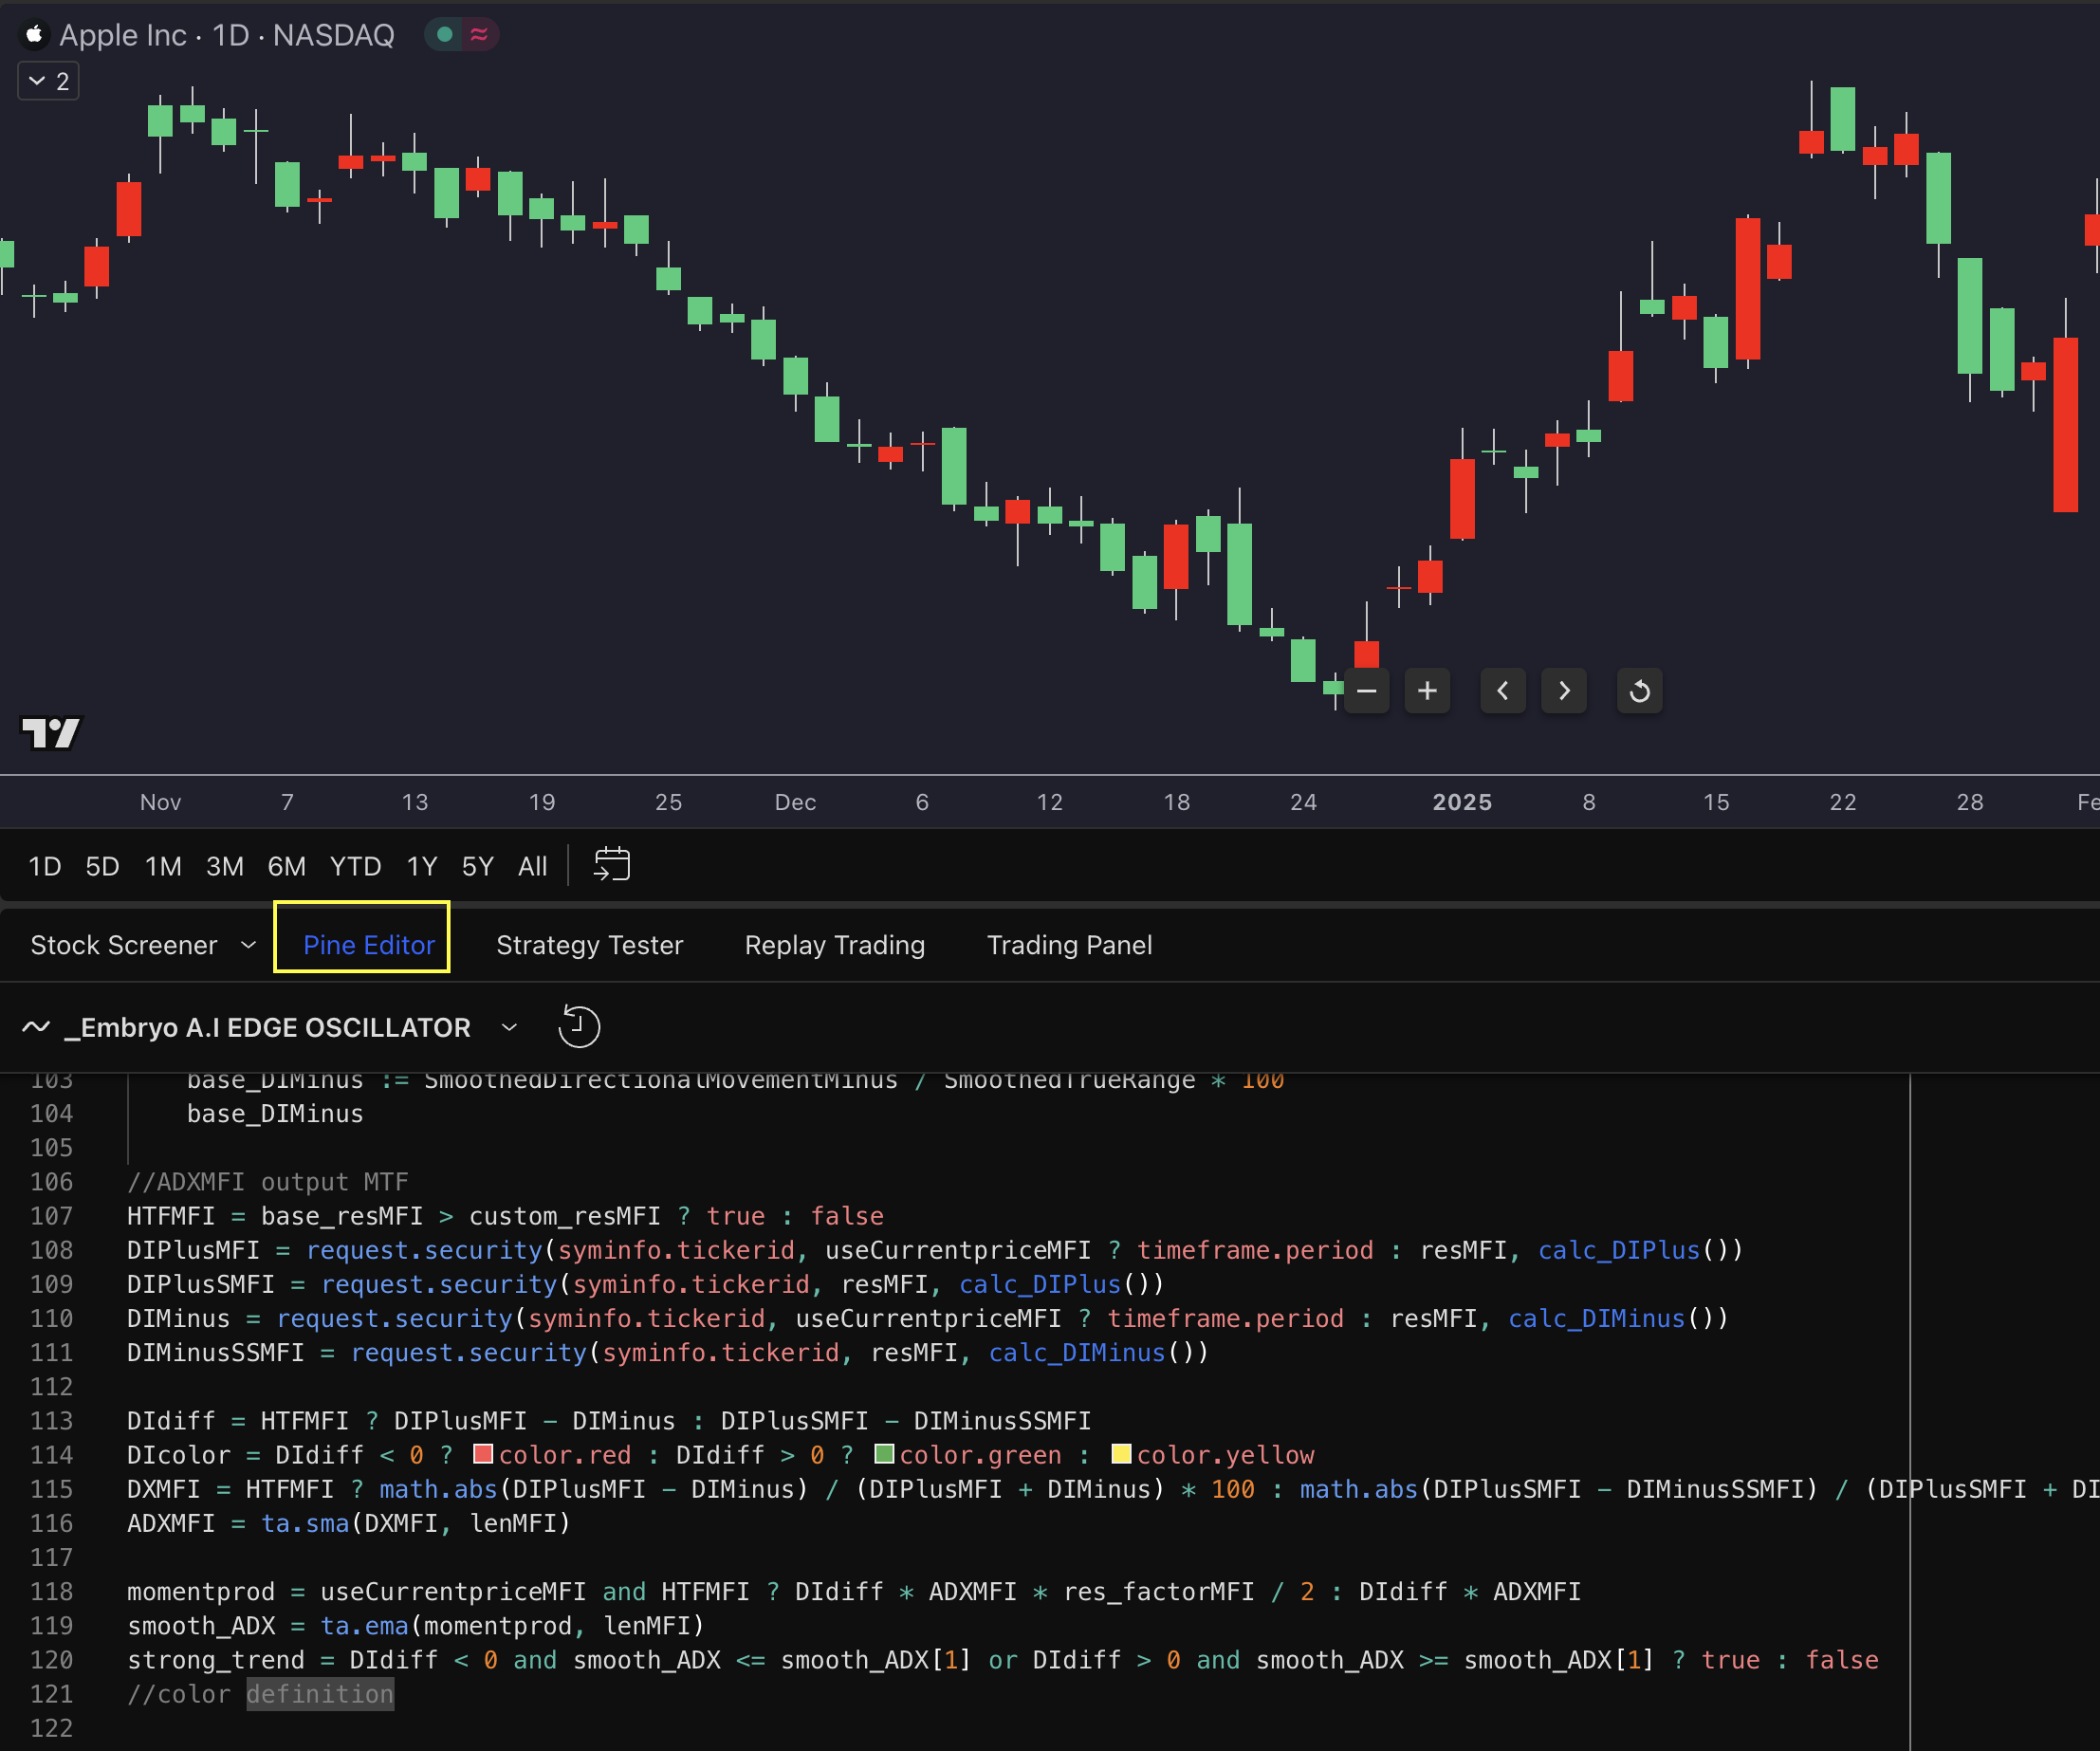
Building Custom Overlays
If you want something tailored, you can create custom overlays using Pine Script. For example, here’s how to set up a simple moving average (SMA):
//@version=5
indicator("Custom SMA", overlay=true)
length = input(14, "SMA Length")
sma = ta.sma(close, length)
plot(sma, "SMA", color=color.red)
The key here is the overlay=true declaration, which ensures the indicator is plotted directly on the price chart. Custom overlays like this become even more effective when paired with advanced overlay types - coming up next.
Main Types of Overlays and Their Functions
Trend Indicators
A "Golden Cross" occurs when the 50-day Simple Moving Average (SMA) moves above the 200-day SMA. This is a widely recognized bullish signal that traders often watch closely [5].
Regression Channels are another feature, drawing a statistical best-fit line through price data. They include upper and lower bands, usually set at 2 standard deviations. The steepness of the channel reflects the strength of the trend - steeper slopes indicate stronger momentum [4].
Volatility Indicators
Bollinger Bands adjust dynamically: they widen during periods of high volatility and narrow during calmer markets.
Keltner Channels, on the other hand, use the Average True Range (ATR) instead of standard deviation. This makes them more consistent in trending markets, as they tend to filter out false signals in choppy conditions [2].
Premium Overlay Tools
For those who prefer ready-to-use solutions instead of creating custom scripts (like the earlier Pine Script example), third-party offerings available on TradingView provide advanced overlay features. One example is LuxAlgo, which offers powerful overlay tools to enhance your analysis.
Advanced Overlay Methods
Managing Multiple Overlays
To keep multiple overlays organized, use color-coded solid lines for primary indicators and apply transparency to secondary ones. This makes it easier to distinguish between key signals and supporting data. Save these setups as templates tailored for specific analysis scenarios. This method pairs well with the style customization options mentioned earlier.
Setting Up Overlay Alerts
Creating effective overlay alerts involves combining technical signals in a thoughtful way. The platform's alert system supports multi-condition triggers, helping to fine-tune trade timing.
Here’s an example of a well-structured alert setup:
| Component | Configuration |
|---|---|
| Primary Condition | Price crosses above 50 EMA |
| Secondary Condition | RSI above 50 |
| Time Filter | Active during main trading sessions |
| Frequency | Once Per Bar Close (4H timeframe) |
For more advanced needs, the platform's Pine Script can be used to create custom alert conditions. This is especially handy for combining multiple overlay signals or applying detailed trading rules.
Testing Overlay Strategies
When testing overlay strategies, leveraging an AI Backtesting Assistant can be invaluable. It enables you to analyze overlay-based strategies across various assets and timeframes at once.
Focus on these critical aspects during testing:
- Parameter Optimization: Use features to test thousands of indicator combinations to find the best-performing configurations.
- Market Condition Analysis: Evaluate your strategy under different market conditions, including trending and ranging periods, to ensure it performs consistently.
- Risk Management: Integrate position sizing based on overlay signals. Adjust for market volatility using metrics like ATR to better manage risk [9].
These steps will help you refine and validate your strategies effectively.
Fixing Common Overlay Issues
Testing overlay strategies is just the start. Keeping them accurate and running smoothly is equally important.
Timeframe and Scale Issues
Mismatched timeframes and scaling problems can throw off your overlay signals. Always double-check that the overlay's timeframe matches your chart's settings. If overlays use different scales, it can lead to confusion and misread signals.
Common Scaling Problems and Fixes:
| Issue | Solution | How to Apply |
|---|---|---|
| Mismatched Scales | Enable the "Same Scale" option | Go to Settings > Style > Scale |
| Historical Data Gaps | Verify data sources match | Check Data Feed > Source Selection |
| Overlay Crowding | Move overlays to separate panes | Right-click > Move to New Pane |
TradingView's 'Compare' feature is handy for aligning overlays across multiple timeframes. Proper scaling ensures your overlays provide the insights you need for technical analysis.
Chart Performance Tips
Too many overlays can slow down your charts. To keep things running smoothly while using complex setups, focus on a few key optimization methods.
Tips for Better Performance:
- Limit Overlays: Show only the overlays you need.
- Adjust Data Range: Narrow down to the most relevant historical data.
- Enable Hardware Acceleration: Turn this on in your browser for faster rendering.
- Clear Cache: Regularly clean your browser cache to avoid performance lags.
If your setup is resource-heavy, built-in indicators often perform better than custom scripts. These small adjustments can make a big difference.
Custom Script Fixes
Errors in Pine Script often come from using the wrong variable types or functions. Getting these right is crucial for reliable custom scripts that maintain a direct relationship with price data.
Frequent Pine Script Errors and Solutions:
| Error Type | Cause | Fix |
|---|---|---|
| Type Mismatch | Mixing historical and live data | Use proper variable types |
| Performance Issues | Overly complex calculations | Simplify loops and functions |
| Data Access | Look-ahead errors | Limit calculations to historical data |
TradingView's Pine Script error checker is a great feature for spotting and fixing syntax problems efficiently [2][4].
Summary
Key Benefits of Overlays
TradingView's indicator overlays make technical analysis easier by offering clear visuals and real-time data. This helps traders identify trends faster [1] and evaluate market volatility more effectively [4]. These features are helpful for both beginners and experienced traders, especially when using advanced toolkits available on TradingView.
One standout feature of modern overlays is how they simplify analysis. Instead of switching between multiple indicators, traders can view relationships directly on their charts [1].
| Overlay Benefit | Technical Impact | Trading Advantage |
|---|---|---|
| Visual Integration | Plots directly on charts | Speeds up pattern spotting |
| Real-time Updates | Instant signal generation | Faster decision-making |
| Multi-timeframe Analysis | Broader market perspective | Confirms trends better |
| Data-driven Signals | Relies on objective data | Less emotional decision-making |
Best Practices
To get the most out of overlays, keep your chart setup clean and efficient. Choose indicators that complement each other and provide varied insights without overlapping. For example, combining trend overlays with volatility indicators can give a more balanced view of the market [7].
TradingView's integrated solutions, such as exclusive Signals & Overlays toolkits, take this a step further by offering advanced pattern detection and customizable visuals that enhance traditional overlays [8].
For the best results:
- Stick to 2-3 indicators that work well together.
- Adjust settings based on the specific asset you're analyzing.
- Incorporate automated features for spotting patterns.
FAQs
How to overlay indicators in TradingView?
To overlay indicators in TradingView, follow these steps:
After placing the overlay, ensure the scales align properly using the techniques mentioned in earlier sections [4].
For a clean and organized chart, stick to 2-3 complementary indicators. You can improve clarity by lowering opacity, using distinct colors, and keeping the number of features minimal [6]. These tips help avoid clutter and make your analysis more effective.
