Explore how post-trade cost analysis optimizes trading strategies, reduces costs, and enhances execution quality through detailed metrics and tools.
Post-trade cost analysis helps traders improve execution and reduce hidden expenses by reviewing the full trade lifecycle. It identifies direct costs (e.g., commissions, fees) and hidden costs (e.g., slippage, timing delays) to optimize strategies and meet regulatory requirements like MiFID II. Here's what you need to know:
- Key Metrics: Analyze costs using metrics like VWAP, Implementation Shortfall, and Z-Score.
- Benefits: Lower trading costs, improve performance, and refine strategies.
- Tools: Platforms like Bloomberg BTCA and OneTick use AI to provide actionable insights.
- Steps to Start:
- Collect accurate tick-level data.
- Use TCA tools to analyze execution quality.
- Adjust strategies based on findings.
Quick Comparison of Post-Trade Cost Analysis by Market Type:
| Aspect | Equity Trading | FX Trading |
|---|---|---|
| Market Structure | Centralized exchanges | Over-the-counter (OTC) |
| Data Standards | Standardized benchmarks | Customizable aggregated data |
| Cost Analysis Ease | Easier | More challenging due to limited transparency |
TCA Market Impact Webinar
Core Elements of Cost Analysis
Post-trade cost analysis focuses on key aspects that help refine execution strategies and improve outcomes.
Key Performance Metrics
Metrics like VWAP and Implementation Shortfall are used to evaluate execution quality. Implementation shortfall highlights the cost difference between expected and actual prices, factoring in:
- Delay Cost
- Realized Opportunity Cost
- Missed Trade Opportunity Cost
- Market Impact Cost
To lower implementation shortfall, consider using limit orders instead of market orders.
Before diving into the analysis, it’s critical to ensure the trade data is accurate and well-organized.
Getting Clean Trade Data
Accurate data is the backbone of cost analysis. Here's how the process typically unfolds:
| Data Management Phase | Key Requirements | Purpose |
|---|---|---|
| Collection | Authentication tokens | Secure access to tick history |
| Processing | Non-blocking processing | Efficient handling of data |
| Storage | Compressed formats (e.g., gzip) | Effective preservation of data |
| Integration | Merging tick data | Preparing for analysis |
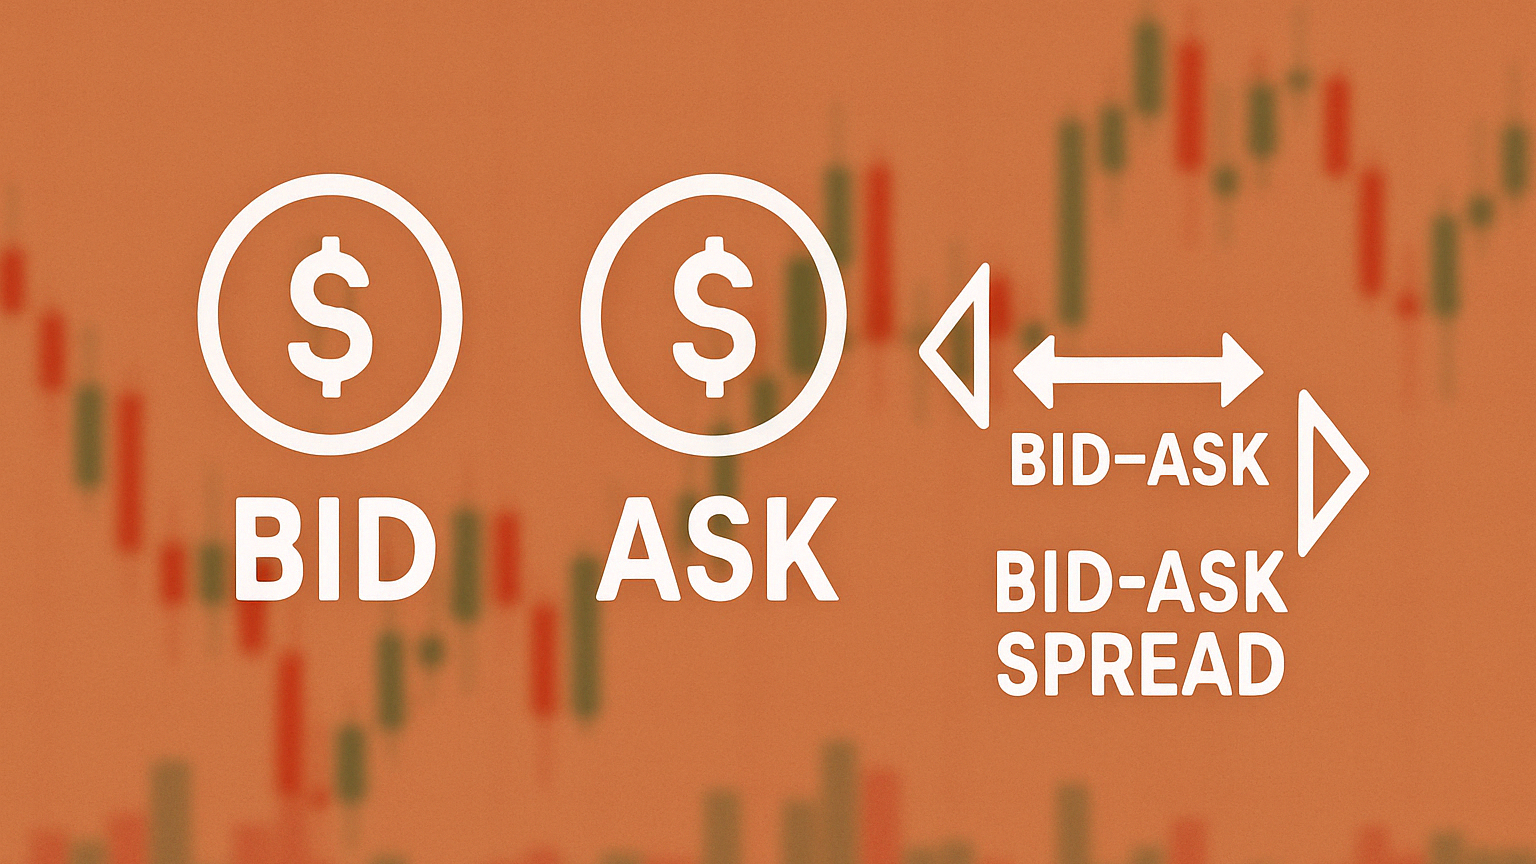
Defining precise data extraction timeframes and enabling concurrent requests ensures stability in handling large datasets. Key market metrics like bid-ask prices and VWAP are essential for meaningful analysis.
Once the data is prepped, advanced tools can provide deeper insights.
Analysis Tools Overview
Modern TCA platforms are packed with features, often incorporating AI to address diverse trading needs. Some notable tools include:
- OneTick: Named Best TCA Solution 2024, it offers detailed analysis across multiple markets.
- Bloomberg BTCA: Delivers multi-asset analysis powered by extensive global market data.
- LIST's ION LookOut TCA: Tracks over 80 performance metrics for comprehensive evaluation.
- TS Imagine's TCA: Specializes in liquidity optimization and execution performance insights.
AI and machine learning have significantly enhanced TCA platforms, making predictive analytics more accurate across asset classes like fixed income, derivatives, and FX markets.
These components play a direct role in refining trading strategies and reducing costs, which will be explored further.
Reading Analysis Results
Post-trade analysis provides insights that can improve trading decisions and help cut costs.
Finding Trading Problems
Recent benchmarking highlights that TWAP slippage ranges from -1 to -2 basis points among traditional brokers, pointing to inefficiencies in execution.
Transaction cost analysis (TCA) evaluates key metrics to identify problem areas:
| Metric | What It Shows | What to Do |
|---|---|---|
| Implementation Shortfall | Overall cost of investment decisions | High IS: Reassess order timing |
| Alpha Capture | Realized vs potential profit | Low capture: Tackle execution delays |
| Z-Score | Variance from estimated costs | Scores > 2: Investigate anomalies |
| Benchmark Costs | Price relative to market benchmarks | Underperformance: Adjust strategy |
"TCA serves as a vital tool for market participants, and their algorithmic execution providers, by offering a detailed understanding of trading costs and helping optimize trading strategies." - Anboto Labs
Beyond spotting isolated issues, examining cost patterns reveals deeper inefficiencies.
Spotting Cost Patterns
Once execution problems are identified, pattern analysis can uncover recurring cost challenges. Tick-level analytics help detect these hidden patterns. For example, data from December 2023 to February 2024 shows that higher passive execution rates - like Anboto's 74.3% - can lower costs by reducing bid-ask spread expenses.
Key indicators to monitor include:
Execution Quality Patterns:
- Slippage greater than -10 to -15 bps may indicate systemic problems.
- Delays in trade completion suggest timing inefficiencies.
- High costs at specific times highlight opportunities to optimize timing.
Cost-Saving Opportunities:
- Compare execution prices to historical trends to evaluate slippage.
- Track the ratio of passive to aggressive orders.
- Analyze performance trends across different venues.
"Minimizing trading costs and slippage should be a critical priority for asset managers." - Suren Markosov, head of Quantitative Research, Anboto Labs
Modern platforms utilize detailed data analysis to handle large datasets quickly and accurately, enabling precise pattern identification. These insights guide improvements in execution strategies and broker selection, driving better trading performance.
Making Changes Based on Data
Post-trade analysis plays a key role in improving execution quality and reducing costs.
Improving Trade Execution
Transaction cost analysis (TCA) highlights areas where execution strategies can be fine-tuned. Traders can use this data to adjust their methods and focus on critical metrics:
| Execution Element | Analysis Finding | Recommended Action |
|---|---|---|
| Order Timing | High costs during specific periods | Shift execution windows to avoid peak volatility |
| Trade Size | Large market impact | Split orders into smaller, more manageable portions |
| Order Types | Overuse of aggressive orders | Use more passive orders to secure better pricing |
| Execution Speed | Delayed fills lowering quality | Leverage algorithmic trading for faster execution |
By analyzing tick-level time-series data, traders can sharpen their entry and exit timing. Once execution strategies are optimized, the next step is assessing broker performance.
Selecting the Right Brokers
Nearly 90% of equity trading desks rely on TCA to assess and choose brokers. When evaluating brokers, focus on factors like execution speed, price improvements, fill rates, and overall trading costs. Key criteria to consider include:
- High-quality technology infrastructure
- A variety of order types and algorithmic options
- Access to diverse markets and liquidity sources
- Clear and thorough reporting capabilities
Leveraging Strategy Tools
With execution and broker selection improved, advanced strategy tools can further refine trading approaches. Modern platforms offer features that allow for precise strategy adjustments. For example, LuxAlgo's AI Backtesting Assistant provides real-time strategy assessments across multiple timeframes, enabling traders to adjust their execution based on past performance.
Technical analysis tools enhance timing by identifying patterns, analyzing volume profiles, and detecting real-time divergences. Risk management features help with position sizing, setting stop-loss levels, and calculating risk-adjusted returns.
Regular Review Methods
Regular post-trade analysis allows traders to evaluate execution costs and strategy effectiveness, ensuring consistent performance.
Combining Pre and Post Analysis
Time-series analytics helps link pre- and post-trade decisions, creating a feedback loop that enhances understanding of trading patterns and execution quality.
Key focus areas for this integration include:
| Analysis Phase | Key Metrics | Action Items |
|---|---|---|
| Pre-Trade | Bid/Ask Spreads | Estimate expected round-trip costs |
| During Trade | Real-time Price Impact | Track execution quality |
| Post-Trade | Bond Attributes & Features | Analyze execution trends and performance |
This structure supports advanced tools, including AI-driven systems, to improve cost analysis.
AI in Cost Analysis
AI-powered TCA tools provide real-time performance insights and automate execution testing.
Key AI applications include:
- Predictive Analytics: Machine learning forecasts trading costs and market impact.
- Strategy Optimization: AI suggests adjustments for execution management systems (EMS).
- Performance Monitoring: Tracks execution quality and cost metrics in real time.
A standout example is LuxAlgo's AI Backtesting Assistant, which evaluates strategies in real time, helping traders fine-tune execution parameters using historical data.
Meeting Trading Rules
As TCA technology evolves, compliance with trading regulations remains essential. Tick-level time-series analytics ensures traders meet regulatory requirements while maintaining efficiency.
Key compliance components include:
| Requirement | Implementation Method | Benefit |
|---|---|---|
| Best Execution | Detailed TCA Reports | Provides documented evidence of quality |
| Trade Surveillance | Real-time Monitoring | Detects irregularities early |
| Performance Records | Automated Documentation | Simplifies compliance reporting |
Consistent metric reviews not only ensure compliance but also reveal areas for cost savings.
Summary
Impact of Analysis
Post-trade cost analysis provides key insights that improve trading performance. For example, data from the NYSE indicates a shift in trade durations: trades lasting 30–59 seconds rose slightly from 4.9% to 5%, while those completed in 0–9 seconds dropped from 75.9% to 73.7%.
"The value of TCA is you're spending time thinking about your investment process, how to clean and capture that data, how to communicate that data back to end users to improve their understanding of markets, counterparties, and workflows." - Kevin O'Connor, head of analytics and workflow technology at Virtu Financial.
| Analysis Component | Direct Impact | Long-term Benefit |
|---|---|---|
| Tick-Level Data | Highlights execution gaps | Refines trading strategies |
| Time-Series Analytics | Tracks cost trends | Aids in better broker selection |
| Performance Metrics | Evaluates execution quality | Strengthens compliance reporting |
These insights help traders make informed decisions and refine their execution practices.
Getting Started
The findings not only expose inefficiencies but also suggest actionable steps for reducing costs. Start by setting up systems for collecting detailed tick-level data and tracking performance metrics.
"We've gone from providing TCA because it's a need and a requirement for a regulatory purpose, to looking at the TCA to drive future trading decisions and to drive an improvement in the overall outcomes of trading using the data as the insight for that process." - Victoria Bryan, vice president, lead data analyst for capital markets at Northern Trust.
To take this further, platforms like LuxAlgo's AI Backtesting Assistant can be used for real-time strategy evaluation across different timeframes. This merges traditional analysis with AI tools, offering deeper insights into trading patterns and execution quality.
Key steps to implement include:
- Data Collection: Set up systems for granular tick-level analysis.
- Performance Tracking: Use time-series analytics to monitor execution quality.
- Strategy Refinement: Leverage insights to improve trading strategies and cut costs.
"The benefit of TCA is not from forensically analysing the data – and there is an argument that we have become perhaps a bit too forensic about it – but simply the fact that it creates a discussion with your traders about their performance and why they have behaved in certain ways." - Paul Squires, head of trading, EMEA and APAC equities at Invesco.