
Explore how different trading timeframes influence stochastic oscillator settings for improved trading accuracy and performance.
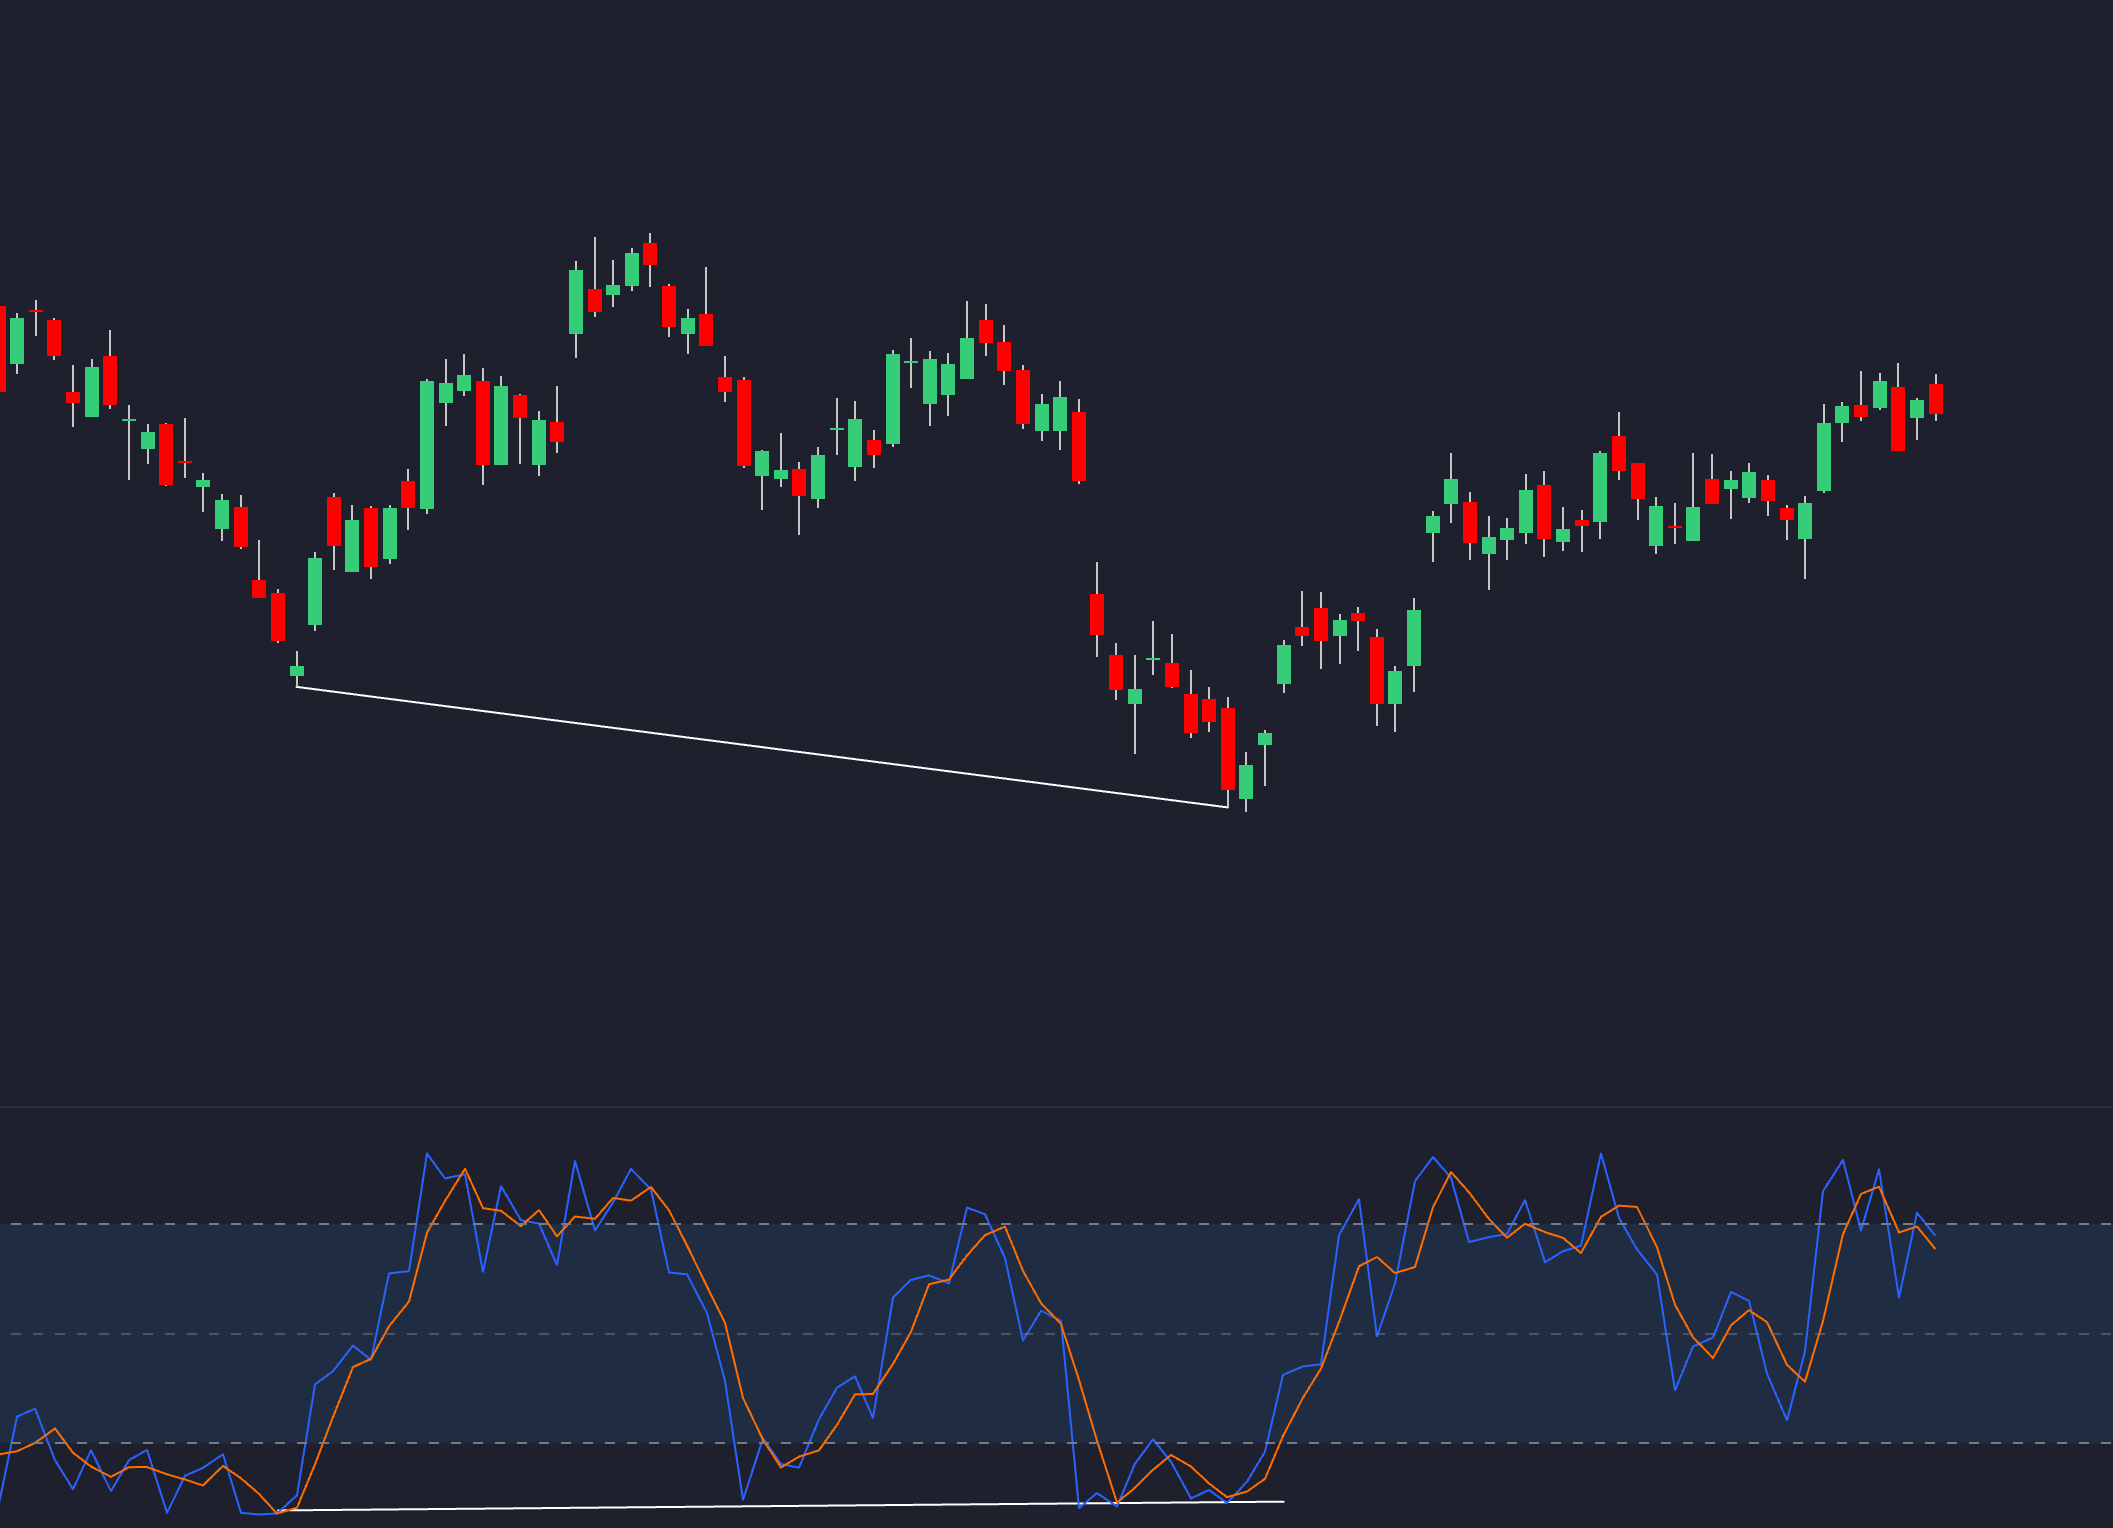
The stochastic oscillator is a key indicator for traders, but its effectiveness depends on your trading timeframe. Shorter timeframes (like 1-15 minutes) need faster settings to reduce noise, while longer timeframes (like 1-4 hours) benefit from slower, more stable settings. Here's a quick guide:
- 1-15 minutes: Use settings like (5-8, 3, 3) for quick responsiveness.
- 30-60 minutes: Moderate settings, such as (14-21, 3-5), balance stability and responsiveness.
- 1-4 hours: Slower settings like (21, 5, 5) work best for smoother signals.
- Daily charts: Stick to (14-21, 3-5) for trend-focused trading.
For better accuracy, combine signals across multiple timeframes. For example, use a daily chart for the main trend, a 1-hour chart for trade direction, and a 15-minute chart for entry points.
Tip: With its advanced indicators on TradingView, LuxAlgo automatically optimizes stochastic settings based on volatility and timeframe, helping you adapt to changing market conditions.
Multi-Timeframe Analysis of Stochastic Oscillator
Setting Up Stochastic Oscillators for Different Timeframes
Standard Settings and Their Limits
The default stochastic oscillator settings (14, 3, 3) are a common starting point. However, these settings often don't work well across all timeframes. For shorter intervals, they can produce too much noise, while for longer timeframes, they may react too slowly. This is why tweaking these parameters for specific timeframes is crucial to improve performance.
Adjusting %K, %D, and Smoothing for Each Timeframe
To get the most out of stochastic oscillators, you need to align the settings with your chosen trading timeframe. Based on testing across different asset classes, the table below highlights configurations that work best:
| Timeframe | %K Period | %D Period | Smoothing |
|---|---|---|---|
| 1-minute | 5 | 1 | 1 |
| 15-minute | 9 | 2 | 2 |
| 1-hour | 14 | 3 | 3 |
| 4-hour | 21 | 5 | 3 |
Here’s how you can fine-tune the settings:
- For 1-15 minute charts: Stick to a %K range of 5-9, with smoothing and %D set between 1-2.
- For charts 1-hour or longer: Use %K values from 14-21, with smoothing and %D in the 3-5 range.
A 4:1 ratio between %K and %D periods has consistently shown strong results across different timeframes [5].
Best Settings for Each Trading Timeframe
1-15 Minute Chart Settings
For short-term traders, especially those using 1-5 minute charts, the stochastic oscillator settings should prioritize quick responsiveness while minimizing noise. Set %K to 5-8, %D to 3, and use a slowing factor of 3. This strikes a balance between capturing rapid price movements and reducing false signals for scalping. For 15-minute charts, adjust %K to 10-14 to better filter out intraday noise and focus on meaningful price trends [1][3].
30-60 Minute Chart Settings
Traders working with 30-60 minute charts need settings that offer greater stability. For 1-hour charts, use %K: 14-21, %D: 3, and a slowing factor of 3 [1][3]. These parameters, validated by LuxAlgo’s AI-driven testing across various market conditions, are particularly effective for assets with moderate to high liquidity. This aligns with the principle of increasing stability as timeframes grow longer.
To get the most out of these settings, pair them with price action analysis and solid risk management strategies. Fine-tune %K values based on market volatility, consider asset liquidity, and always backtest thoroughly to ensure reliability.
Advanced Stochastic Oscillator Methods
Multiple Timeframe Signal Confirmation
Combining signals from different timeframes can improve the reliability of stochastic oscillator strategies. Here's a practical top-down approach:
- Primary trend: Use the daily or 4-hour chart to identify the overall trend.
- Trade direction: Check the 1-hour chart to confirm the direction of your trade.
- Entry timing: Fine-tune your entries using the 15-minute chart.
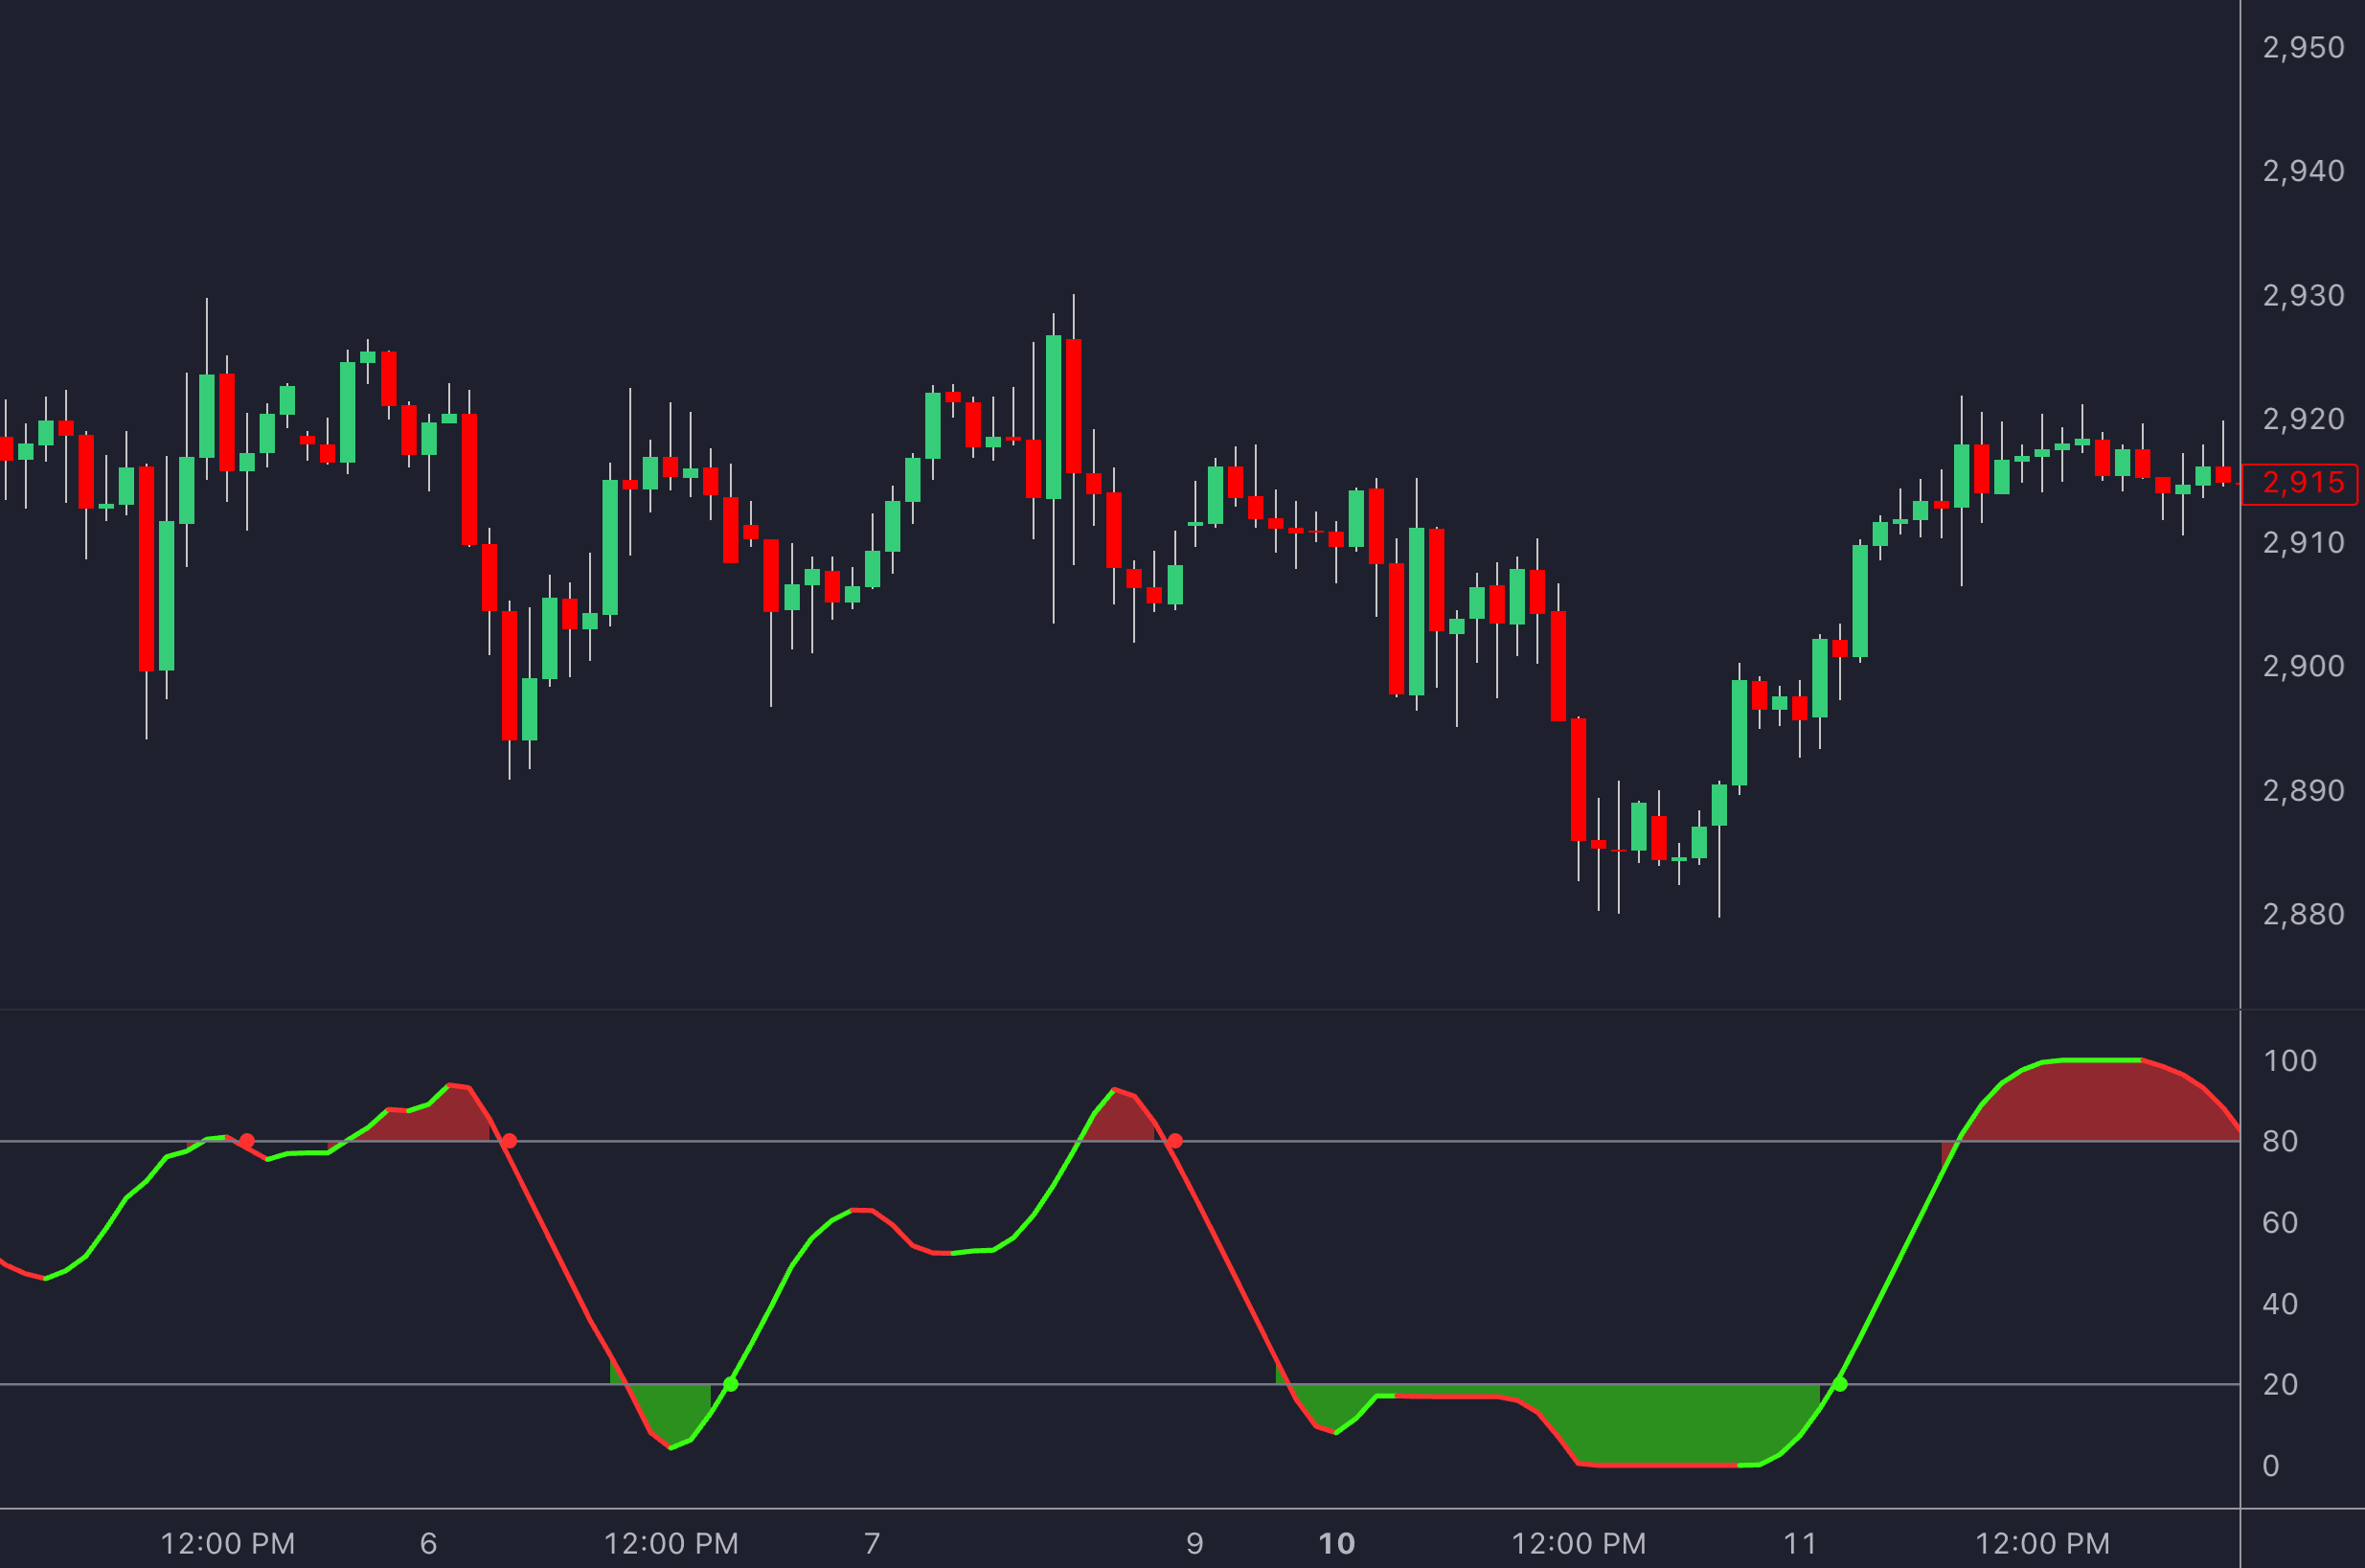
This method works best when paired with the optimized settings mentioned earlier. For instance, if the daily stochastic indicates an uptrend (above 50), look for oversold conditions (below 20) on the 1-hour chart to open long positions. Backtesting shows this approach can boost signal accuracy by 15-20% [1].
To ensure consistency, set clear rules for handling conflicting signals. Always give more weight to higher timeframe trends. For example, avoid short trades if the daily chart shows a strong uptrend, even if the 15-minute chart appears overbought.
LuxAlgo’s Multi-Length Stochastic Average
LuxAlgo’s Multi-Length Stochastic Average is an enhanced version of the traditional stochastic oscillator. By averaging multiple stochastic calculations with varying lengths, it reduces noise and improves divergence detection for more reliable trading signals. This innovative indicator refines traditional settings to better capture trend reversals and provide clearer entry points across diverse market conditions.
Learn more about the Multi-Length Stochastic Average on TradingView.
Conclusion: Choosing the Right Settings
Settings Guide by Timeframe
When fine-tuning your trading strategy, it's crucial to match your stochastic settings to your chosen timeframe. Here's a quick rundown:
- For 1-15 minute charts, faster settings like (5-8, 3, 3) are ideal for scalping, offering quick responsiveness [1][3].
- 30-60 minute charts tend to work better with moderate settings, such as (14-21, 3-5), balancing responsiveness and stability [3][4].
This approach highlights an important takeaway: there’s no one-size-fits-all setting. Tailoring your parameters to your timeframe is essential.
Using LuxAlgo for Better Results
LuxAlgo provides exclusive indicators and advanced features on TradingView that simplify stochastic oscillator analysis. Its integrated backtesting feature lets you validate your settings against historical data before deploying them in live trades, ensuring your strategy remains robust amid changing market conditions.
FAQs
What is the best timeframe for stochastic oscillator?
The ideal timeframe for the stochastic oscillator depends on your trading style. For day traders, 5-15 minute charts work well, while swing traders often prefer 4-hour or daily charts [1][2]. Your chosen chart interval directly affects how the indicator performs.
Here’s a helpful guide for setting up based on timeframe:
| Timeframe | Suggested Settings |
|---|---|
| 1-5 min | (5,3,3) or (9,3,3) |
| 15-30 min | (14,3,3) |
| 1-4 hour | (14,3,3) or (21,5,5) |
| Daily | (14,3,3) or (21,5,5) |
When trading in high-volatility conditions, shorter timeframes paired with settings like (5,3,3) can help capture quick moves. For lower volatility, settings such as (14,3,3) are better suited to avoid unnecessary noise [2][3].
This highlights how the right timeframe and parameter settings go hand in hand for optimal performance.


