Learn how to customize TradingView charts with custom indicators to enhance your trading strategy and analysis.
Want to enhance your TradingView experience? Adding custom indicators lets you tailor your charts to fit your trading strategy. Here’s how you can get started:
- Use TradingView’s Pine Script Editor: Create personalized indicators.
- Browse Community Scripts: Access pre-made options or premium selections.
- Fine-Tune Settings: Adjust parameters like time periods, price sources, and visual styles.
- Combine Indicators: Layer multiple elements for deeper insights.
- Set Alerts: Automate notifications based on specific conditions.
Custom indicators provide flexibility and allow you to backtest strategies, integrate multiple data points, and personalize your technical analysis. Whether you're a beginner or advanced user, TradingView combined with the powerful features provided by LuxAlgo—offering hundreds of free trading indicators, exclusive toolkits, and an AI Backtesting platform—can elevate your trading game.
Ready to dive in? Let’s break it down step-by-step.
How To Modify a Public Indicator In TradingView & Make it Your Own
Step 1: Finding and Adding Custom Indicators
Now that you're familiar with the purpose of custom indicators, let's walk through how to add them to your chart.
TradingView Menu Layout
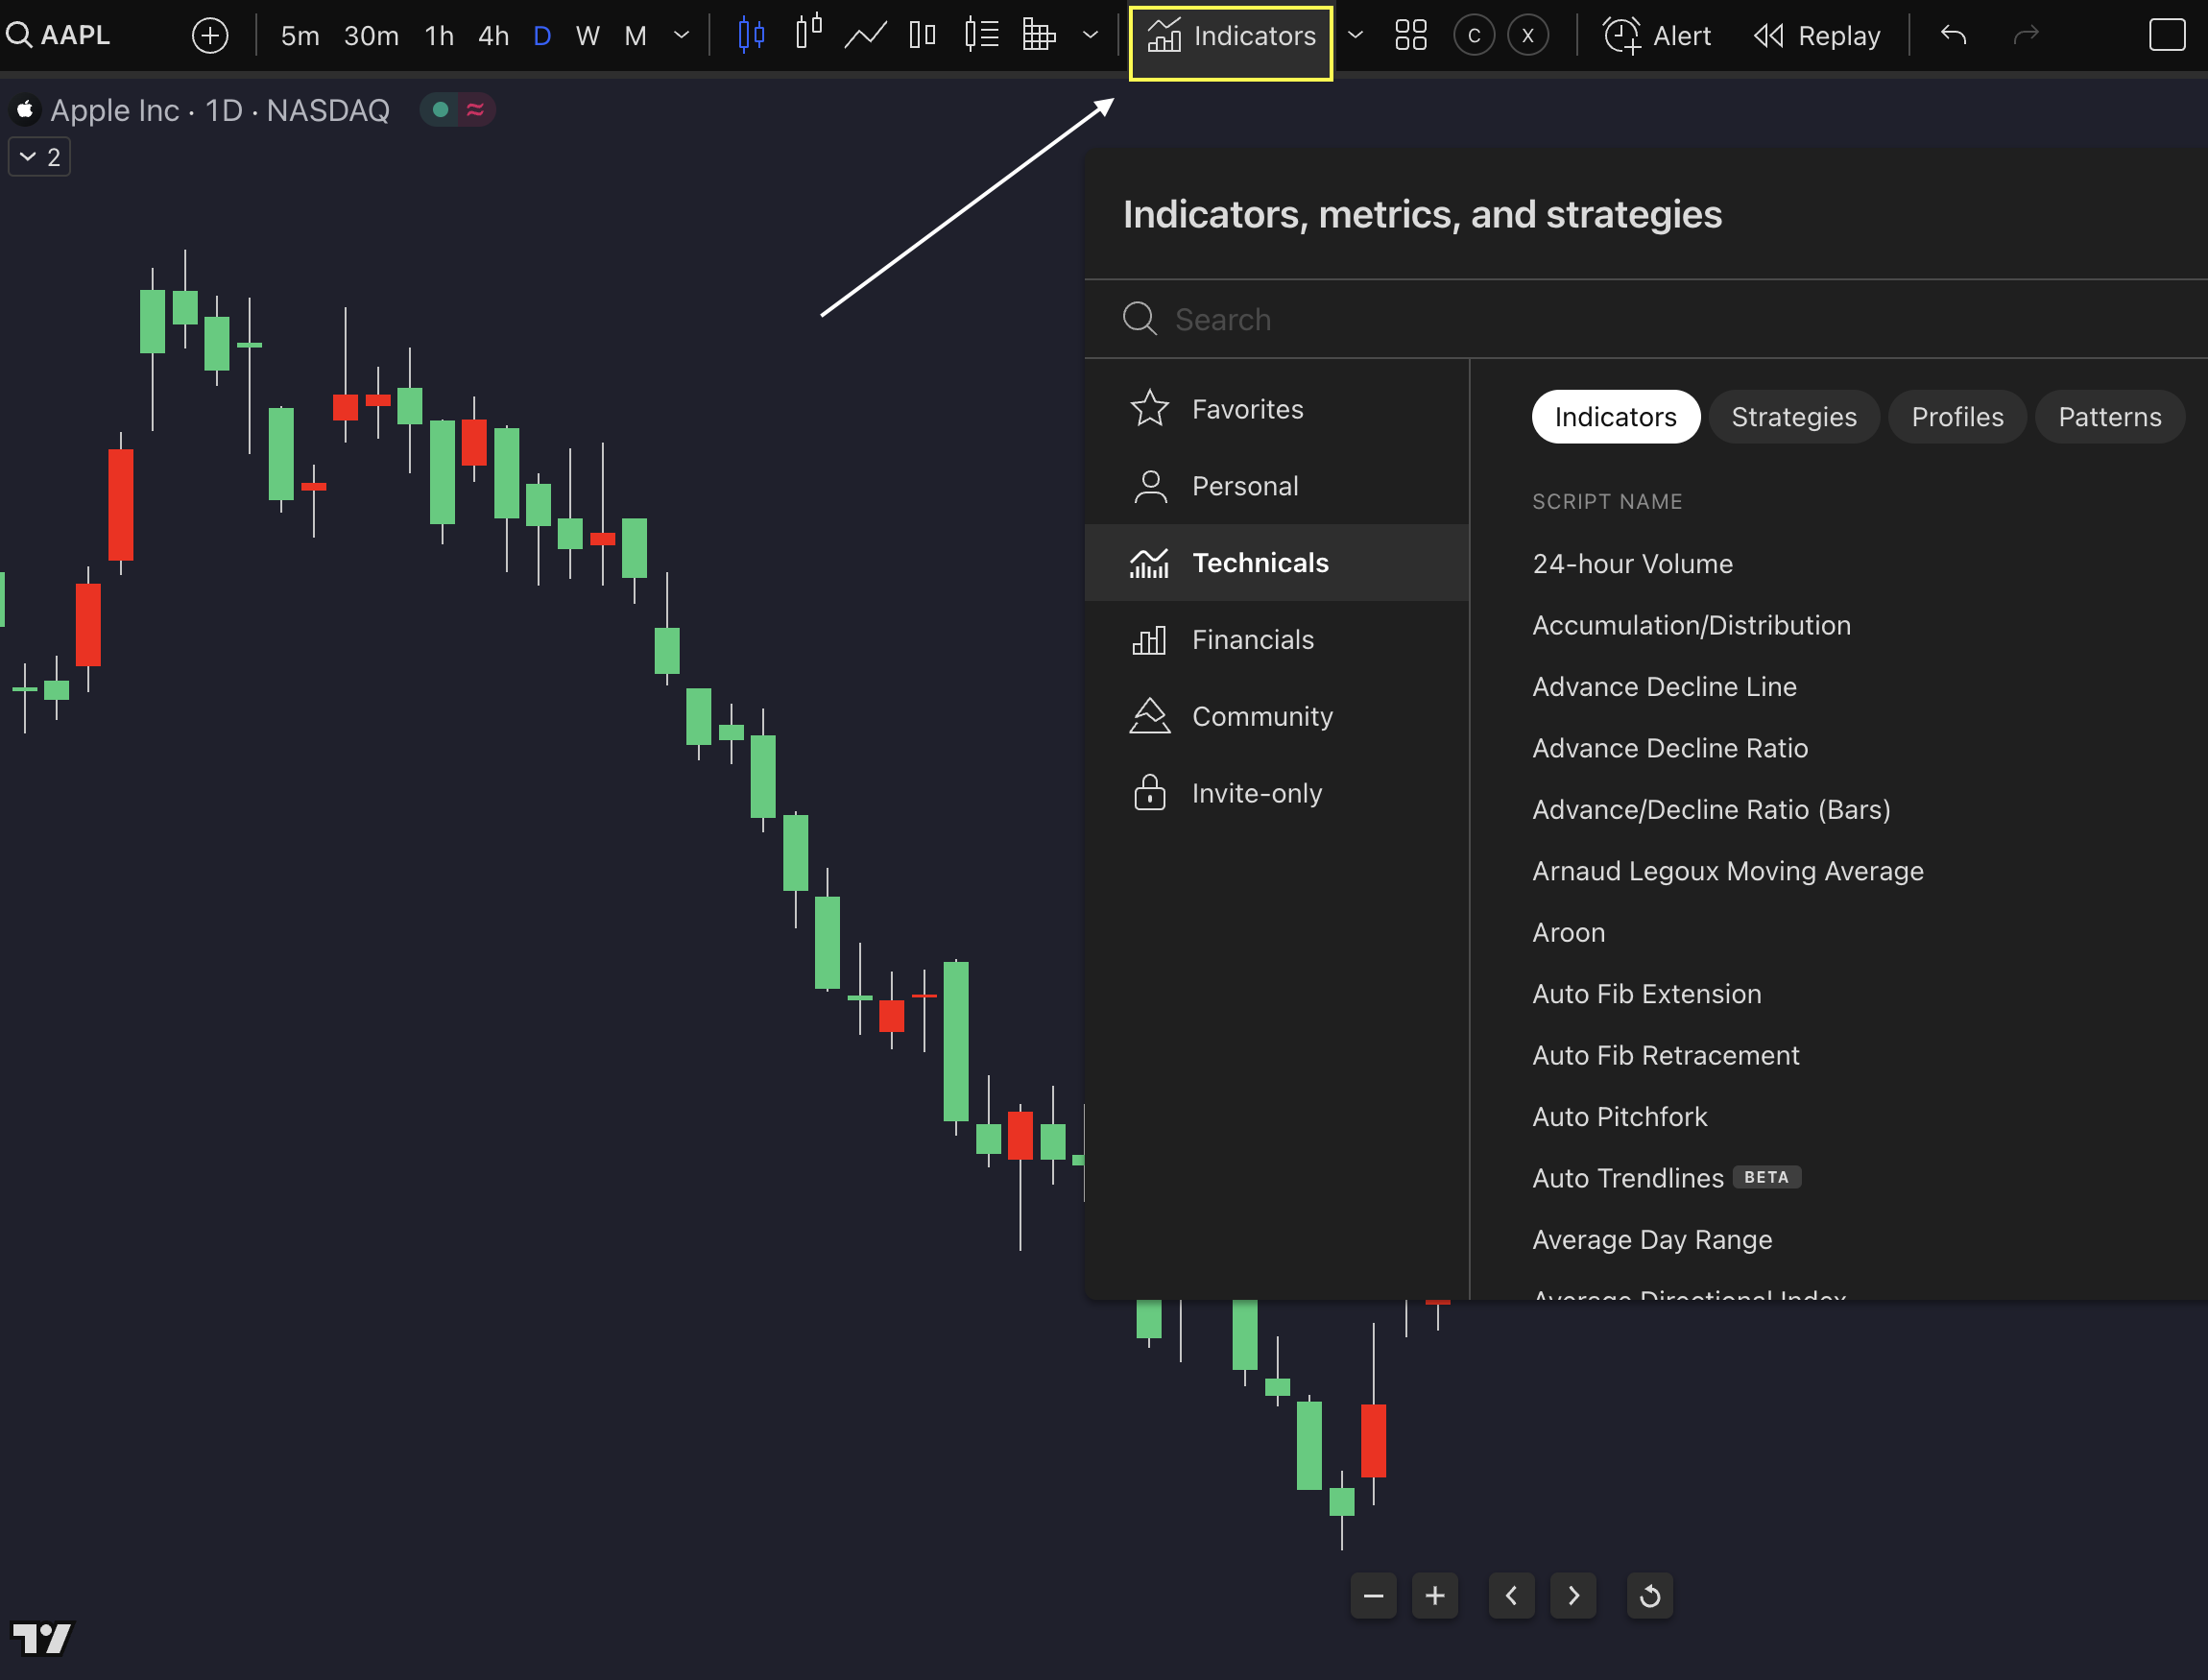
TradingView makes it easy to access custom indicators with its user-friendly interface. Look for the Indicators button in the toolbar at the top of your screen. To explore community-created options, click on Scripts. Additionally, there's a button at the bottom of the chart that lets you manage active indicators. From there, you can toggle visibility or adjust settings as needed [1].
Finding Specific Indicators
Use the platform's search tools to find indicators that align with your strategy:
| Search Option | What It Does |
|---|---|
| Search Bar | Enter keywords to find options |
| Category Browse | Explore by themes |
| Scripts | Discover top community picks |
| Invite-only | Access premium selections |
For example, searching "RSI" will show both standard and custom versions [2].
Adding Indicators to Your Chart
To place indicators on your chart:
- Click the Indicators button (either in the top toolbar or at the chart's base).
- Use the search bar or browse through categories to locate what you need.
- Double-click the indicator to add it.
- Adjust its settings to suit your preferences.
- Save your changes by clicking "OK" [1].
Once the indicator is added, you can fine-tune its parameters following the setup tips in Step 2.
Step 2: Setting Up Your Indicators
Once you've added your indicators (Step 1), it's time to fine-tune their settings for better performance. Here's how:
Adjusting Input Settings
You can tweak several key parameters to align with your trading strategy:
| Parameter Type | Description | Examples |
|---|---|---|
| Time Period | Number of bars used in calculations | 20-period MA |
| Price Source | Data point used for calculations | Close, High, Low, HL2 |
| Calculation Method | Mathematical approach | SMA, EMA, WMA |
| Threshold Levels | Signal boundaries | 70/30 for RSI |
Changes take effect immediately on your chart [1]. Adjust these settings based on your strategy and the current market conditions.
Customizing Display Settings
Make your indicators visually clear and easy to interpret by personalizing their appearance:
- Color Schemes: Assign unique colors to different components for quick recognition.
- Line Properties: Modify thickness, style (solid, dashed, dotted), and opacity to suit your preference.
- Plot Types: Choose how the data is displayed - lines, histograms, or columns.
- Scale Options: Decide whether to integrate the indicator with the price scale or display it in a separate pane [1].
For more complex setups, consider using multi-pane layouts. If you have an account with LuxAlgo, you can leverage the dynamic coloring and gradient features available in their exclusive toolkits to enhance your analysis.
This configuration process sets the stage for implementing the multi-indicator strategies covered in Step 3.
Step 3: Working with Multiple Indicators
Multi-Indicator Charts
Once you've set up individual indicators (Step 2), you can combine them strategically. Here's a quick guide to indicator placement:
| Placement Type | Best For | Example Indicators |
|---|---|---|
| Price Overlay | Trend & Price Action | Moving Averages, Bollinger Bands |
| Separate Pane | Momentum & Volume | RSI, MACD, Volume Profile |
| Secondary Overlay | Confirmation Signals | Parabolic SAR, Support/Resistance |
Tip: If you're using multiple indicators, adjust their opacity. This keeps your primary signals clear while secondary indicators remain visible but less distracting.
Creating Alert Systems
Multi-indicator alerts can help you identify complex trading scenarios more effectively. TradingView's alert system lets you combine conditions from different indicators for precise notifications:
- Basic Alert Setup: Open the Alerts panel, click "Create Alert", and set your "Condition" for the alert.
- Advanced Conditions: Combine multiple indicator signals using logic. For example:
- RSI crosses above 70
- Volume doubles the average
- Price breaks above a custom moving average
If you're utilizing LuxAlgo's exclusive features, pre-built alert templates are available to streamline the setup, reducing the need for manual scripting.
- Managing Alerts:
- Use clear, descriptive names for your alerts.
- Limit notifications to trigger 'Once Per Bar' to avoid overload.
- Set expiration dates to keep your system organized.
Standard vs. Custom Indicators
Knowing the difference between standard and custom indicators can improve your chart analysis:
| Feature | Standard Indicators | Custom Indicators |
|---|---|---|
| Flexibility | Fixed calculations | Fully customizable |
| Performance | Fast and optimized | Can slow charts down |
| Updates | Automatically maintained | Requires manual updates |
| Reliability | Thoroughly tested | Quality depends on the source |
| Learning Curve | Easy to use | May require Pine Script skills |
LuxAlgo indicators are optimized for multi-indicator setups, ensuring smoother performance. For custom scripts, use Pine Script features like var caching, max_bars_back limits, and efficient data handling to keep your charts running efficiently.
Step 4: Using LuxAlgo Exclusive Toolkits
LuxAlgo offers traders advanced custom indicators and exclusive toolkits that integrate seamlessly with TradingView, delivering a refined trading experience.
LuxAlgo Platform Overview
LuxAlgo’s exclusive toolkits on TradingView are built around three main components:
| Component | Purpose |
|---|---|
| Price Action Concepts (PAC) | Detects patterns |
| Signals & Overlays (S&O) | Supports technical analysis |
| Oscillator Matrix (OSC) | Analyzes momentum |
After activating your LuxAlgo account, these exclusive toolkits will become available in the TradingView menu. They enhance TradingView's existing features while maintaining its familiar workflow.
How to Set Up LuxAlgo Toolkits
-
Price Action Concepts (PAC):
- Adjust detection sensitivity for patterns.
- Align color schemes with your chart's style.
- Use alongside moving averages for added confirmation.
-
Signals & Overlays (S&O):
- Apply transparent overlays for better visualization.
- Configure alerts across multiple timeframes.
-
Oscillator Matrix (OSC):
- Set thresholds for divergence detection.
- Personalize overbought and oversold levels.
Testing Strategies with LuxAlgo AI Backtesting
LuxAlgo also includes an AI Backtesting platform to help refine your trading strategies:
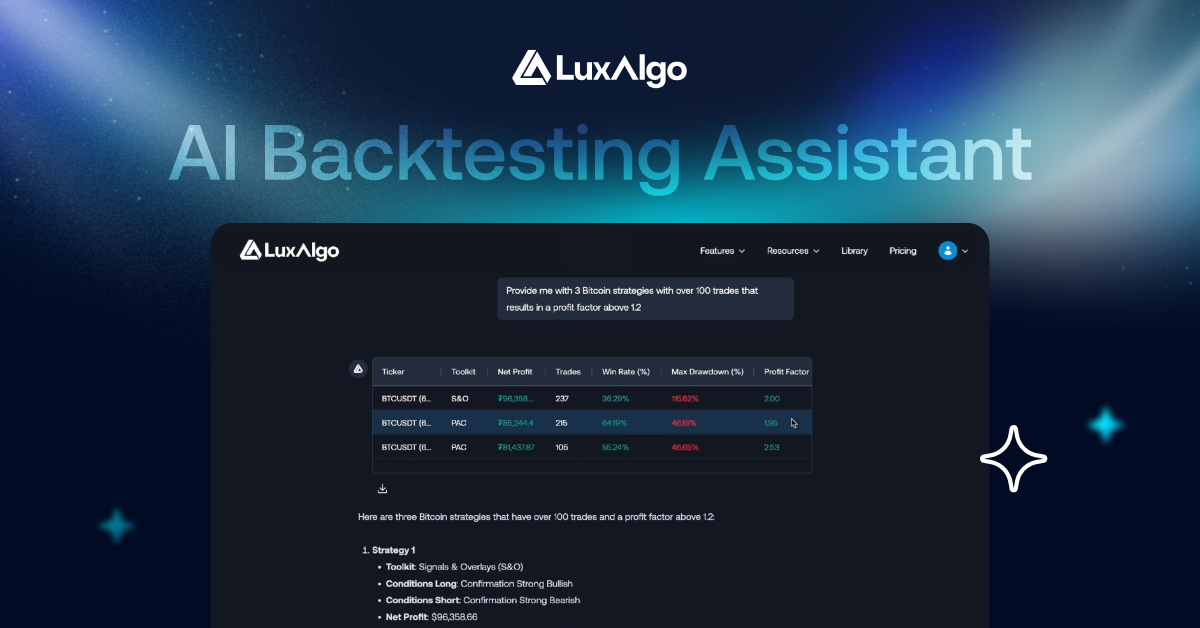
| Feature | Use Case |
|---|---|
| Strategy Tester | Test combinations in different markets. |
| Optimization Engine | Automatically adjust indicator settings. |
| Multi-Asset Testing | Validate strategies across multiple assets simultaneously. |
For best results, start by testing strategies on individual assets to identify what works effectively before expanding to broader applications.
Conclusion: Next Steps with Custom Indicators
Now that you've gone through the steps of setting up, configuring, and integrating custom indicators, it’s time to fine-tune your strategy for better results.
Key Takeaways
Custom indicators allow for more personalized and effective analysis when implemented with a clear plan:
| Implementation Phase | Key Focus Areas |
|---|---|
| Initial Setup | Navigating the platform, selecting indicators |
| Configuration | Adjusting input settings, aligning timeframes, tweaking visuals |
| Advanced Usage | Combining multiple indicators, setting up alerts |
| Integration | Using LuxAlgo exclusive solutions and AI-driven features |
Starting Off on the Right Foot
If you're just diving in, begin by mastering one indicator before layering on complexity. Here’s how to set yourself up for success:
- Pick Indicators Strategically: Focus on 3-5 indicators that offer distinct insights instead of overlapping information.
- Test Combinations: Use historical data to see how different setups perform under varying market conditions.
- Engage with the Community: Connect with TradingView’s active user base to exchange ideas and refine your strategies.