
Learn how to identify and prevent costly bull and bear traps in trading by using technical analysis and understanding market psychology.
Bull and bear traps can lead to costly mistakes if you're not careful. These traps occur when price movements trick traders into making the wrong decisions – buying during a false breakout (bull trap) or selling during a false breakdown (bear trap). Here's how to spot and avoid them:
-
Key Indicators to Watch:
- Volume Analysis: Low breakout volume often signals a bull trap, while low breakdown volume suggests a bear trap.
- Momentum Divergence: Use RSI or MACD to identify discrepancies between price and momentum.
- Support and Resistance Levels: Failed breaks above resistance or below support are red flags.
-
Common Patterns:
- Bull Traps: Rising wedge, failed cup and handle patterns.
- Bear Traps: Falling wedge, failed head and shoulders patterns.
- Psychological Triggers: FOMO, confirmation bias, and herd mentality often fuel these traps.
-
Prevention Tips:
- Use stop-losses based on ATR.
- Confirm breakouts with strong volume and aligned momentum.
- Leverage tools like OBV, VWAP, and multi-timeframe analysis.
Understanding these traps and combining technical tools with psychological awareness can help protect your trades and improve decision-making.
What Is A Bull Or Bear Trap & How To Identify Them
Common Signs of Bull and Bear Traps
Spotting trading traps early can save you from expensive errors. Let’s break down the key traits of bull and bear traps and the psychological forces that fuel these misleading market moves.
Bull vs Bear Trap Features
Bull and bear traps differ in how they form and the signals they give. Here's a quick side-by-side comparison:
| Characteristic | Bull Trap | Bear Trap |
|---|---|---|
| Market Context | Found in downtrends or sideways markets | Found in uptrends or sideways markets |
| Chart Patterns | Rising wedge, failed cup and handle | Falling wedge, failed head and shoulders |
| Warning Sign | Price fails to stay above resistance | Price fails to stay below support |
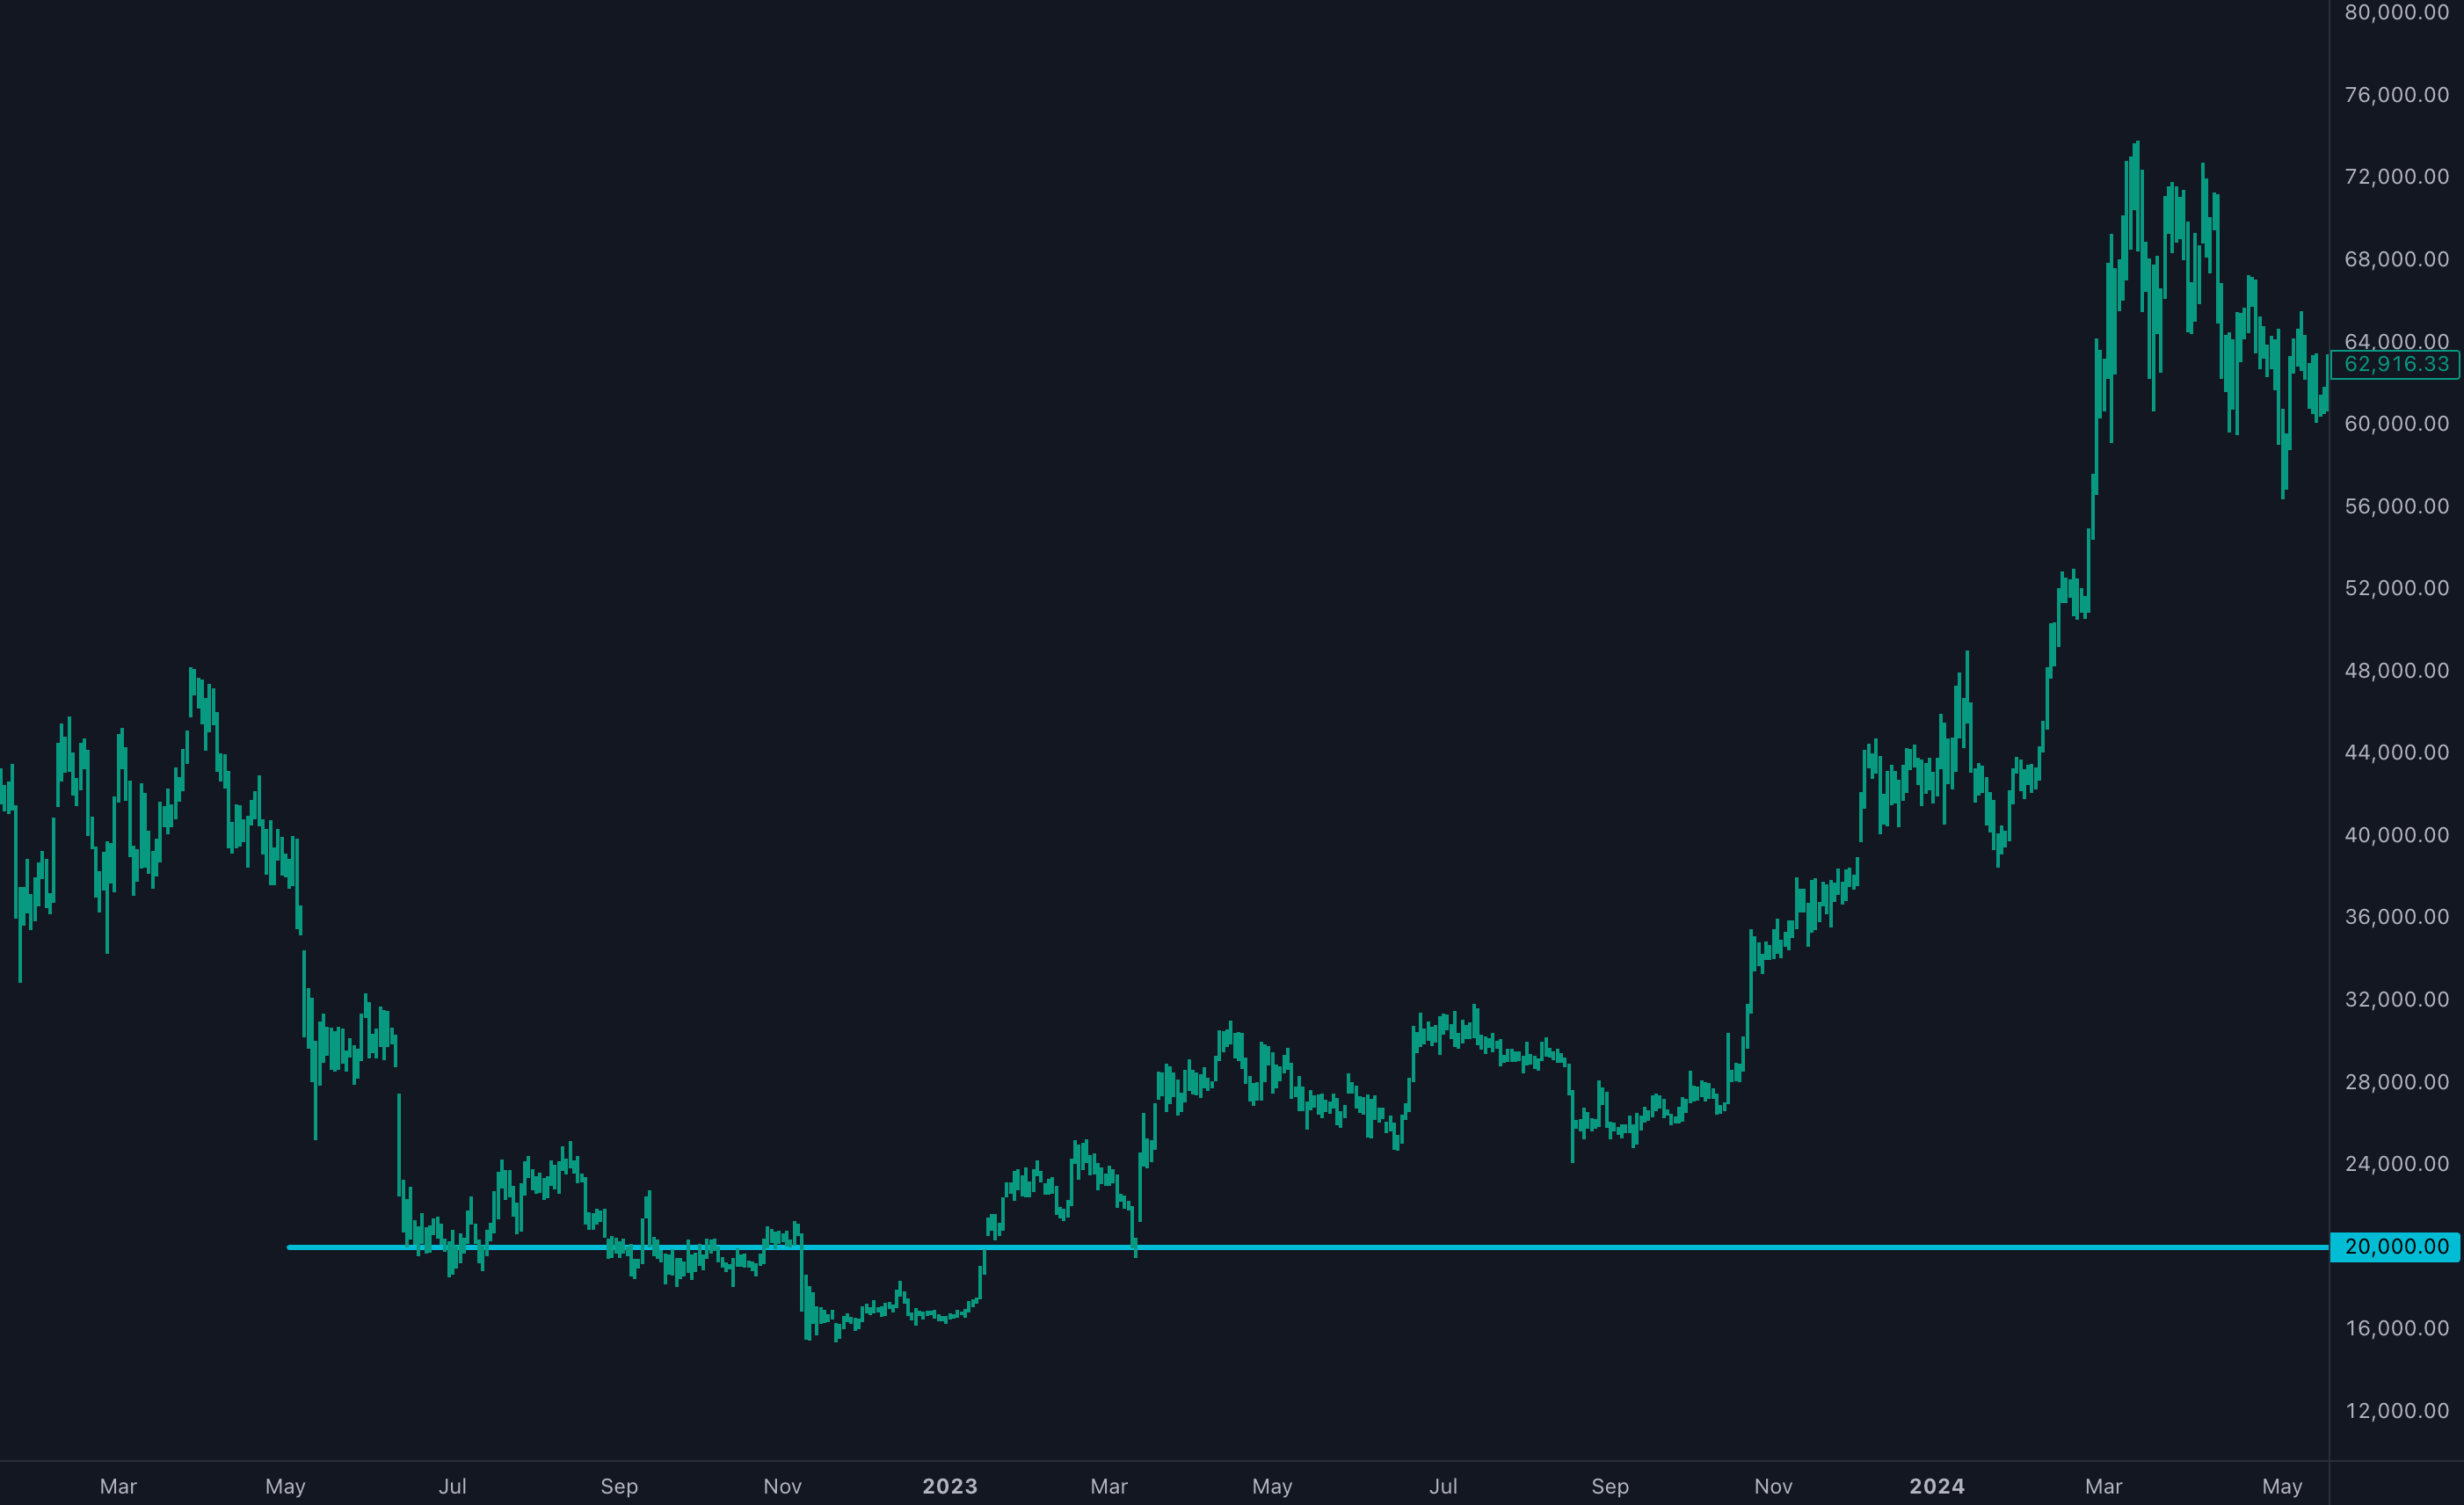
A real-world example: In June 2022, Bitcoin's bear trap briefly dipped below $20,000 before bouncing back to $21,000. This reversal wiped out over $280 million in short positions.
Market Psychology in False Breakouts
These traps are rooted in market psychology and group behavior. Recognizing the emotional triggers behind them can help you trade more cautiously.
- Fear of Missing Out (FOMO): Traders often jump into breakout trades without waiting for confirmation. In bull traps, this leads to impulsive buying, while bear traps take advantage of panic selling.
- Confirmation Bias: Many traders see what they want to see. For example, bullish traders might ignore declining volume during a breakout, focusing only on rising prices.
- Herd Mentality: When everyone starts following the crowd, it can lead to rapid sell-offs or buy-ins. This collective behavior fuels volatility, sharp price moves, and reactions driven by panic.
To steer clear of these traps, keep an eye on volume and technical indicators. Real breakouts typically show increasing volume and aligned momentum. On the other hand, traps often feature diverging volume, weakening momentum, failure to hold key price levels, and noticeable RSI divergences.
Pairing psychological awareness with technical tools like volume analysis can help you build a stronger trading strategy – a topic we’ll dive into further in the next section.
Tools for Spotting Trading Traps
After understanding the psychological factors at play, these technical tools can help you confirm and avoid trading traps:
Volume Analysis Methods
Volume is a key indicator when assessing the strength of a breakout. Here are two essential tools:
- On-Balance Volume (OBV): This measures cumulative buying and selling pressure by adding volume on up days and subtracting it on down days. If the price is climbing but OBV is trending downward, it may signal a potential bull trap [2].
- Volume Weighted Average Price (VWAP): VWAP helps compare price action to average trading volume. If the price breaks above resistance but remains below VWAP, it often suggests weakness and a possible trap [6].
Price and Momentum Divergence
Momentum indicators can expose weaknesses in price movements that aren't immediately visible. Two important tools for this are:
-
MACD Divergence:
- Bearish divergence (possible bull trap): Price reaches higher highs, but the MACD shows lower highs.
- Bullish divergence (possible bear trap): Price forms lower lows, but the MACD shows higher lows [6].
- RSI Divergence: When the price and RSI move in opposite directions, it often signals a reversal. For example, bearish divergence happens when the price hits new highs, but RSI doesn't confirm them.
Support and Resistance Analysis
Analyzing price levels can provide critical insights into potential traps. Here's a quick breakdown:
| Level Type | Description | Trap Warning Signs |
|---|---|---|
| Historical Price | Previous major highs/lows | Weak volume on a failed breakout |
| Moving Averages | 50-day and 200-day EMAs | Struggles to hold above or below levels |
To make the most of support and resistance analysis:
- Focus on clear breaks accompanied by strong volume.
- Pay attention to how the price behaves during retests of broken levels.
4 Ways to Prevent Trap Losses
Once you've identified trap signals using technical tools, here are four methods to help you avoid losses:
Stop-Loss Placement Rules
When trading breakouts, follow these guidelines:
1. ATR-Based Stops: Set your stop-loss at 2-3 times the Average True Range (ATR) from your entry point [1].
2. Time-Based Exit Strategy: If the price doesn’t move at least one ATR within three candles, consider closing the position. This can help you avoid decisions driven by fear of missing out (FOMO) [2].
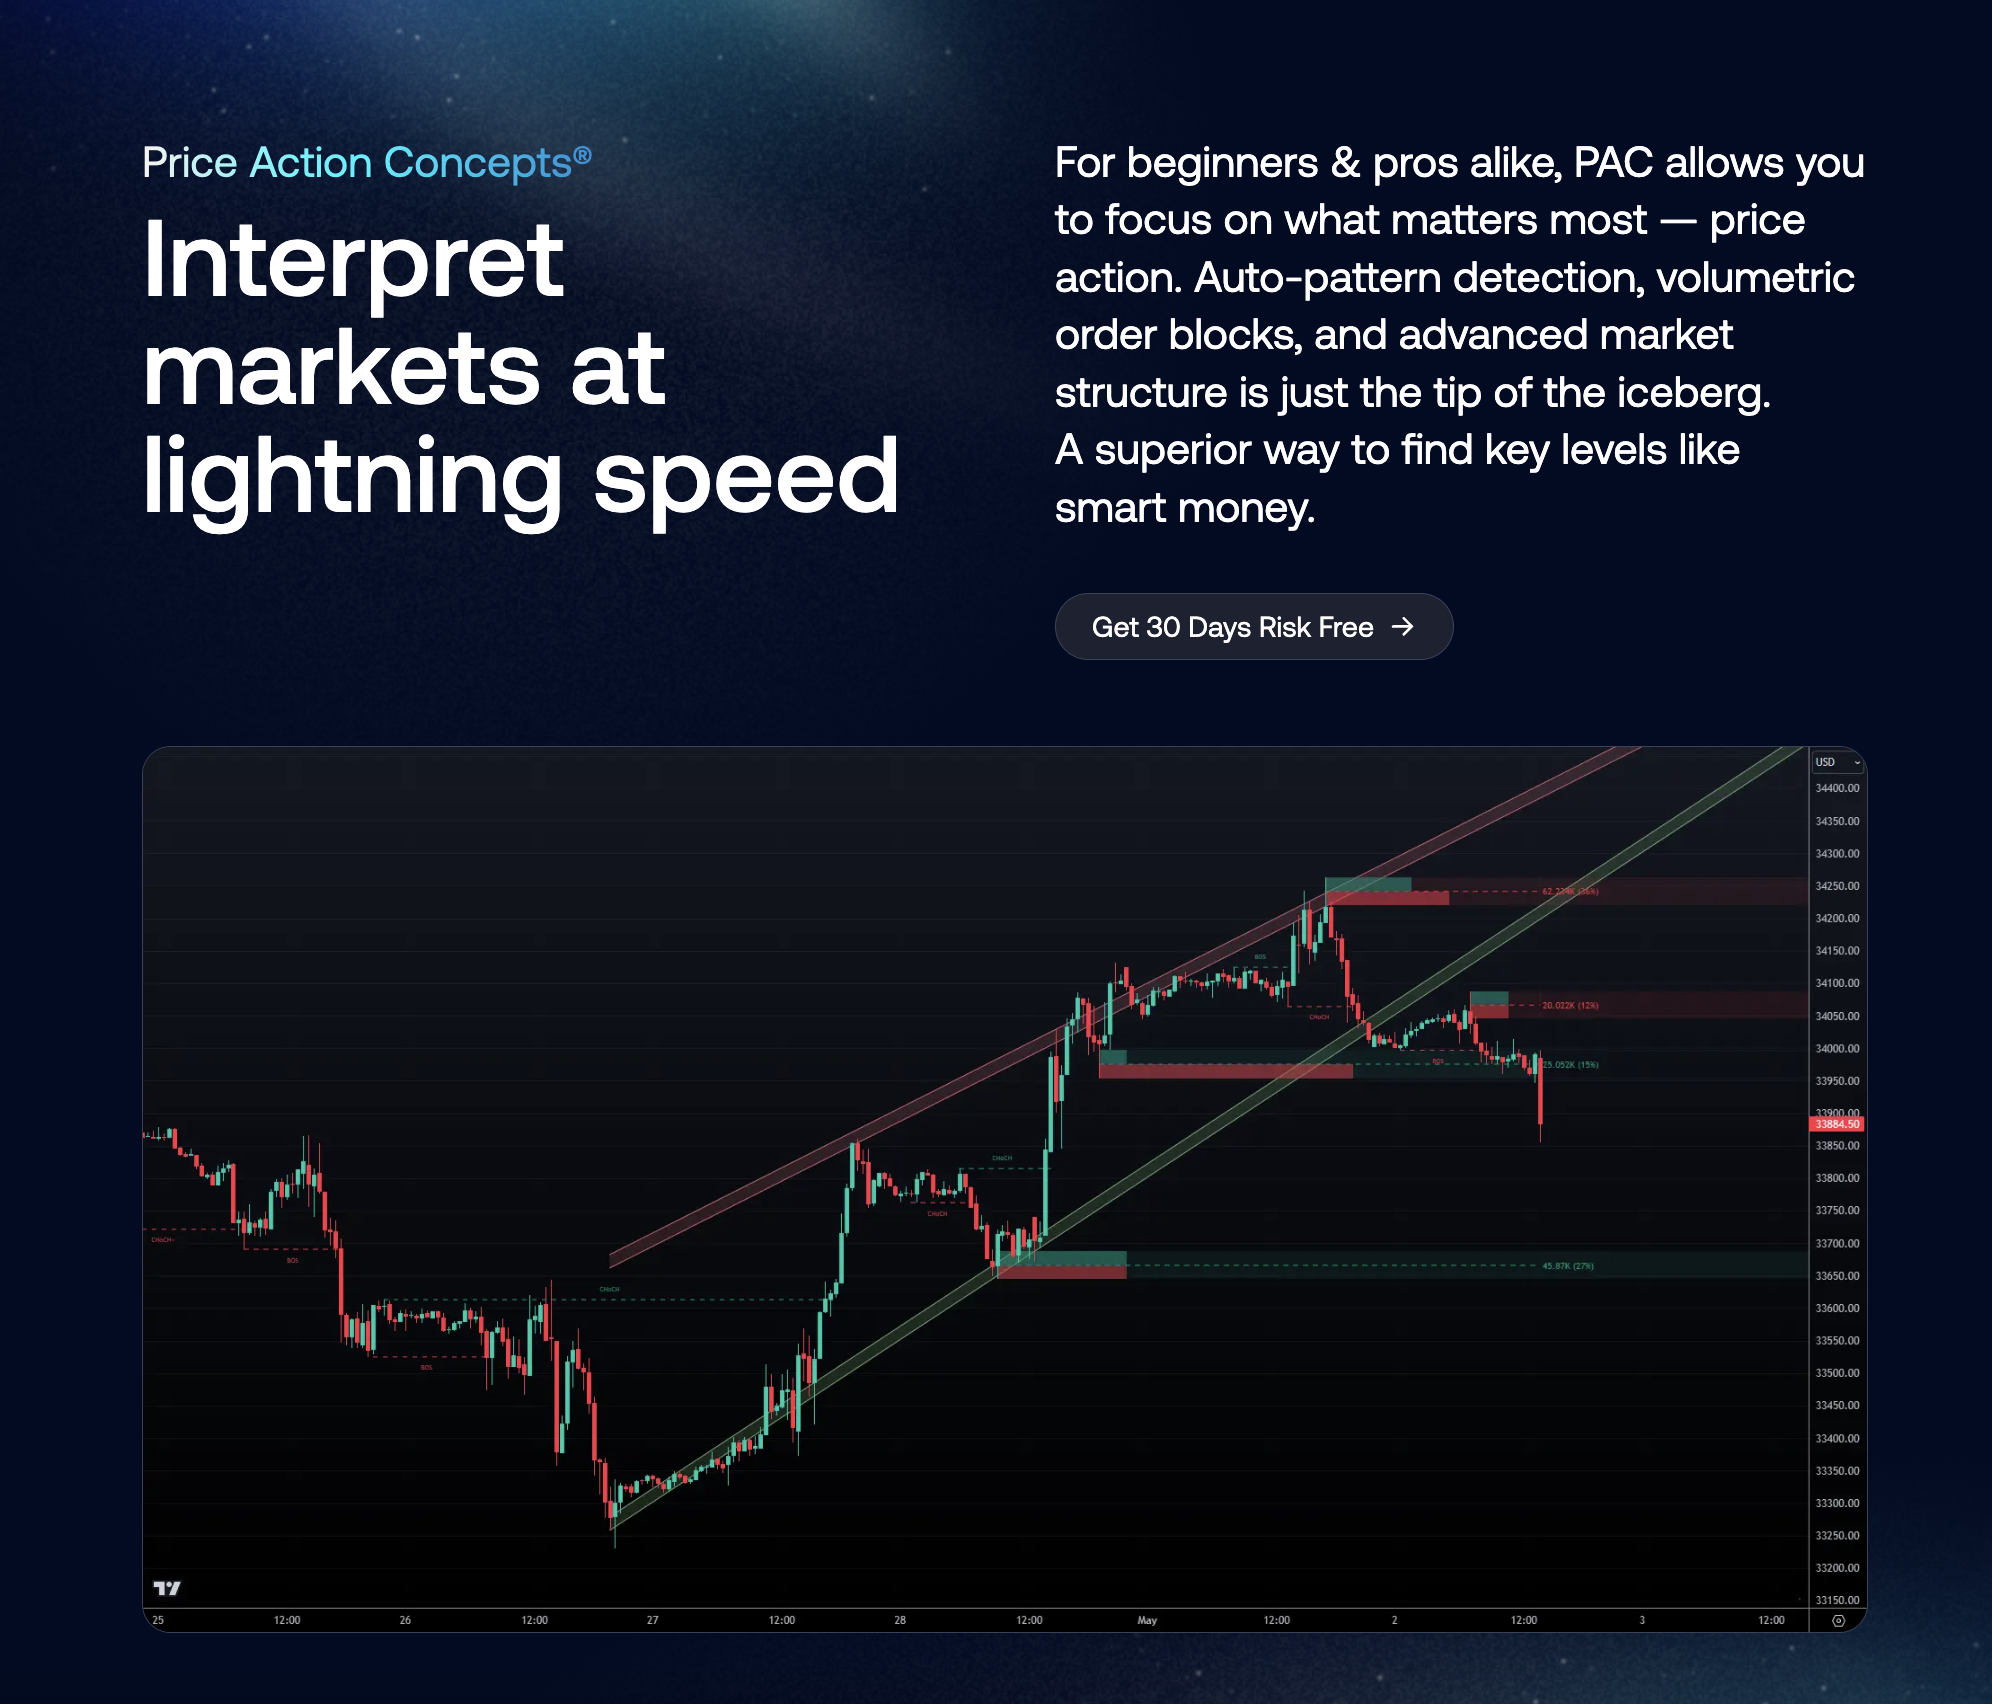
Trading Tools and Alerts
The LuxAlgo Price Action Concepts (PAC) toolkit offers advanced features to detect traps:
| Feature | How It Helps | Key Warning Signs |
|---|---|---|
| Channel Analysis | Evaluates trend strength | Quick reversals after channel breaks |
| Volume Confirmation | Confirms breakout momentum | Low volume during price breaks |
| Multi-timeframe Signals | Checks trend alignment | Conflicting signals across timeframes |
These tools can help you spot potential pitfalls before they impact your trades.
AI Strategy Testing
LuxAlgo's AI Backtesting Assistant is a powerful resource for analyzing past performance and refining your approach. With this platform, you can:

- Test your strategies under different market conditions.
- Adjust stop-loss levels using historical data insights.
- Pinpoint patterns that confirm reliable breakouts.
The AI Backtesting Assistant simplifies the process of generating and testing trading strategies by leveraging historical data and advanced analytics. It uses AI to optimize strategy parameters and provide actionable insights, streamlining the strategy creation process for traders.
Conclusion: Key Points for Trap Prevention
To avoid common trading traps, it’s essential to combine technical tools with an understanding of psychological influences. Here are the main takeaways:
Volume analysis is key. Research indicates that 60% of breakouts in the S&P 500 from 2013 to 2023 produced false signals [4]. This makes confirming trades with volume data a must.
Cross-check signals with multiple tools:
| Tool Type | Key Indicators | Warning Signs |
|---|---|---|
| Momentum | RSI, MACD | Divergence between price and momentum [2] |
| Price Action | Candlestick patterns | Weak patterns following breakouts [5] |
| Volume | Unusual volume spikes, Low volume pullbacks | Sudden spikes at reversal points [2] |
Stay emotionally grounded. Using predefined trading plans and stress management techniques can help you avoid FOMO and herd behavior traps, keeping your decisions rational even during market turbulence [3].
FAQs
How do you identify a bear trap?
Bear traps can often be identified using volume analysis and other technical tools. Here's how you can spot them:
- Volume analysis: Look for a breakdown below support on low volume, followed by a high-volume reversal. A noticeable volume spike during the recovery phase is another clue.
- Technical confirmation: Watch for signs like the price reclaiming support within 1-3 candles, bullish divergence on indicators like RSI or MACD, or bullish candlestick patterns (such as hammers or engulfing patterns) forming near support levels.
- Multi-timeframe checks: Check for consistency across daily and weekly charts. Align volume patterns and momentum indicators across multiple timeframes to validate the setup.
Patience is key. Bear traps often reverse quickly – 78% of them turn around within 48 hours if there's a volume spike during the recovery phase [2][3]. Always confirm with multiple indicators before making decisions.