Learn how to create effective stock trading strategies using technical analysis, key indicators, and risk management techniques.
Want to trade stocks successfully? Start with a solid strategy. Here's what you need to know:
- Focus on Technical Analysis: Use price, volume, and trends to make decisions instead of relying on emotions or tips.
- Choose Key Indicators: Combine trend indicators (like EMA), momentum tools (like RSI), and volume measures (like OBV) for clearer signals.
- Set Clear Rules: Define when to buy, sell, and manage risk. For example, buy when the price crosses above the 50-day EMA with MACD confirmation.
- Test Your Strategy: Backtest with historical data to refine performance metrics like win rate and drawdown.
- Use Advanced Features: Platforms like LuxAlgo provide hundreds of free trading indicators, exclusive screeners and backtesters on TradingView, and an AI Backtesting Assistant to streamline strategy creation.
- Risk Management is Crucial: Limit losses with stop-loss orders, position sizing, and favorable risk-reward ratios.
Starting with Technical Analysis
Technical analysis focuses on studying past price movements and market behavior to make trading decisions. Unlike fundamental analysis, which examines a company's financial health, this approach relies on price and volume data to anticipate market trends.
What Is Technical Analysis?
Technical analysis involves analyzing historical price and volume patterns to understand market behavior. The idea is simple: prices often follow recurring patterns. By examining these patterns, traders aim to identify trends and shifts before they become widely recognized.
Types of Technical Indicators
Traders use various technical indicators to interpret market data. These indicators fall into two main categories:
| Indicator Type | Purpose | Examples | Ideal For |
|---|---|---|---|
| Overlays | Plotted directly on price charts | Moving Averages, Bollinger Bands | Identifying trends, Support/Resistance levels |
| Oscillators | Placed above or below price charts | RSI, MACD | Measuring momentum, Overbought/Oversold conditions |
Overlays help traders pinpoint the direction of a trend, while oscillators evaluate its strength and signal potential reversals.
How Traders Use Technical Analysis
Traders use technical analysis to make informed decisions by combining different indicators. Here's how:
- Identifying Trends: Tools like moving averages and trend lines reveal the market's overall direction.
- Finding Entry Points: Indicators work together to highlight the best times to enter trades.
- Managing Risk: Support and resistance zones help set stop-loss levels to limit losses.
- Timing Exits: Momentum indicators guide traders on when to lock in profits.
Platforms like LuxAlgo on TradingView streamline this process by providing hundreds of free trading indicators, exclusive screeners and backtesters, and an AI Backtesting Assistant that delivers sophisticated insights. The key to success lies in using a small set of indicators effectively, avoiding unnecessary complexity.
Understanding these basics prepares you to choose the right tools and build a strategy tailored to your trading goals.
Choosing the Right Indicators for Stock Trading
Picking the right technical indicators is key to crafting a solid stock trading strategy. Instead of overloading yourself with too many tools, focus on a few that work well together and give clear signals.
Trend Indicators: Moving Averages
Moving averages help identify market trends. There are two main types:
- Simple Moving Averages (SMAs): These give equal weight to all data points, making them ideal for spotting long-term trends.
- Exponential Moving Averages (EMAs): These emphasize recent prices, making them more effective for short-term trends.
A common strategy is to watch for the 20-day EMA crossing above the 50-day EMA, which can signal a potential buy opportunity. Using these together helps highlight trend shifts while minimizing market noise.
Momentum Indicators: RSI and MACD
Momentum indicators track the speed and magnitude of price changes, helping traders spot potential reversals. Two popular tools in this category are the RSI and MACD.
-
Relative Strength Index (RSI):
- Measures on a scale from 0 to 100.
- Over 70 suggests the stock might be overbought.
- Under 30 indicates it could be oversold.
-
Moving Average Convergence Divergence (MACD):
- Highlights momentum shifts through moving averages.
- Signal line crossovers point to trend changes.
- The histogram shows the strength of momentum.
Using RSI and MACD together provides a clearer picture of price momentum and potential reversals.
Volume Indicators: OBV and Accumulation/Distribution
Volume indicators confirm price movements and help validate trading signals. Two commonly used tools are OBV and Accumulation/Distribution.
-
On-Balance Volume (OBV):
- Rises during upward trends and falls during downward trends.
- Confirms whether price movements are supported by volume.
-
Accumulation/Distribution:
- Compares closing prices to daily ranges.
- Indicates whether money is flowing into or out of a stock.
- Divergences between this indicator and price movements may signal a trend reversal.
For a balanced analysis, combine a trend indicator like the EMA, a momentum oscillator like RSI, and a volume indicator like OBV. This approach avoids overlapping signals and provides a clearer trading picture. Platforms like LuxAlgo further simplify the process by delivering advanced insights through its AI Backtesting Assistant.
Once you've chosen your indicators, the next step is to integrate them into a strategy with clear entry and exit rules.
Step-by-Step Guide to Creating a Trading Strategy
Developing a trading strategy involves planning and following a structured process. Here's how to create a practical approach to stock trading.
Define Trading Goals and Risk Limits
Start by setting clear goals for your trading strategy. For example, you might aim for a 10% monthly return while capping losses at 5% of your portfolio.
Here are some factors to consider when outlining your trading limits:
- Maximum drawdown you’re willing to accept
- Time you can dedicate to trading
- Typical holding periods for your trades
- Account size and limits on position sizing
These guidelines help you stick to a disciplined approach that aligns with your objectives.
Pick and Combine Indicators
Use a mix of indicators to align trend, momentum, and volume signals for better trade setups.
| Strategy Type | Primary Indicator | Confirmation Indicator |
|---|---|---|
| Trend Following | 50-day EMA | MACD |
| Mean Reversion | RSI (30/70) | Stochastic Oscillator |
| Breakout | Price Channels | Momentum Indicator |
Once you’ve chosen your indicators, define specific rules for entering and exiting trades.
Set Entry and Exit Rules
Detailed entry and exit rules take emotions out of decision-making. Keep your rules clear and repeatable.
For example, in a trend-following strategy:
- Entry: Buy when the price crosses above the 50-day EMA with MACD confirmation.
- Exit: Sell if the price drops 5% below entry or if MACD shows weakening momentum.
- Position Sizing: Limit each trade to 2% of your total portfolio.
Having these rules in place ensures consistency and reduces guesswork during trades.
Test Your Strategy with Historical Data
Backtesting helps you gauge your strategy's performance before putting money on the line. LuxAlgo provides insights by simulating your strategy across various market scenarios through its AI Backtesting Assistant.
Focus on these metrics during testing:
- Win rate percentage
- Average profit per trade
- Maximum drawdown
Testing allows you to refine your strategy and prepare it for live trading.
sbb-itb-cf0ed88
Improving and Fine-Tuning Your Strategy
Adjust Indicator Settings
Fine-tune your indicator settings to align with current market conditions. Making small, purposeful changes keeps your strategy straightforward and avoids unnecessary complexity.
| Market Condition | Indicator Adjustment | Expected Outcome |
|---|---|---|
| High Volatility | Increase MA period (e.g., 20 to 50) | Minimizes false signals |
| Strong Trend | Lower RSI levels (e.g., 25/75) | Captures trend entries earlier |
| Choppy Markets | Expand Bollinger Bands (e.g., 2.5 SD) | Reduces false breakouts |
Test on Different Timeframes
A trading strategy's performance can vary across timeframes. Begin with your preferred timeframe, then test it on shorter and longer intervals to identify the ideal fit.
When choosing timeframes, consider your trading style, the liquidity of the asset, and how volatile the market session is. Testing across different timeframes provides a broader understanding of your strategy's effectiveness, complementing your initial backtesting results.
LuxAlgo’s backtesting features allow you to analyze your strategy's performance across multiple timeframes simultaneously, streamlining the optimization process. Once you've refined your approach, the next step is to safeguard your capital through effective risk management.
Use Risk Management Tools
Protecting your capital is key to long-term trading success. Use these risk management tools:
- Position Sizing: Determine position sizes based on a set percentage of your account's risk. For example, risking 1% of a $50,000 account means your maximum loss per trade would be $500.
- Stop-Loss Placement: Place stop-loss orders at logical technical levels, factoring in volatility with tools like the Average True Range (ATR) indicator.
- Risk-Reward Ratios: Stick to a favorable risk-reward ratio, such as 1:2, to ensure profitability over time.
Using Advanced Tools to Build Strategies
After honing your strategy with standard methods, advanced features can elevate your trading game. Modern trading platforms now make detailed analysis available to individual traders, changing how strategies are developed and executed.
Advanced Trading Features
LuxAlgo provides advanced technical analysis features on TradingView, including hundreds of free trading indicators, exclusive screeners and backtesters, and an AI Backtesting Assistant that leverages AI-driven insights for effective strategy development.
AI-Powered Strategy Testing
The AI Backtesting Assistant from LuxAlgo accelerates strategy development by simultaneously testing various indicator settings, providing traders with:
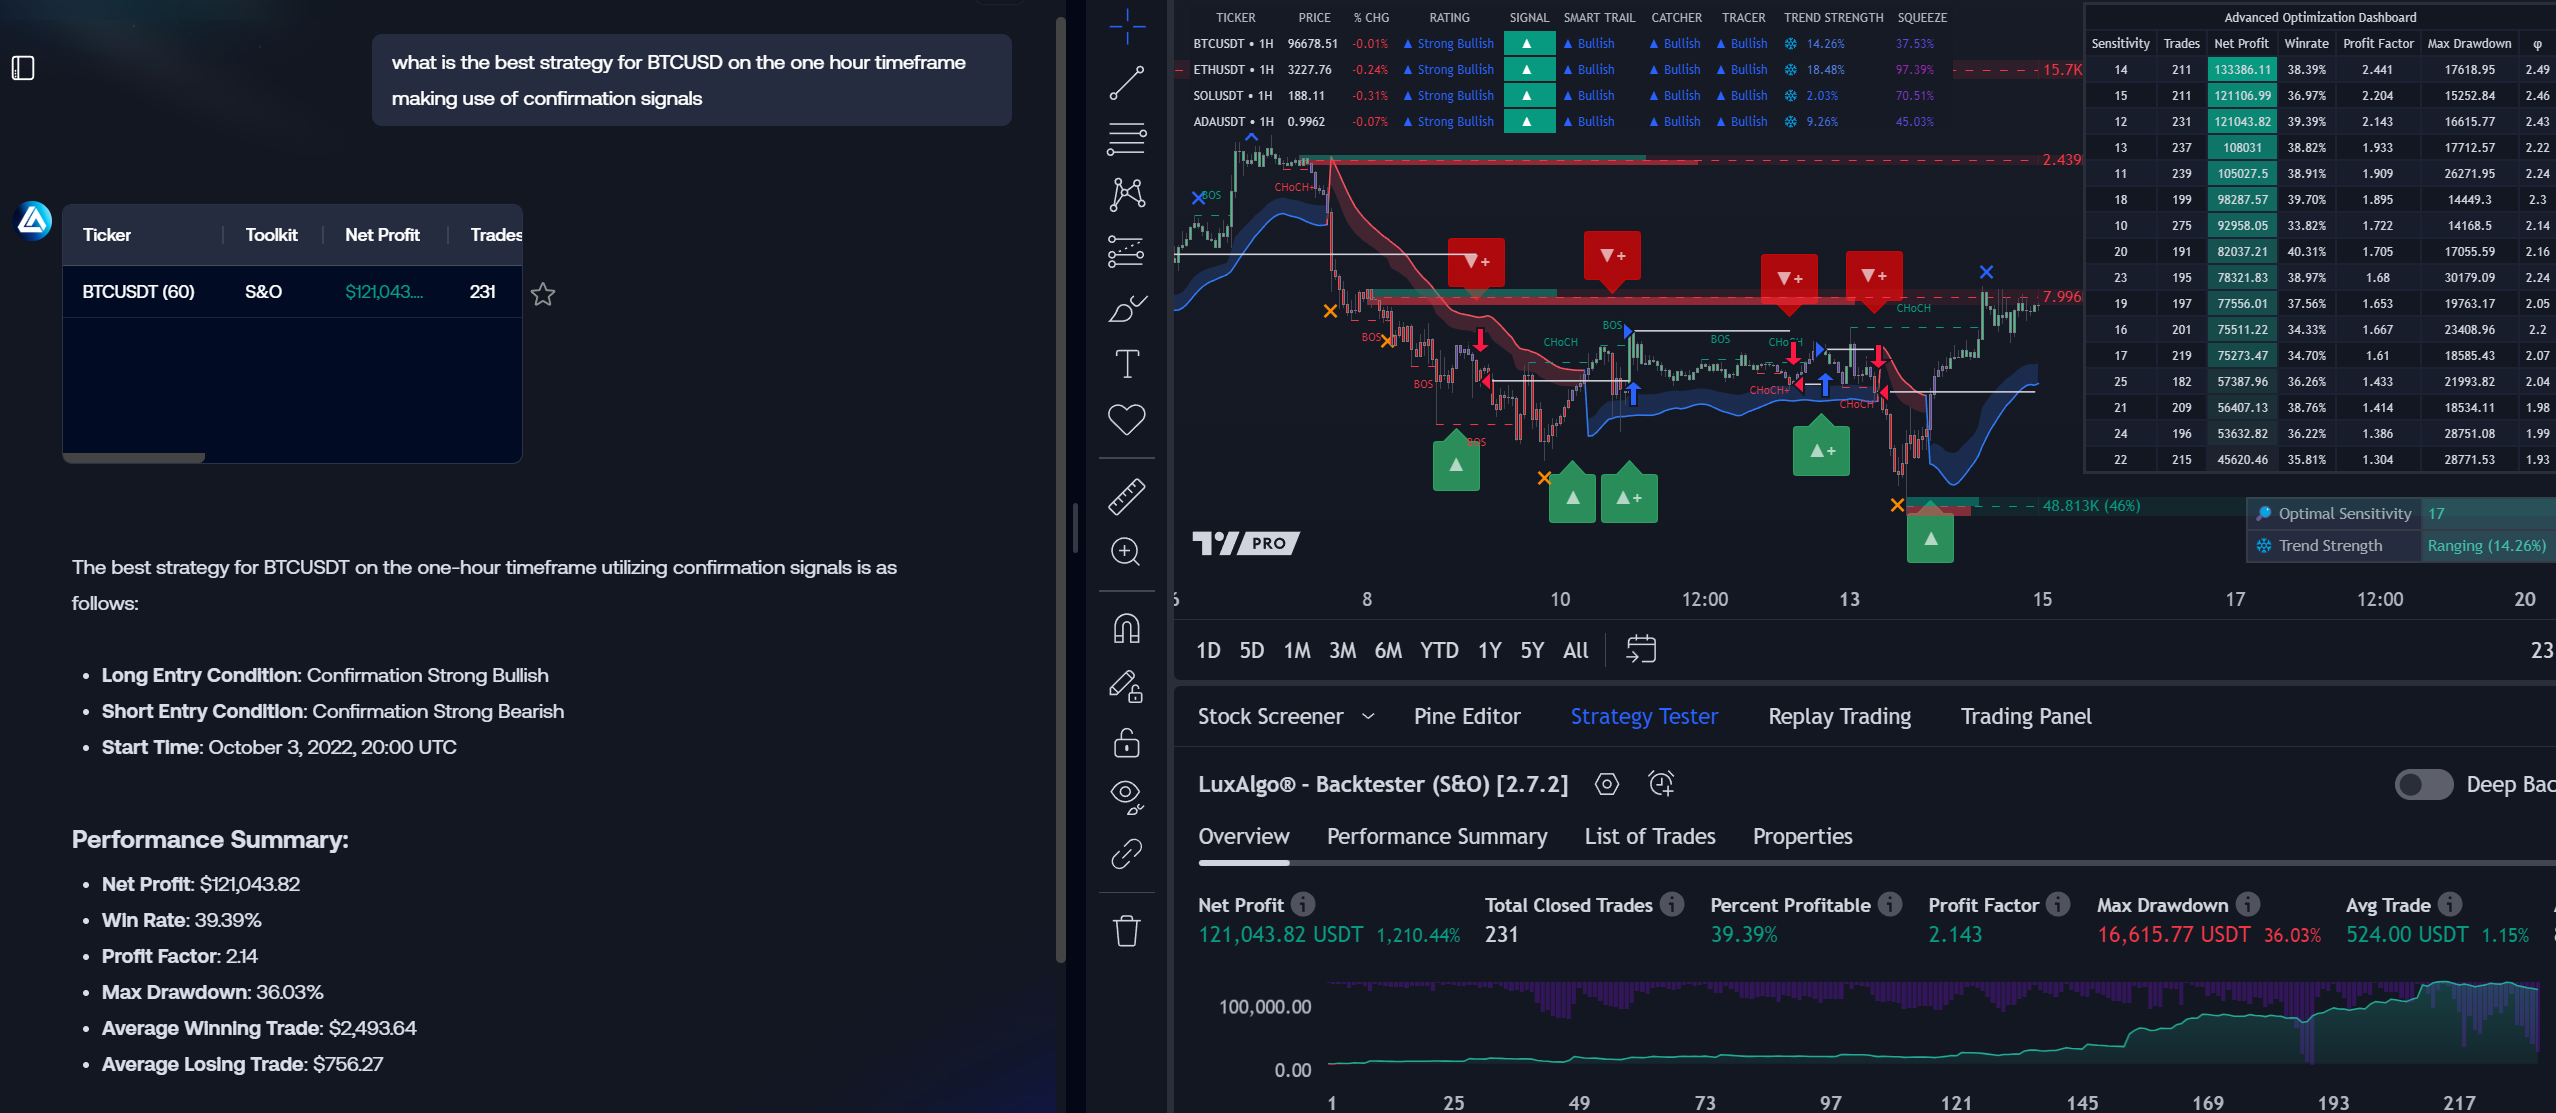
- Insights into the best settings for different market conditions
- Comprehensive performance reports
- The ability to uncover patterns often overlooked in manual reviews
Benefits of a Trading Community
LuxAlgo’s active trading community provides access to shared strategies, round-the-clock support, and educational materials. This collaborative space allows traders to learn from others and test their strategies in real-world scenarios.
"The combination of advanced indicators and AI-powered backtesting allows traders to create and refine strategies more efficiently than ever before", says a senior trader from the LuxAlgo community [1].
These features make advanced trading approaches accessible while keeping risk management a priority. When paired with disciplined practices, they help traders design strategies suited to their goals and the market's demands.
Conclusion: Building Better Stock Trading Strategies
Creating effective stock trading strategies involves blending technical analysis, using the right indicators, and leveraging modern features. Technical analysis lays the groundwork by helping traders spot market trends and patterns through detailed examination of price movements and trading volume [1].
Using a mix of trend and momentum indicators, such as moving averages and MACD, provides a solid starting point for analysis. Adding advanced features to this framework makes testing and refining strategies easier and more efficient [2].
Modern platforms like LuxAlgo take this a step further by offering an AI Backtesting Assistant and exclusive screeners and backtesters on TradingView, simplifying strategy development for traders at any skill level. Plus, its active trading community offers shared strategies, support, and educational resources to help traders continuously improve.
Finally, risk management is key to staying in the game. Tools like stop-loss orders and thoughtful position sizing protect your capital while allowing for growth. By combining technical analysis, advanced features, and strong risk management, traders can build strategies that keep pace with ever-changing markets.