Learn how to customize TradingView charts to enhance your trading analysis with tailored indicators, layouts, and tools for better decision-making.
Customizing your TradingView charts can improve your trading analysis by tailoring them to your specific needs. Here's how to optimize your setup:
- Access Settings: Click the cogwheel icon or right-click the chart to open the settings menu.
- Chart Appearance: Adjust chart types (candlestick, bar, line, area), colors, and themes for better readability.
- Add Indicators: Use tools like Moving Averages, RSI, or Bollinger Bands to enhance your analysis. Fine-tune their settings to match your strategy.
- Save Layouts: Organize and save chart layouts for quick access and efficient analysis.
- Integrate Tools: Add external tools like LuxAlgo for AI-driven insights and advanced indicators.
How to Change Chart Appearance
Customizing your TradingView chart can help create a workspace that matches your trading style. TradingView makes this easy with a user-friendly settings menu packed with options.
Accessing Chart Settings
To start customizing, open the chart settings menu. You can find it by clicking the cogwheel icon near the 'Publish' button or by right-clicking on the chart and selecting 'Settings...' This will open a window with six tabs: Symbol, Status Line, Scales, Appearance, Trading, and Events [1].
Adjusting Chart Types and Layouts
The type of chart you use can shape how you interpret market movements. TradingView supports several chart types, including:
- Candlestick: Great for price action analysis.
- Bar: Useful for traditional technical analysis.
- Line: Ideal for spotting trends.
- Area: Focused on volume visualization [3].
If you analyze multiple charts at once, the multi-chart layout feature lets you arrange them side-by-side or in a stacked view. You can also enable symbol syncing so all charts update together when you switch trading pairs [2].
Tweaking Colors and Themes
Changing colors and themes can make your charts easier to read and reduce eye strain. Head to the Appearance tab to adjust:
- Background colors
- Gridline visibility and color
- Price bar and candlestick colors
- Axis labels and scale design [1][3]
To save a custom color scheme, right-click on the chart, go to 'Colour Theme,' and select 'Save As...' Keep your charts clean and focused - avoid overloading them with too many indicators or overly complex color combinations that might obscure key data.
Once your chart looks the way you want, you can move on to adding and fine-tuning indicators to boost its functionality.
How to Add and Adjust Indicators
TradingView's indicator library provides a variety of tools to help you analyze the markets. Adding and customizing these indicators can refine your trading workspace.
Adding Indicators
To access TradingView's library, click the "Indicators" button at the top of your chart. Here, you'll find popular tools such as:
- Moving Averages
- RSI (Relative Strength Index)
- Bollinger Bands
- Volume Indicators
For more tailored analysis, check out the "Scripts" section within the Indicators menu. This area features user-created tools from the TradingView community. Once you've added an indicator, you can fine-tune its settings to match your trading needs.
Editing Indicator Settings
Adjusting indicator settings allows you to align them with your specific strategy. Here's how you can modify an indicator:
- Access Settings: Right-click the indicator on your chart and choose "Format" [1].
- Adjust Key Parameters: Update details like:
- Time periods for moving averages
- Overbought and oversold levels for RSI
- Standard deviation settings for Bollinger Bands
- Customize Visuals: Use the "Style" tab to:
- Change colors, line thickness, and opacity
- Decide whether the indicator overlays the main chart or appears in a separate pane
To avoid overwhelming your chart, stick to a few indicators that complement each other. For instance, pairing a trend indicator like a moving average with a momentum indicator like RSI can provide a well-rounded view [1][3].
For those seeking advanced tools, LuxAlgo indicators can be integrated directly into your TradingView charts. These include features like AI-driven trend analysis and detailed volume studies. They work seamlessly with TradingView's core tools, offering additional insights for in-depth analysis [Context].
Saving and Organizing Chart Layouts
Once you've customized your TradingView charts with the right indicators and settings, saving your layouts ensures you can keep everything organized and ready to go. A well-organized workspace can make your trading process smoother and more efficient.
Saving Chart Layouts
To save your chart layout, click the 'Save' icon in the top menu or choose 'Save Chart Layout' from the dropdown menu [1]. Use clear, descriptive names when saving layouts, like 'Crypto-Trends,' 'Forex-Scalping,' or 'Stocks-Long-Term,' so you can easily identify them later.
You can access your saved layouts anytime through the 'Charts' menu at the top of the TradingView interface [3]. This makes switching between setups quick and hassle-free, without needing to reconfigure your charts each time.
Organizing Multi-Chart Layouts
If you're analyzing multiple assets or timeframes, TradingView's multi-chart feature is a game-changer. Use the symbol synchronization option in the layout menu to ensure all linked charts update at the same time. You can also customize each chart with its own indicators, timeframes, or styles [2].
Here are some layout ideas to keep things organized:
| Layout Type | Purpose | Setup Details |
|---|---|---|
| 2x2 Grid | View different timeframes for one asset | 4 charts showing various time intervals |
| 3x1 Horizontal | Compare related assets side by side | 3 related assets in a horizontal alignment |
| 2x1 Split | Focus on price action with indicators | Main chart paired with a dedicated indicator panel |
You can also create separate layouts tailored to specific market conditions or trading sessions. This way, you're always ready to adapt to market changes without missing a beat. With your layouts saved and organized, you're set to dive deeper into TradingView's tools for even better analysis.
Using External Tools to Improve Analysis
While TradingView comes packed with powerful features, adding external tools can take your chart analysis to the next level. One standout option is LuxAlgo, which integrates seamlessly with TradingView and offers advanced indicators and AI-driven tools.
Adding LuxAlgo to TradingView
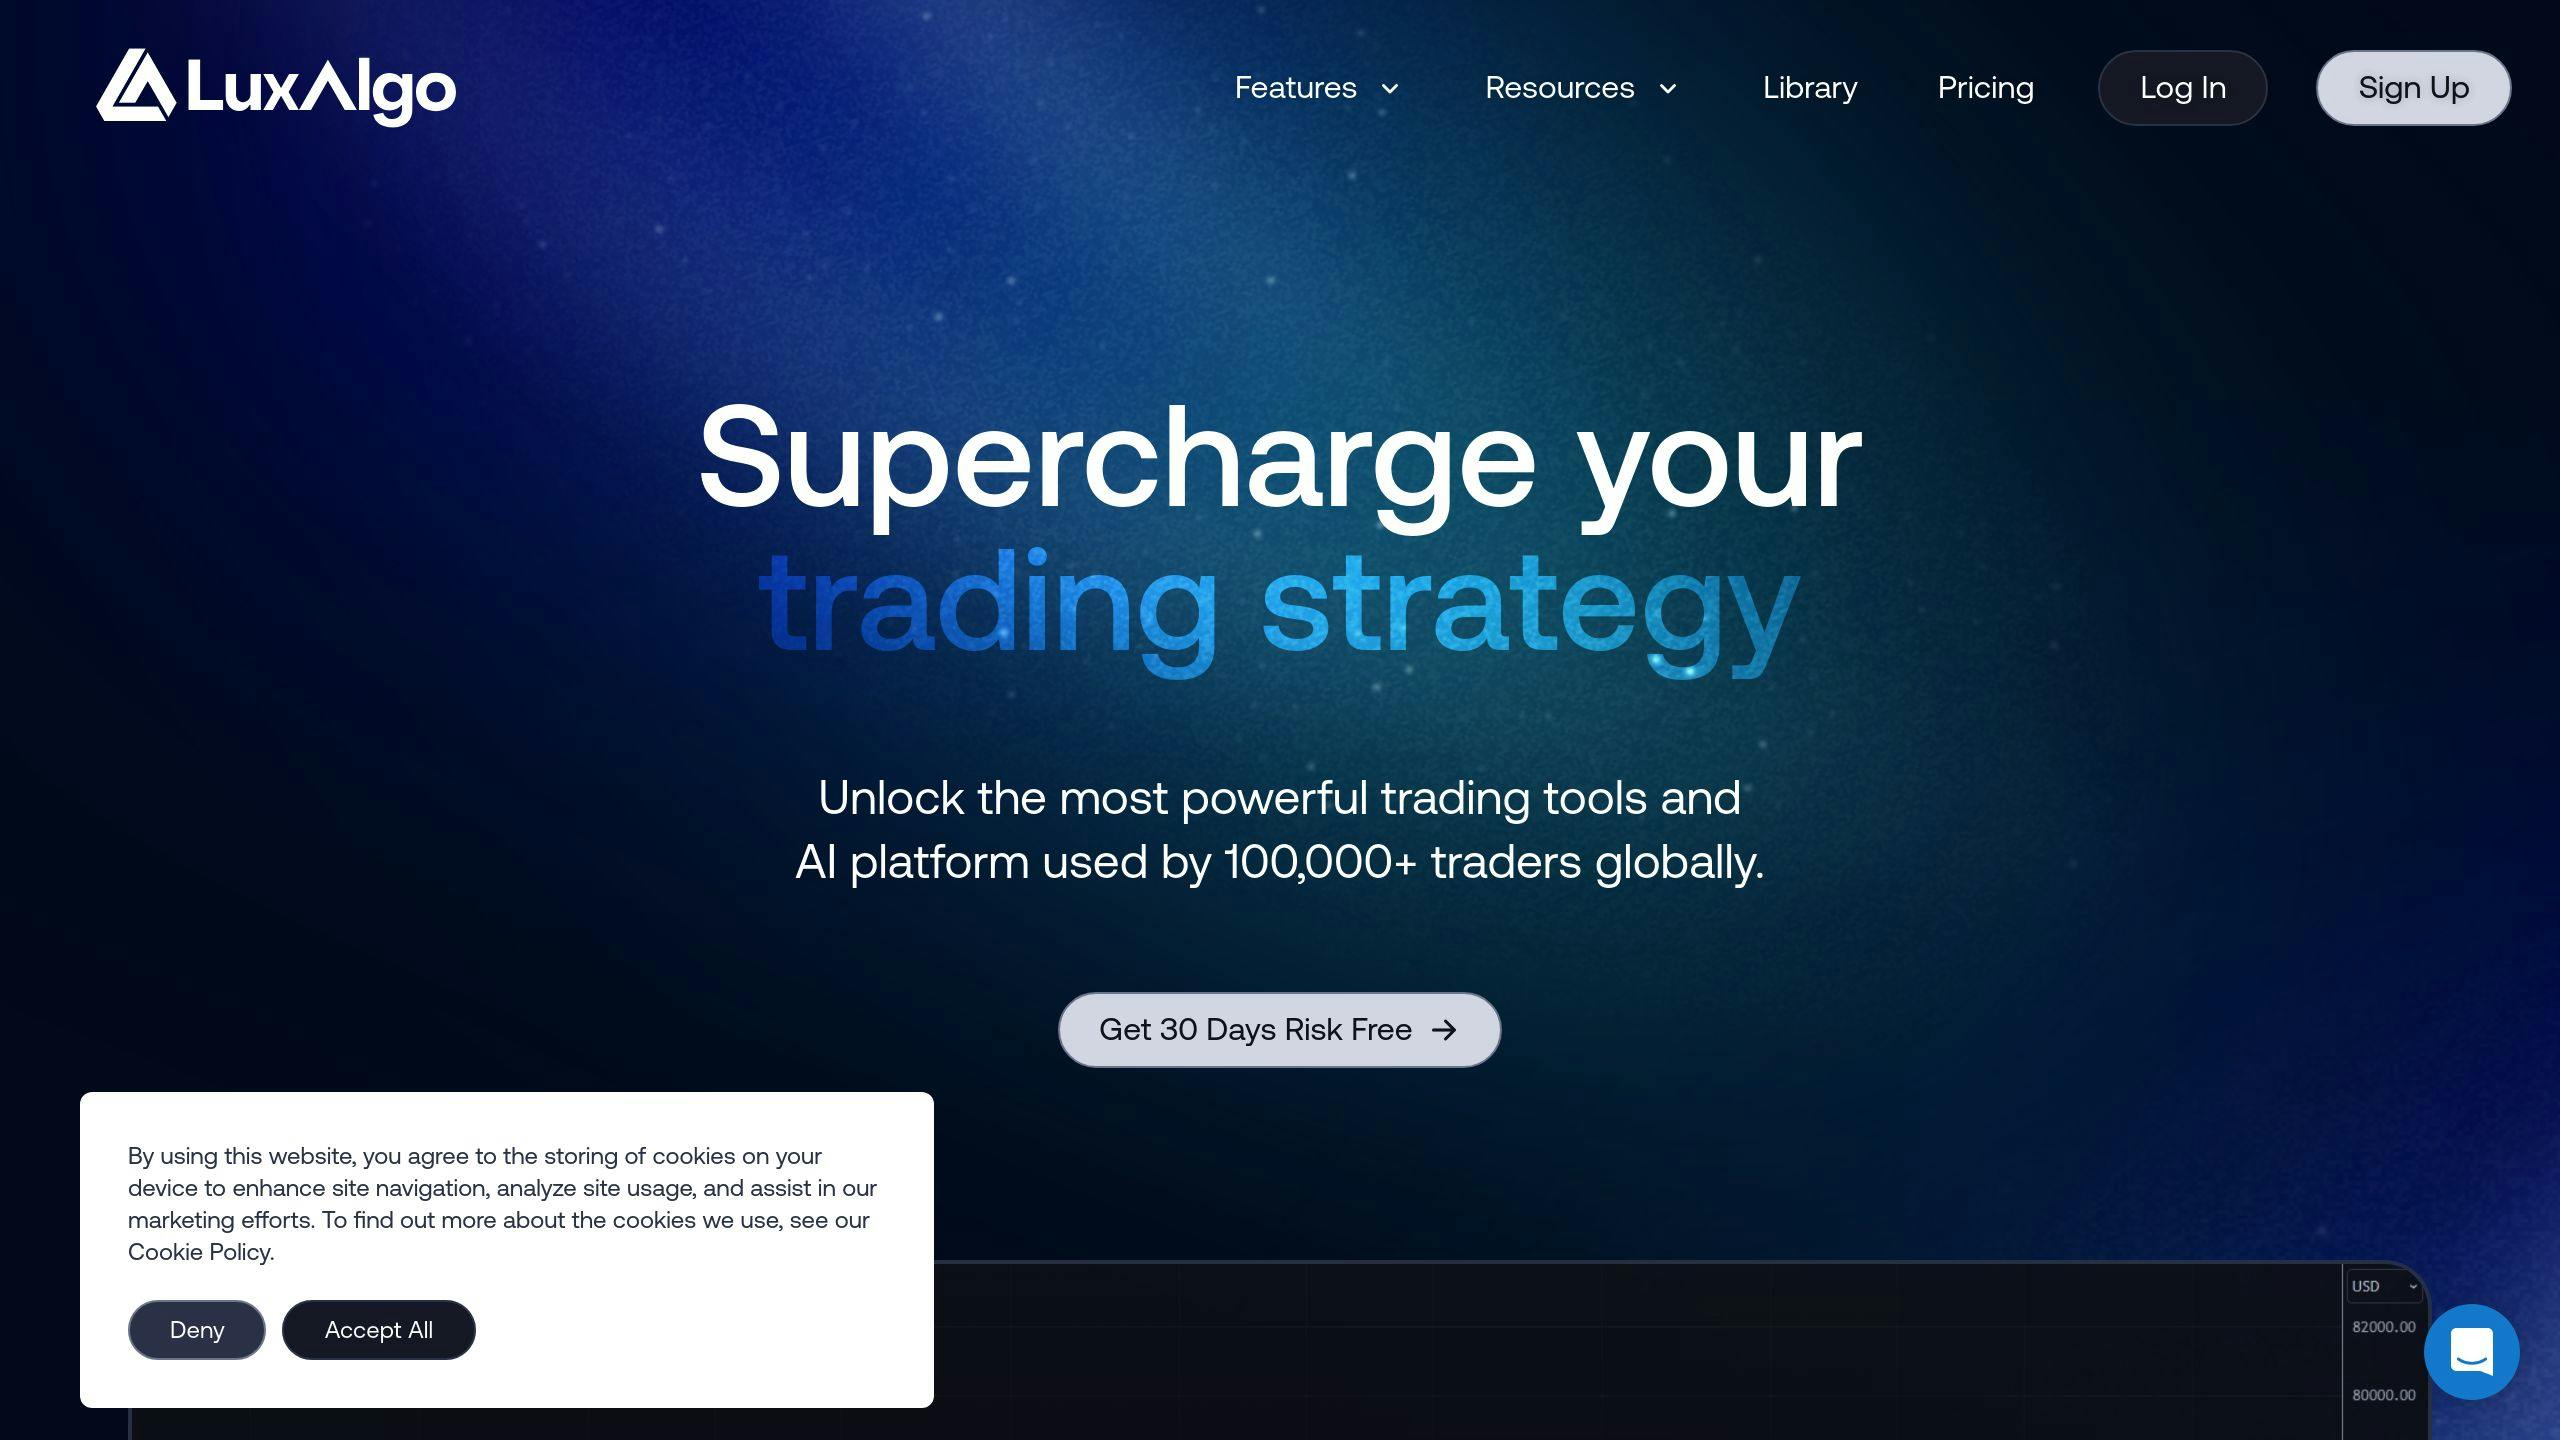
Getting started with LuxAlgo on TradingView is simple:
| Step | Action |
|---|---|
| Setup | Head to LuxAlgo's website, create an account, and choose your tools. |
| Customize | Adjust the settings to align with your trading strategy. |
LuxAlgo's Pro Toolkits are designed to complement TradingView's features, providing advanced indicators without overwhelming your charts.
Using LuxAlgo for Better Strategies
Integrating tools like LuxAlgo can refine your market analysis and trading strategies. Here’s how it can help:
- AI-Driven Insights: The AI Backtesting Assistant uses historical data to simulate strategies, giving you a chance to fine-tune them before trading live.
- Smarter Filtering: LuxAlgo's Screeners let you filter trade setups based on specific criteria, saving time and helping you spot opportunities across different assets.
- Community Access: Join a vibrant trading community where you can exchange tips and learn how to maximize these tools.
For a more efficient workflow, combine LuxAlgo's price action indicators with TradingView's volume analysis tools. This pairing gives you a broader view of market trends and opportunities.
"The integration of advanced indicators and AI tools with TradingView charts enhances analysis capabilities and helps traders make more informed decisions", says a LuxAlgo community expert.
Conclusion: Personalizing TradingView Charts for Better Analysis
Once you've added tools like LuxAlgo and adjusted your layouts, the next step is recognizing how these tweaks improve your trading workflow. Customizing TradingView charts helps you create a workspace tailored to your strategies, serving as a central hub for making informed decisions.
Prioritize clear visuals, logical layouts, and only a handful of indicators that complement your approach. The goal is to keep your charts clean and focused, avoiding unnecessary clutter that could distract from your strategy.
"One of the many reasons traders love TradingView is the ability to customise the colours and layout of charts. Arguably, this is what has set TradingView apart from other charting platforms." [1]
For those looking to take their analysis further, tools like LuxAlgo bring AI-driven insights and advanced indicators into the mix. This combination lets you pair traditional technical analysis with cutting-edge tools, offering a deeper understanding of market trends.
Keep your customizations simple and relevant. Regularly update and save your layouts to ensure they remain effective. A well-personalized TradingView chart setup not only streamlines your analysis but also boosts your confidence and consistency as a trader. It lays the groundwork for disciplined and systematic trading.
FAQs
How to set templates on TradingView?
Using templates in TradingView helps maintain consistent chart setups, making analysis smoother. To create a template, adjust your chart with your preferred timeframe, indicators, and settings. Then, click on 'Indicator Templates', choose 'Save Indicator Template', give it a clear name, and check the 'Remember Interval' box to save your timeframe. Finally, hit 'Save'.
For more in-depth analysis, consider adding LuxAlgo indicators to your template so they load automatically with your chart settings.
Tips for Managing Templates:
| Action | Purpose | Benefit |
|---|---|---|
| Update Regularly | Keep templates aligned with current markets | Ensures your analysis stays relevant |
| Use Multiple Setups | Tailor templates for specific needs | Simplifies analysis for different goals |
| Backup Templates | Export your key layouts | Protects your custom settings from loss |
Templates are a great way to save time and maintain consistency in your analysis. Pairing them with advanced tools like LuxAlgo can further enhance your workflow.


