Learn how to effectively draw trendlines for support and resistance in trading, ensuring accuracy with essential techniques and validation methods.
Trendlines are essential for traders to identify key support and resistance levels. They connect important price points to reveal market direction and potential reversal zones. Here's a quick guide to get started:
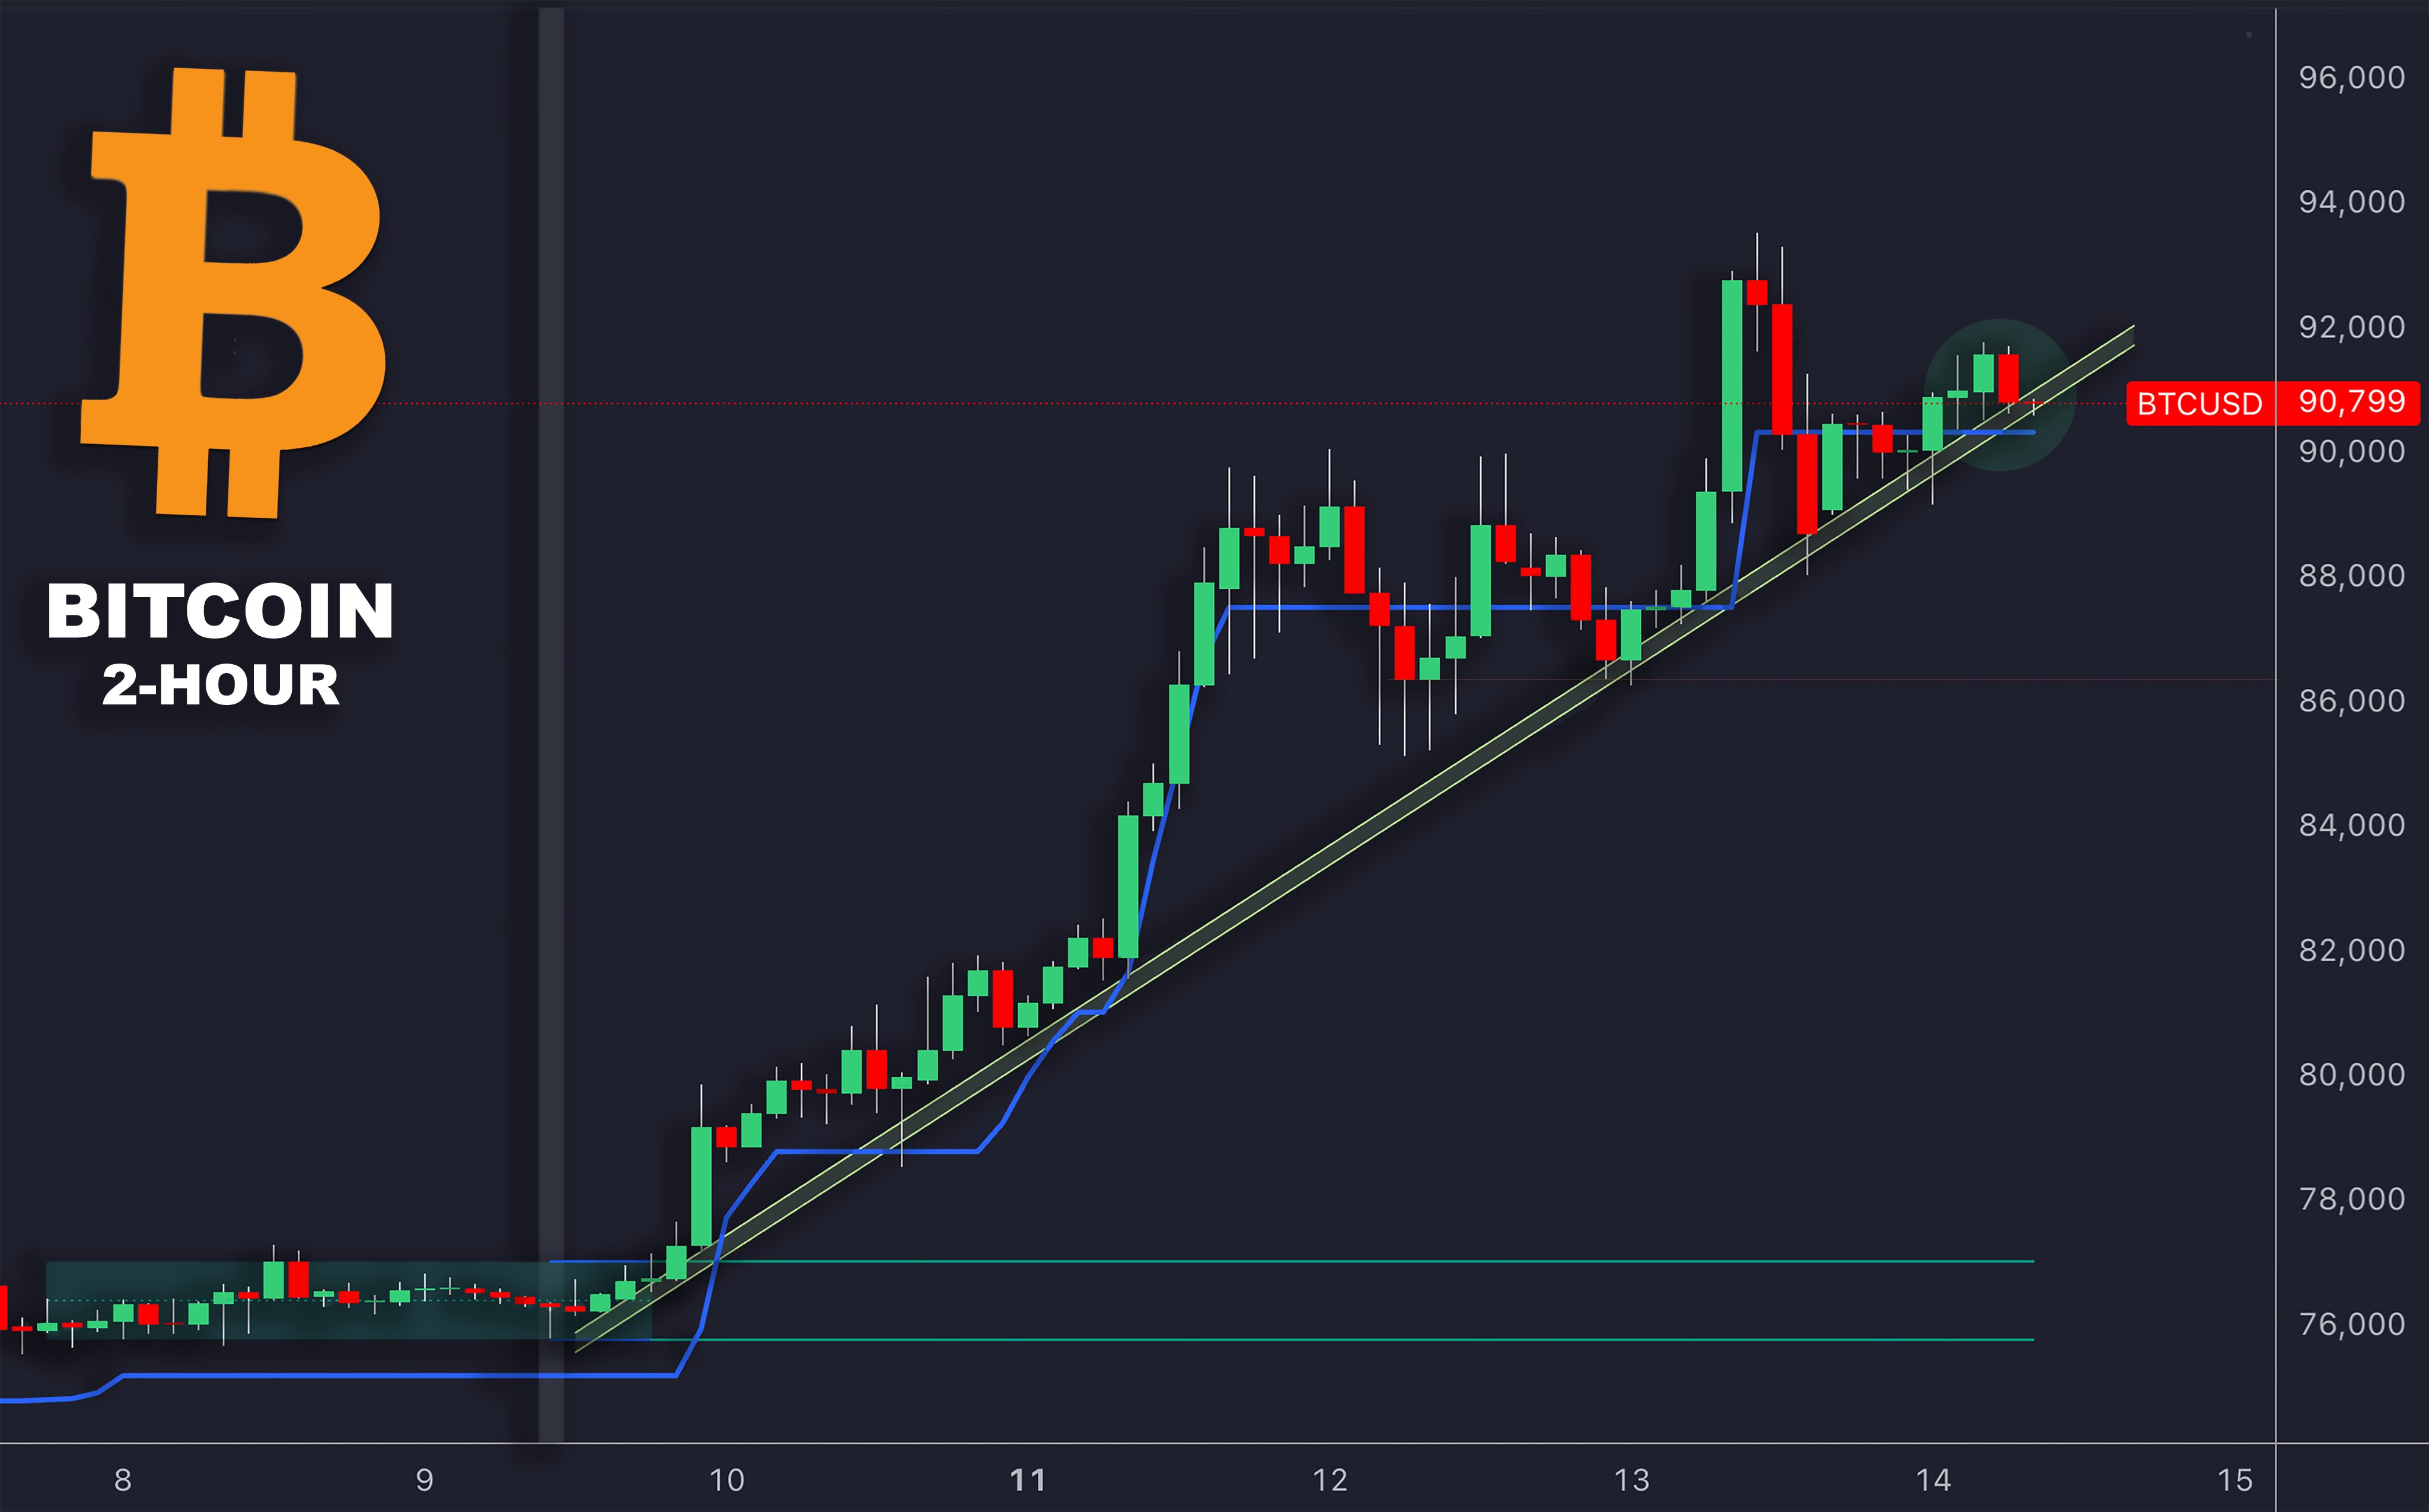
- Uptrend Lines: Connect higher lows below the price to identify support.
- Downtrend Lines: Connect lower highs above the price to find resistance.
- Validation: Ensure at least three price touches for reliability.
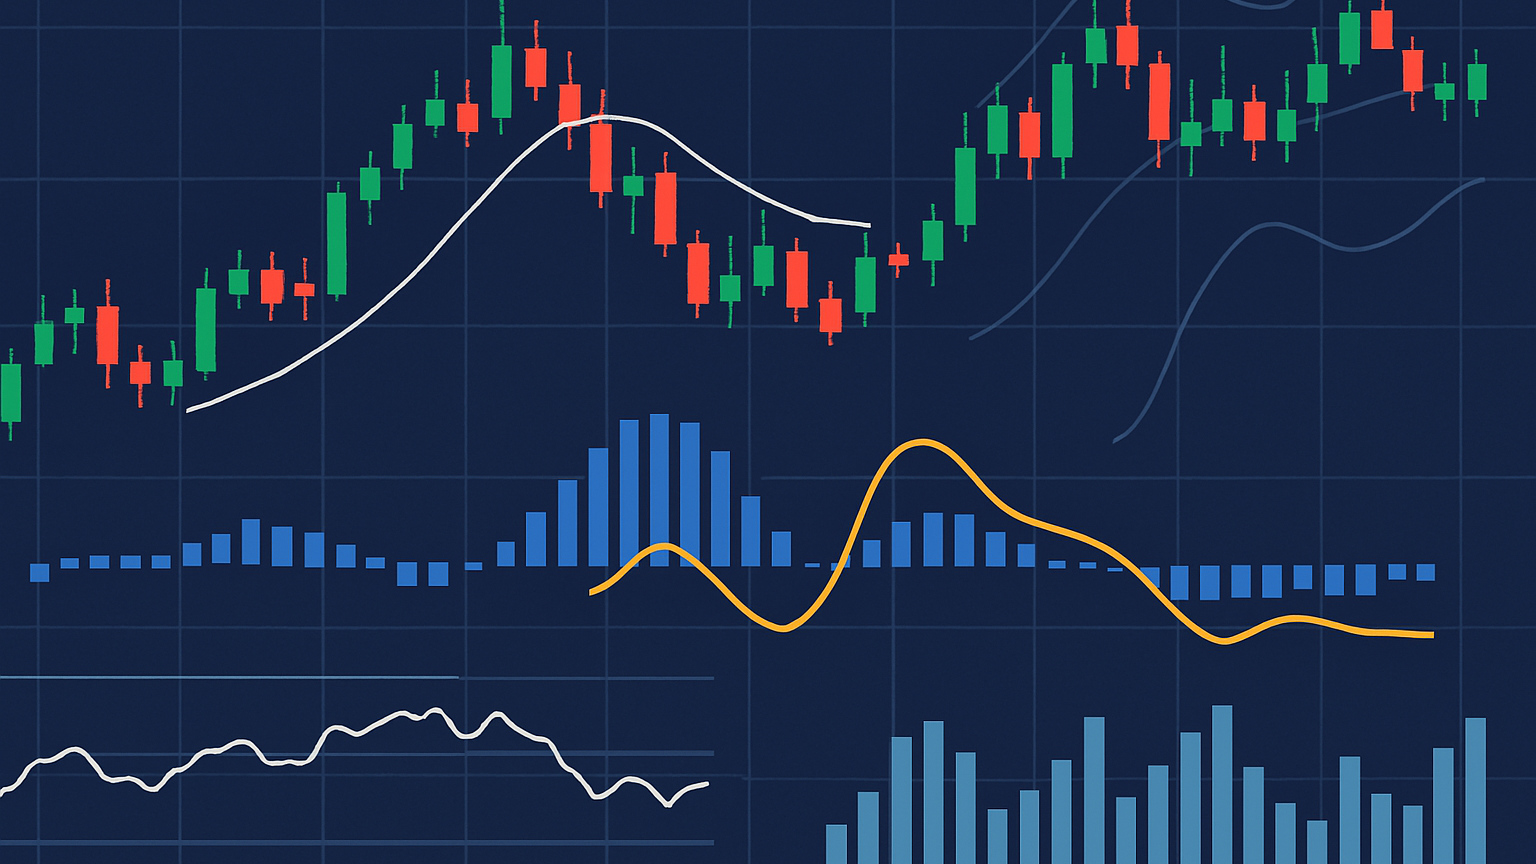
- Volume Check: Strong bounces often align with higher trading volume.
- Tools: Use platforms like TradingView for both manual and automated trendline drawing.
Accurate Trend Lines Trading Strategy
How to Draw Trendlines
Drawing trendlines effectively takes attention to detail and a clear method. Here's how to create reliable trendlines that highlight key support and resistance levels.
Finding Swing Points
Start by identifying major price reversals that signal distinct directional changes. Skip minor fluctuations and focus on clear turning points. Tools like Fibonacci retracements can help confirm the importance of these reversals [8].
Drawing Accurate Lines
Once you've spotted the swing points, follow these steps to draw your trendlines:
- Connect two major reversal points.
- Position the line below the price for an uptrend or above for a downtrend [2].
- Use candlestick wicks for more precision [3].
Deciding whether to use candlestick bodies or wicks is up to you—both methods work. However, wicks often provide a more precise level [3]. Whatever you choose, stick to it throughout your analysis for consistency.
Confirming Trendline Strength
A trendline becomes more reliable with each additional price touch. Look for these signals to confirm its strength:
| Validation Factor | Signals to Look For |
|---|---|
| Minimum Touches | At least three separate price touches [9] |
| Touch Spacing | Even spacing between the touches |
| Volume Behavior | Higher volume at bounce points [5] |
| Price Reaction | Clear, strong moves away from the trendline |
For extra confirmation, consider using tools like LuxAlgo's Smart Trend indicator. It can help verify the trend's direction and strength, especially at critical touchpoints [10].
When the price nears your trendline, volume analysis can offer additional insights. Strong support or resistance is often accompanied by higher volume during bounces, while low volume may indicate a weaker level that's more likely to break [5].
These techniques become even more effective when paired with advanced methods, which we'll discuss next.
TradingView Trendline Tools

Basic TradingView Features
TradingView offers several tools for drawing trendlines, such as the Trend Line Tool for standard lines, the Ray Tool for lines that extend infinitely in one direction, and the Extended Line Tool for lines that stretch infinitely in both directions [1].
Some useful features include:
- Trend Line and Ray Tools for manual drawing
- Multi-chart layouts to confirm trends across different timeframes
- Color-coded lines to keep your charts organized
While these manual drawing tools are highly effective, pairing them with automated methods can save time and improve accuracy.
LuxAlgo for Enhanced Trendline Analysis
LuxAlgo’s Price Action Concepts (PAC) toolkit elevates TradingView's trendline capabilities by automating much of the analysis process [6].
What makes this approach stand out?
- Automatically detects swing points that align with manual methods
- Sends real-time alerts to validate trendline strength
- Synchronizes trendlines across multiple timeframes
These features complement the three-touch validation method discussed earlier. Alerts notify you when the price nears a trendline, enabling quick action on potential breakouts or reversals.
For a thorough analysis, try combining TradingView’s manual tools with the advanced features provided by LuxAlgo on TradingView.
Advanced Trendline Methods
Combining Trendlines with Indicators
Pairing trendlines with tools like Fibonacci retracements refines your analysis. Apply Fibonacci levels to confirmed swing points and watch for volume surges when price interacts with your trendlines. These signals can further confirm the strength of the trendline. Methods such as these work well alongside automated alerts, as previously mentioned [1] [3].
Analyzing Across Timeframes
Using TradingView's multi-chart layouts, you can compare trendlines across different timeframes. When trendlines align on multiple charts, it often signals stronger trading opportunities. This approach helps pinpoint more reliable entry and exit points [6].
Keeping Trendlines Up-to-Date
Markets are always changing, and so should your trendlines. Here are some signs it’s time to adjust them:
- Price closes decisively beyond the trendline
- Several candles close outside the line
- New swing points deviate from the existing trendline
- Volatility spikes surpass average true range levels [1] [3]
Drawing parallel trendlines at slightly different angles can create zones of support or resistance that better accommodate market fluctuations. To stay ahead of potential breakouts or shifts, consider using automated alerts like those provided by LuxAlgo [7].
Common Trendline Errors
Even with careful validation, traders often misstep when using trendlines to identify support and resistance. Here's a breakdown of common pitfalls:
Skipping Validation Steps
Historical data shows that about 68% of properly validated trendline breaks lead to notable price movements [7]. To improve accuracy:
- Check the angle—ideally between 30-45° on daily charts—and ensure alignment across multiple timeframes [6].
- Consider whether broader market conditions support your trendline analysis [4].
Falling for False Breakouts
False breakouts can catch traders off guard, leading to costly mistakes if action is taken too hastily when a trendline appears to break.
Always Wait for Confirmation
- Look for a candle close beyond the trendline, supported by volume confirmation [6].
- Use additional technical indicators to support your analysis.
- Pay attention to price action patterns, such as engulfing candles.
Remember: steeper trendlines are generally more susceptible to false breakouts [6].
Inconsistent Drawing Practices
Inconsistent trendline analysis can lead to misinterpretations. Regularly reviewing and refining your trendlines—such as on a weekly basis—helps ensure you’re accurately identifying support and resistance levels [3].
Summary
Main Points
Drawing accurate trendlines for support and resistance involves following a structured validation process. A proper trendline connects at least three key price points [6], with uptrend lines linking higher lows and downtrend lines connecting lower highs [1]. The more a trendline is tested, the stronger and more reliable it becomes for predicting price movements.
Focus on these key aspects for effective trendline analysis:
- Touch validation: Confirm trendlines with clear swing points, supported by consistent volume activity across multiple timeframes.
- Volume confirmation: Observe increased trading activity when prices interact with the trendline.
- Multi-timeframe alignment: Validate that the trendline holds across various chart durations for added reliability.
Advanced Validation Methods
Enhance your analysis by combining trendline techniques with other indicators. For example, moving averages can serve as dynamic support or resistance levels, while RSI can pinpoint overbought or oversold conditions near trendline interactions. These methods provide deeper insights, especially when paired with multi-timeframe confirmation.
Getting Started
Ready to apply these techniques? Follow these steps:
1. Start with Higher Timeframes
Begin your analysis on daily or weekly charts, which reveal clearer trends and more dependable support and resistance levels. Once established, move to shorter timeframes for precise entry points.
2. Practice Basic Drawing
Identify at least three clear swing points, connect them accurately, and observe how prices react to the trendline.
3. Leverage Advanced Features
While TradingView offers robust manual drawing tools, pairing these with the advanced features available via LuxAlgo on TradingView can further enhance your analysis through automated validation and real-time alerts.
FAQs
How do you draw a trendline properly?
To draw a trendline, connect the key swing lows in an uptrend or the swing highs in a downtrend. Ensure the trendline has at least three price touches to confirm its validity. The steepness of the line can indicate the trend's strength, but always wait for confirmation.
How do you identify support and resistance levels?
Focus on major swing points where the price has reacted significantly. Instead of marking every minor fluctuation, prioritize areas where the price has clearly responded. If you’re leveraging the advanced features available via LuxAlgo on TradingView, the trend analysis capabilities can help automate the detection of these levels.
What are the key rules for drawing trendlines?
Here are the main guidelines for validating trendlines:
- Connect swing highs for downtrends and swing lows for uptrends.
- Ensure there are at least three confirmed price touches.
- Utilize multiple timeframes to confirm trendline breaks and assess trading opportunities.