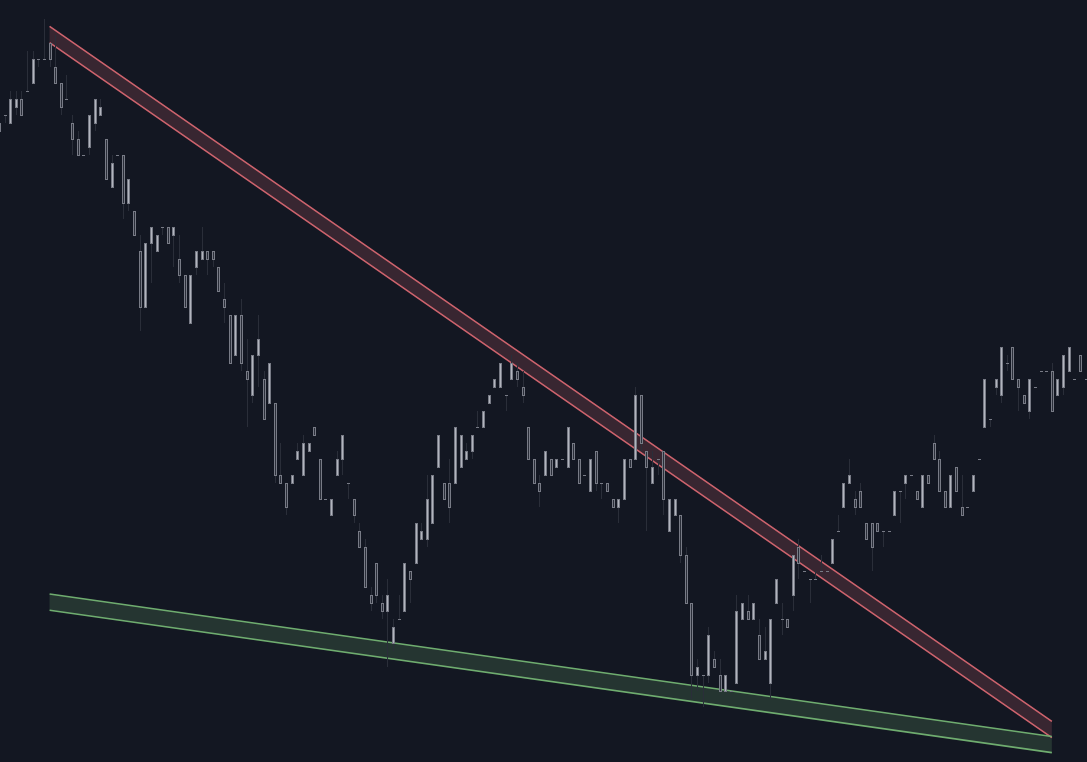
Learn how to draw trendlines in trading to identify market trends, support, resistance, and potential price reversals effectively.
Want to master trendlines in trading? Trendlines are essential tools that help traders identify market trends, support and resistance levels, and potential price reversals. Here's what you need to know:
- What are Trendlines? Diagonal lines connecting price highs or lows to reveal market direction.
- Why Use Them? They show support in uptrends, resistance in downtrends, and help confirm trends or reversals.
- How to Draw Them? Identify the trend, select key price points, and connect them accurately without cutting through candlestick bodies.
- Key Tips: Use higher timeframes for stronger signals, avoid forcing trendlines, and focus on multiple touchpoints for reliability.
Tools like LuxAlgo can simplify this process with automated trendline detection and validation. Whether you're a beginner or refining your strategies, trendlines are a core skill for trading success.

Basics of Trendlines
What Are Trendlines?
A trendline is a diagonal line on a price chart that connects two or more key price points. It helps traders visually interpret market trends and price movements [4].
Types of Trendlines
| Trendline Type | Purpose and Behavior |
|---|---|
| Uptrend | Links higher lows; serves as support, showing bullish momentum |
| Downtrend | Links lower highs; acts as resistance, signaling bearish momentum |
| Sideways | Tracks horizontal price movements; indicates consolidation and indecision |

Each type provides insights into market activity and potential trading setups [4].
Why Are Trendlines Useful?
Trendlines play a key role in technical analysis by helping traders:
- Pinpoint Support and Resistance: They act as support during uptrends and resistance during downtrends [3].
- Detect Possible Reversals: A break in the trendline often hints at a change in market direction [4].
- Confirm Market Trends: The more times a trendline is tested, the stronger the trend.
Tools like LuxAlgo simplify this process by automating trendline detection and integrating it with other technical indicators. This allows traders to quickly spot and validate trends with greater efficiency.
Next, let's dive into the step-by-step process of drawing and verifying trendlines effectively.
Guide to Drawing Trendlines
Creating accurate trendlines requires a clear process and a sharp eye for detail. Here's how you can draw trendlines that enhance your trading analysis.
1. Identify the Trend
First, determine the market's direction. Is it moving upward with higher highs and lows? Downward with lower highs and lows? Or is it sideways with relatively equal highs and lows? Identifying the trend sets the foundation for drawing your trendlines.
2. Choose Key Points
The strength of any trendline comes from the anchor points you use. In an uptrend, focus on significant low points that rise progressively. For a downtrend, connect the key lower high points.
What to look for when selecting points:
- Use clear and noticeable price reversal points on your chosen timeframe.
- Avoid minor, insignificant price movements; focus on prominent reversals.
- Aim for at least two anchor points, but three or more make the trendline more reliable.
3. Connect and Validate Your Trendline
After pinpointing your key points, draw a diagonal line connecting them. Validation ensures the trendline reflects actual market behavior.
Validation tips:
- The line should touch multiple price points without slicing through candle bodies.
- Try to connect as many significant price points as possible while maintaining accuracy.
- Double-check that the trendline aligns with the broader market trend.
Using tools like LuxAlgo's technical analysis indicators can simplify this process. Their automated trendline detection and validation features can help you identify critical support and resistance levels, making it easier to confirm your trendlines.
For more information about automated trendline analysis, check out Trendlines with Breaks by LuxAlgo .
A properly drawn trendline becomes a powerful tool for spotting potential trade opportunities, whether you're planning entries or exits. Once you've mastered the basics, you can refine your approach with additional techniques to maximize their impact in your trading strategy.
Tips for Using Trendlines
Once you know the basics of drawing trendlines, these tips can help you avoid mistakes and sharpen your analysis.
Use Higher Time Frames
Start with daily or weekly charts. These longer timeframes highlight stronger support and resistance levels while filtering out short-term fluctuations. This approach helps you focus on the trendlines that truly matter for trading decisions.
Avoid Forcing Trendlines
Trendlines should naturally align with price action. If you find yourself constantly tweaking a trendline to make it fit, it’s probably not valid.
Signs you might be forcing a trendline:
- It frequently cuts through candlestick bodies.
- You have to keep adjusting it to match price movements.
- It connects minor price levels or ignores the overall market structure.
Focus on Multiple Touches
A trendline becomes more reliable when it's tested multiple times. Each touchpoint shows market confidence in that level, making it a useful indicator for potential price movements.
"Trend lines can help traders identify buying and selling opportunities that occur within a strong trend." - Justin Bennett, Daily Price Action
When evaluating multiple touches, look at how prices react at those points. Strong trendlines often lead to noticeable reactions, like bounces off support or rejections at resistance.
Using tools like LuxAlgo's technical analysis indicators can make this process easier. These tools can automatically confirm trendline validity by analyzing price interactions, helping you make more objective decisions.
Keep in mind, though, that quality matters more than quantity. A trendline connecting three major swing points over several months is far more reliable than one linking minor fluctuations over a few days.
Common Errors in Trendline Drawing
Drawing trendlines effectively requires avoiding mistakes that can lead to poor trading decisions. Recognizing these errors can sharpen your technical analysis skills.
Overdrawing Trendlines
A common issue traders face is overcrowding their charts with too many trendlines. This can make your analysis messy and harder to interpret.
Too many trendlines can result in mixed signals, difficulty spotting key patterns, and emotional decision-making. Instead, focus on the major swing highs or lows. A clean chart with just 2-3 key trendlines is often far more helpful than one cluttered with dozens of lines.
Ignoring Market Context
Trendlines are more than just lines on a chart — they're part of a bigger picture. Failing to consider market context can lead to misreading temporary price shifts as trend reversals.
Here are some critical factors to keep in mind:
- The overall market trend
- Economic news or key events
- Trading volume near trendline levels
"Traders need to understand the overall trend and market conditions to accurately interpret trendlines and make informed trading decisions. This includes considering factors such as economic indicators, news events, and market sentiment" [4]
Using tools like LuxAlgo can help confirm whether a trendline break is genuine by factoring in broader market conditions. Even a perfectly drawn trendline can become irrelevant if major market events or fundamental changes occur. Always keep the bigger picture in mind when analyzing trendlines.
Avoiding these errors will help ensure your trendlines are clear and actionable, especially when paired with tools for additional validation.
Using LuxAlgo for Trendline Analysis

Drawing trendlines manually is an important skill, but tools like LuxAlgo can make the process faster and more efficient with their advanced features.
LuxAlgo's Indicators for Trendlines
LuxAlgo offers toolkits like Price Action Concepts that help traders pinpoint swing highs and lows, making trendline drawing more precise. With automated analysis, the platform ensures consistent results across various timeframes, offering a helpful complement to manual techniques by clearly identifying key price levels.
Customizing Trendline Strategies with LuxAlgo
LuxAlgo's customizable indicators and AI Backtesting Assistant allow traders to fine-tune their trendline strategies using historical data. This AI-driven system can:
- Analyze past price movements
- Highlight ideal entry and exit points
- Provide suggestions to improve strategies based on performance
"The AI-driven approach enhances the accuracy and reliability of trendline analysis, enabling traders to make more informed decisions through advanced insights and predictive analytics."
LuxAlgo Community and Support
LuxAlgo has a strong community that provides resources like strategies, support, and shared techniques to help traders sharpen their trendline analysis skills. This collaborative space allows users to gain insights from experienced traders while maintaining full control over their trading activities.
| Community Feature | Benefit |
|---|---|
| Weekly Strategies | Access to tested trendline setups |
| Priority Support | Direct help with customization |
| Strategy Sharing | Learn from others’ successful methods |
Liquidity Trendlines
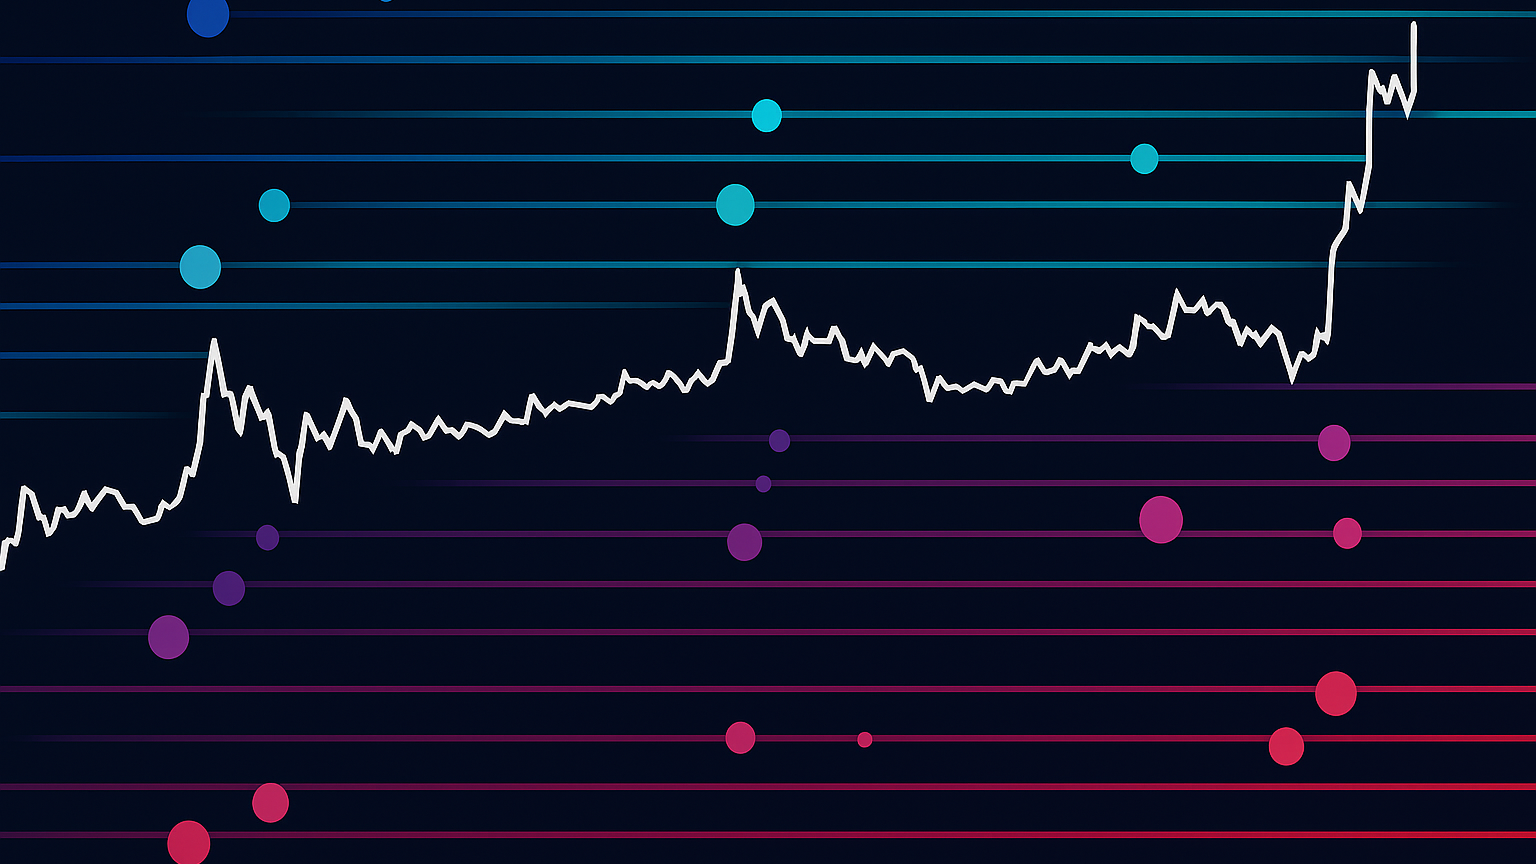
In addition to standard trendlines, LuxAlgo’s Price Action Concepts also features Liquidity Trendlines. These lines represent areas where market participants place a high volume of orders (liquidity), often acting as strong support or resistance levels.
- Key Insight: Liquidity trendlines frequently coincide with major swing points, indicating where large traders may enter or exit positions.
- Price Action Concepts: When price approaches a liquidity trendline, watch for potential volatility spikes or quick reversals as pending orders get triggered.
- Practical Use: They can help you anticipate where breakout or reversal opportunities might occur, complementing traditional trendline analysis.

By incorporating liquidity trendlines into your routine, you gain insight into areas that may see higher trading activity, offering potentially more robust entry and exit points.
Conclusion
Let’s wrap up the essentials for mastering trendline analysis.
Learning to draw trendlines effectively is a core skill that can greatly improve your trading outcomes. When done correctly, trendline analysis helps traders spot market trends, pinpoint support and resistance levels, and identify potential reversal points with better precision.
To trade successfully using trendlines, stick to a few key practices. Start with higher timeframes to cut through market noise and ensure reliability. Make sure your trendlines connect multiple touchpoints to confirm their validity. And most importantly, don’t force trendlines where they don’t naturally align—this keeps your trading decisions grounded and disciplined.
Modern tools have made trendline analysis easier and more efficient. By blending traditional manual techniques with advanced tools, traders can create strategies that are both thorough and precise.
Here’s a quick guide to applying trendline analysis effectively:
| Aspect | Strategy | Outcome |
|---|---|---|
| Timeframe | Begin with higher timeframes (4H, Daily) | More dependable trend detection |
| Validation | Ensure at least 3 touchpoints | Stronger trendline confirmation |
| Tool Usage | Combine manual work with tools like LuxAlgo | Better trend accuracy |
| Risk Management | Use trendline breaks as exit signals | Improved trade handling |
Mastering trendline trading takes dedication, practice, and a disciplined approach. Whether you’re just starting out or refining an advanced strategy, focusing on accurate trendline techniques and leveraging cutting-edge tools will help you build a solid trading foundation.
Consistency and discipline are your best allies. By merging traditional methods with modern innovations, you’ll be well-equipped to analyze the market with clarity and confidence.
FAQs
Here are answers to some common questions about trendlines, offering practical insights and techniques.
Do you draw trendlines on wicks or bodies?
Trendlines can touch candlestick wicks but should avoid cutting through candlestick bodies. The goal is to connect key swing points while keeping the trend's overall structure clear.
How do you draw a trendline in trading?
Drawing trendlines helps identify support, resistance, and trading opportunities:
| Trend Type | Connection Points | Trading Use |
|---|---|---|
| Uptrend | Connect swing lows | Identify support and entry points |
| Downtrend | Connect swing highs | Spot resistance and reversal areas |
| Both Types | At least 3 touches | Confirm trend strength |
How do you draw a trendline accurately?
To ensure reliable trendlines, connect important swing points and confirm with at least three touches:
For Downtrends:
- Draw the line above the price action.
- Connect two major highs.
- Confirm with three touchpoints for added reliability.
For Uptrends:
- Place the line below the price action.
- Connect two major lows.
- Validate with three points of contact.
Consistency and proper validation are key. Tools like LuxAlgo's indicators can provide extra precision and help verify trendlines effectively.
References
- https://www.luxalgo.com/
- https://www.metastock.com/customer/resources/taaz/?p=113
- https://hmarkets.com/learn-to-trade/learning-hub/trendlines/
- https://dailypriceaction.com/blog/how-to-draw-trend-lines/
- https://www.luxalgo.com/library/indicator/Trendlines-With-Breaks/?id=IYL88A1N
- https://docs.luxalgo.com/docs/toolkits/price-action-concepts/liquidity#liquidity-trendlines
- https://i.ibb.co/m9SCmNy/Screenshot-2024-12-30-at-1-35-10-PM.png
- https://i.ibb.co/MDwszpT/trendline.png
- https://mintlify.s3.us-west-1.amazonaws.com/luxalgo/public/images/lux-pa/liquidity/image530.png


