
Learn how to accurately identify support and resistance levels to enhance your trading strategies and decision-making process.
Support and resistance levels help traders find key price zones where markets often reverse or stall. Below is an illustration of support in action:
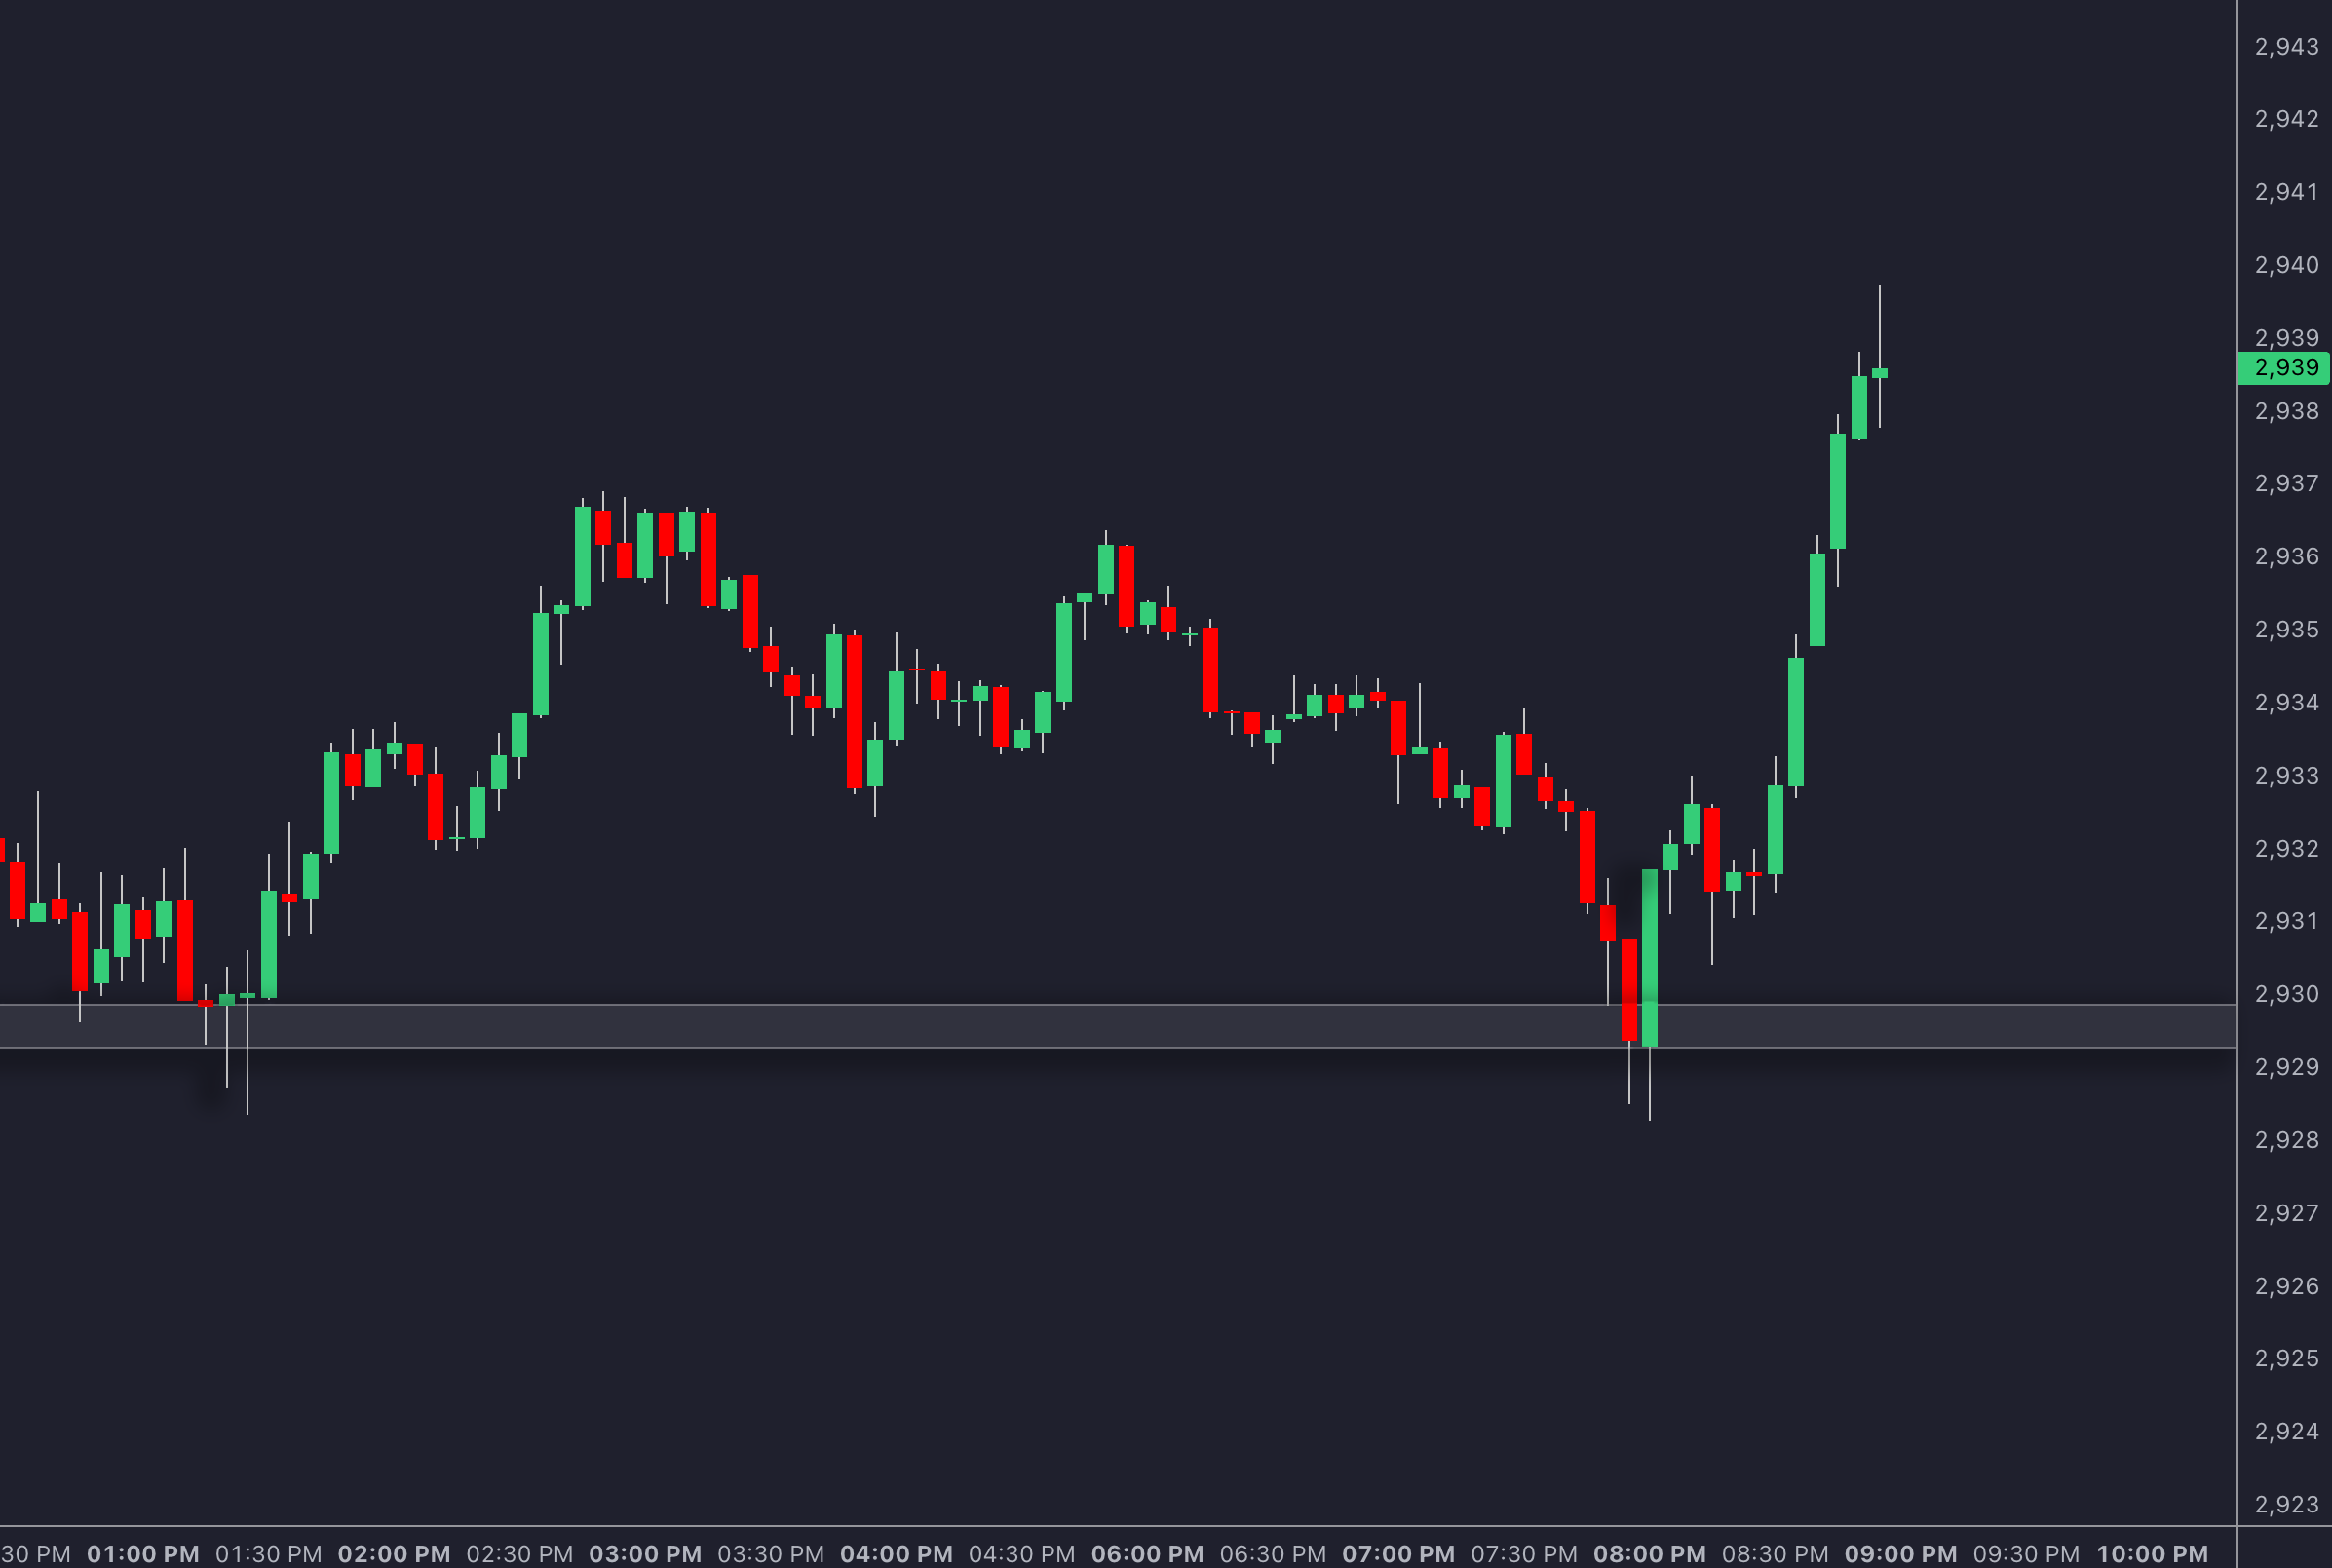
- Support: Acts as a floor where buying pressure prevents prices from falling further.
- Resistance: Acts as a ceiling where selling pressure stops prices from rising higher.
- Why It Matters: These levels guide entry, exit, and risk management decisions in trading.
How to Identify Them:
- Historical Price Action: Look for past price reversals or consolidation zones.
- Technical Indicators: Use tools like moving averages, Bollinger Bands, and trend lines for dynamic levels.
- Psychological Levels: Watch for round numbers where traders often cluster orders.
Using Them in Strategies:
- Enter trades near support or resistance with confirmation signals.
- Place stop-loss orders just beyond these levels.
- Combine them with other tools for better accuracy.
Want to refine your analysis? LuxAlgo provides hundreds of free trading indicators along with exclusive tools & an AI backtesting platform to help pinpoint these levels with AI-driven insights.
Methods for Identifying Support and Resistance Levels
To pinpoint reliable support and resistance levels, traders often combine different methods of analysis. Here's a breakdown of some key techniques used to identify these important price points.
Analyzing Historical Price Action
Looking at historical price movements can highlight key support and resistance zones. Pay attention to areas where prices have reversed significantly in the past, especially where strong price rejection, consolidation patterns, or high trading volumes are evident. For example, if a stock consistently bounces off $50, it suggests strong support, while repeated rejections at $75 indicate firm resistance.
While historical price action helps identify fixed levels, technical indicators can provide insight into shifting, more flexible zones of support and resistance.
Using Technical Indicators for Dynamic Levels
Technical indicators are useful for identifying support and resistance that evolve with market conditions. Some popular tools include:
- Moving Averages: On a 15-minute chart, moving averages can act as support during uptrends or resistance in downtrends.
- Bollinger Bands: These highlight potential breakout points and areas of support or resistance based on market volatility.
- Trend Lines: By connecting higher lows in an uptrend or lower highs in a downtrend, traders can spot dynamic levels.
Identifying Psychological Price Levels
Psychological levels, such as round numbers, often act as natural support or resistance zones because of collective trader behavior, making it easier to identify potential zones of interest.
It's worth noting that during bullish trends, support levels tend to hold more consistently due to stronger buying pressure [1][2]. Combining psychological levels with advanced tools can fine-tune trading strategies even further.
Applying Support and Resistance in Trading Strategies
After identifying support and resistance levels, the next step is using them to refine trading strategies. These levels help traders plan better entry, exit, and risk management approaches.
Trading Near Support Levels
When the price nears a support level, it's important to wait for confirmation signals before entering a long position. Key buy signals include:
- Lower selling pressure, often visible through declining volume
- Bullish candlestick patterns, such as hammers
- Positive shifts in momentum indicators
- Strong price reactions at the support level
For example, Bitcoin's $9,000 support in mid-2020 created opportunities for long trades, with prices moving toward the $10,000 resistance.
Trading Near Resistance Levels
Trading near resistance requires a focus on signs of potential reversals. Look for:
- Bearish candlestick patterns or repeated price rejections
- Overbought signals from momentum indicators
- High trading volume reflecting strong selling activity
Bitcoin's repeated reversals near $10,000 in 2020 demonstrated resistance, presenting opportunities for short-selling [3].
Setting Stop-Loss and Take-Profit Levels
Stop-loss orders should be placed just beyond support or resistance levels, while take-profit targets aim for the next significant price level. Here's a quick guide:
| Position Type | Stop-Loss Placement | Take-Profit Target |
|---|---|---|
| Long Position | Just below support | Next key level |
| Short Position | Just above resistance | Next key level |
| Breakout Trade | Near breakout level | 1.5-2x the risk distance |
For effective risk management, follow these principles:
- Limit risk per trade to a small percentage of your total capital.
- Aim for at least a 1:2 risk-reward ratio.
- Adjust your stop-loss to break-even once the trade is profitable.
By combining these principles with support and resistance strategies, traders can maintain discipline and improve their outcomes. LuxAlgo’s AI Backtesting platform helps in pinpointing the best entry and exit points using historical data.
In the next section, we'll look at how advanced tools can further refine these strategies.
Advanced Tools for Support and Resistance Analysis
Modern trading platforms have transformed how traders identify and analyze support and resistance levels. By blending traditional technical analysis with AI-powered solutions, these platforms offer greater precision and efficiency.
LuxAlgo for Support and Resistance Analysis
LuxAlgo provides hundreds of free trading indicators along with exclusive tools & an AI backtesting platform that help traders fine-tune their support and resistance strategies. Its Price Action Concepts toolkit uses pattern recognition and volume analysis to pinpoint key levels on the chart.
Here’s what sets LuxAlgo apart:
- Price Action Concepts: Identifies patterns and levels with precision.
- AI-Driven Indicators: Adjust to changing market dynamics.
- Volume Analysis Tools: Confirm the importance of support and resistance levels.
- TradingView Integration: Makes chart analysis smoother and more intuitive.
These features empower traders to refine their strategies further, especially when paired with systematic backtesting.
Backtesting and Strategy Refinement
LuxAlgo’s AI Backtesting platform allows traders to test and improve their strategies across different market environments.
Key elements of backtesting:
| Component | Purpose | Implementation |
|---|---|---|
| Historical Analysis | Test levels over various timeframes | Evaluate how strategies perform in different market phases |
| Strategy Optimization | Adjust entry and exit rules | Fine-tune settings based on past performance |
| Performance Assessment | Measure success rates and risk-reward ratios | Track overall effectiveness of the strategy |
When refining strategies, avoid over-optimization. Instead, aim for approaches that perform well across a range of market conditions. This ensures your strategy stays dependable when applied in live trading.
Free Tools for Support and Resistance
For traders looking for no-cost solutions, the Support and Resistance Levels with Breaks indicator is available for free in the LuxAlgo Library. This indicator automatically identifies key support and resistance zones, highlighting potential breakout points and validating market structure.
Conclusion and Key Takeaways
Support and resistance levels play a key role in technical analysis, helping traders decide when to enter or exit trades. By combining traditional methods with advanced solutions like LuxAlgo, traders can improve accuracy and streamline their decision-making process.
Key Points to Remember
Support and resistance levels provide straightforward setups that can yield strong results when applied correctly. Their effectiveness often hinges on three main elements:
| Component | Purpose | Best Practice |
|---|---|---|
| Price Action Analysis | Spot historical reversal zones | Focus on areas with frequent touches and high trading volume |
| Technical Indicators | Confirm dynamic levels | Use tools like moving averages and momentum indicators to validate levels |
| Advanced Tools | Improve accuracy | Utilize AI-driven platforms for pattern detection and analysis |
Using support and resistance effectively involves blending price action analysis, technical indicators, and modern solutions like LuxAlgo. These features should work alongside – not replace – your fundamental analysis for a more complete trading strategy.
FAQs
How do you find the strongest support and resistance?
The strength of support and resistance levels depends on historical price behavior and the overall market environment. Key factors include:
- Repeated Tests: Levels where the price has consistently reversed or stalled.
- High Trading Volume: Zones with noticeable trading activity often carry more weight.
- Relevance Across Time Frames: Levels that remain important across various time periods.
- Trend Alignment: Support tends to hold better in uptrends, while resistance is stronger in downtrends.
To pinpoint the most reliable levels, focus on areas where price action, trading volume, and technical indicators align. Remember, support and resistance are more like zones than exact numbers, so always consider the bigger market picture.
LuxAlgo’s AI Backtesting platform can assist in confirming these zones by analyzing multiple factors, offering a deeper technical perspective. Identifying these robust levels is key to integrating them into your trading strategies, as discussed earlier.
