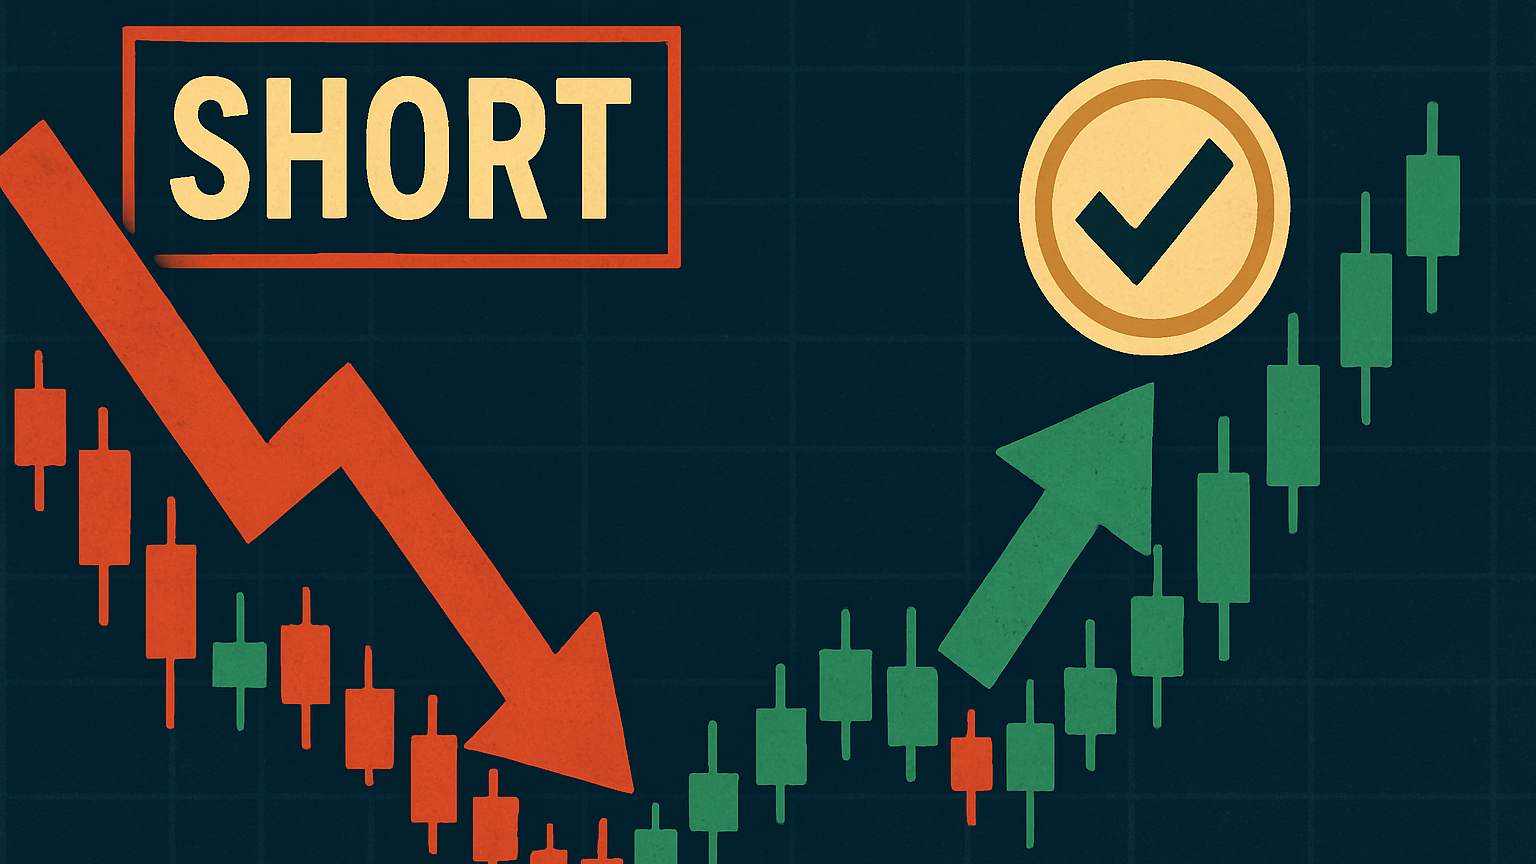
Learn how to identify and map liquidity zones and order blocks to enhance your trading strategy and improve risk management.
Liquidity zones and order blocks are key areas on a price chart where trading activity is concentrated. These zones can help you identify potential price reversals, entry/exit points, and manage risk effectively.
Key Takeaways:
- Liquidity Zones: Areas with high buy/sell orders, often near round numbers or support/resistance levels.
- Order Blocks: Price ranges created by institutional traders, leading to supply/demand imbalances.
- Why It Matters: Understanding these zones helps you trade with precision by spotting potential reversals and setting stop-loss levels.
Quick Steps to Map Zones:
- Choose Timeframe: Daily charts for trends, 4-hour for swing trades, 1-hour for intraday setups [3].
- Identify Indicators: Look for volume spikes, sharp price reversals, or strong price rejection.
- Validate Zones: Check price reactions, volume consistency, and multi-timeframe alignment.
- Use Tools: Combine manual analysis with automated solutions like LuxAlgo’s PAC Toolkit for accuracy.
Mapping these zones effectively can improve your trading strategy by offering clarity on market structure and institutional activity. Let’s dive deeper into the methods and tools to help you get started.
How to Identify Best Order Blocks to Trade
Finding Liquidity Zones and Order Blocks
Both manual analysis and automated solutions play a role in spotting key trading zones. Let’s break down how to use both approaches effectively.
Manual Detection Methods
When analyzing charts manually, look for these indicators:
Volume Patterns
- Areas where prices consolidate with rising volume.
Price Action Signals
- Large candlesticks with short or no wicks.
- Zones of price rejection accompanied by high volume.
Tools for Automated Detection
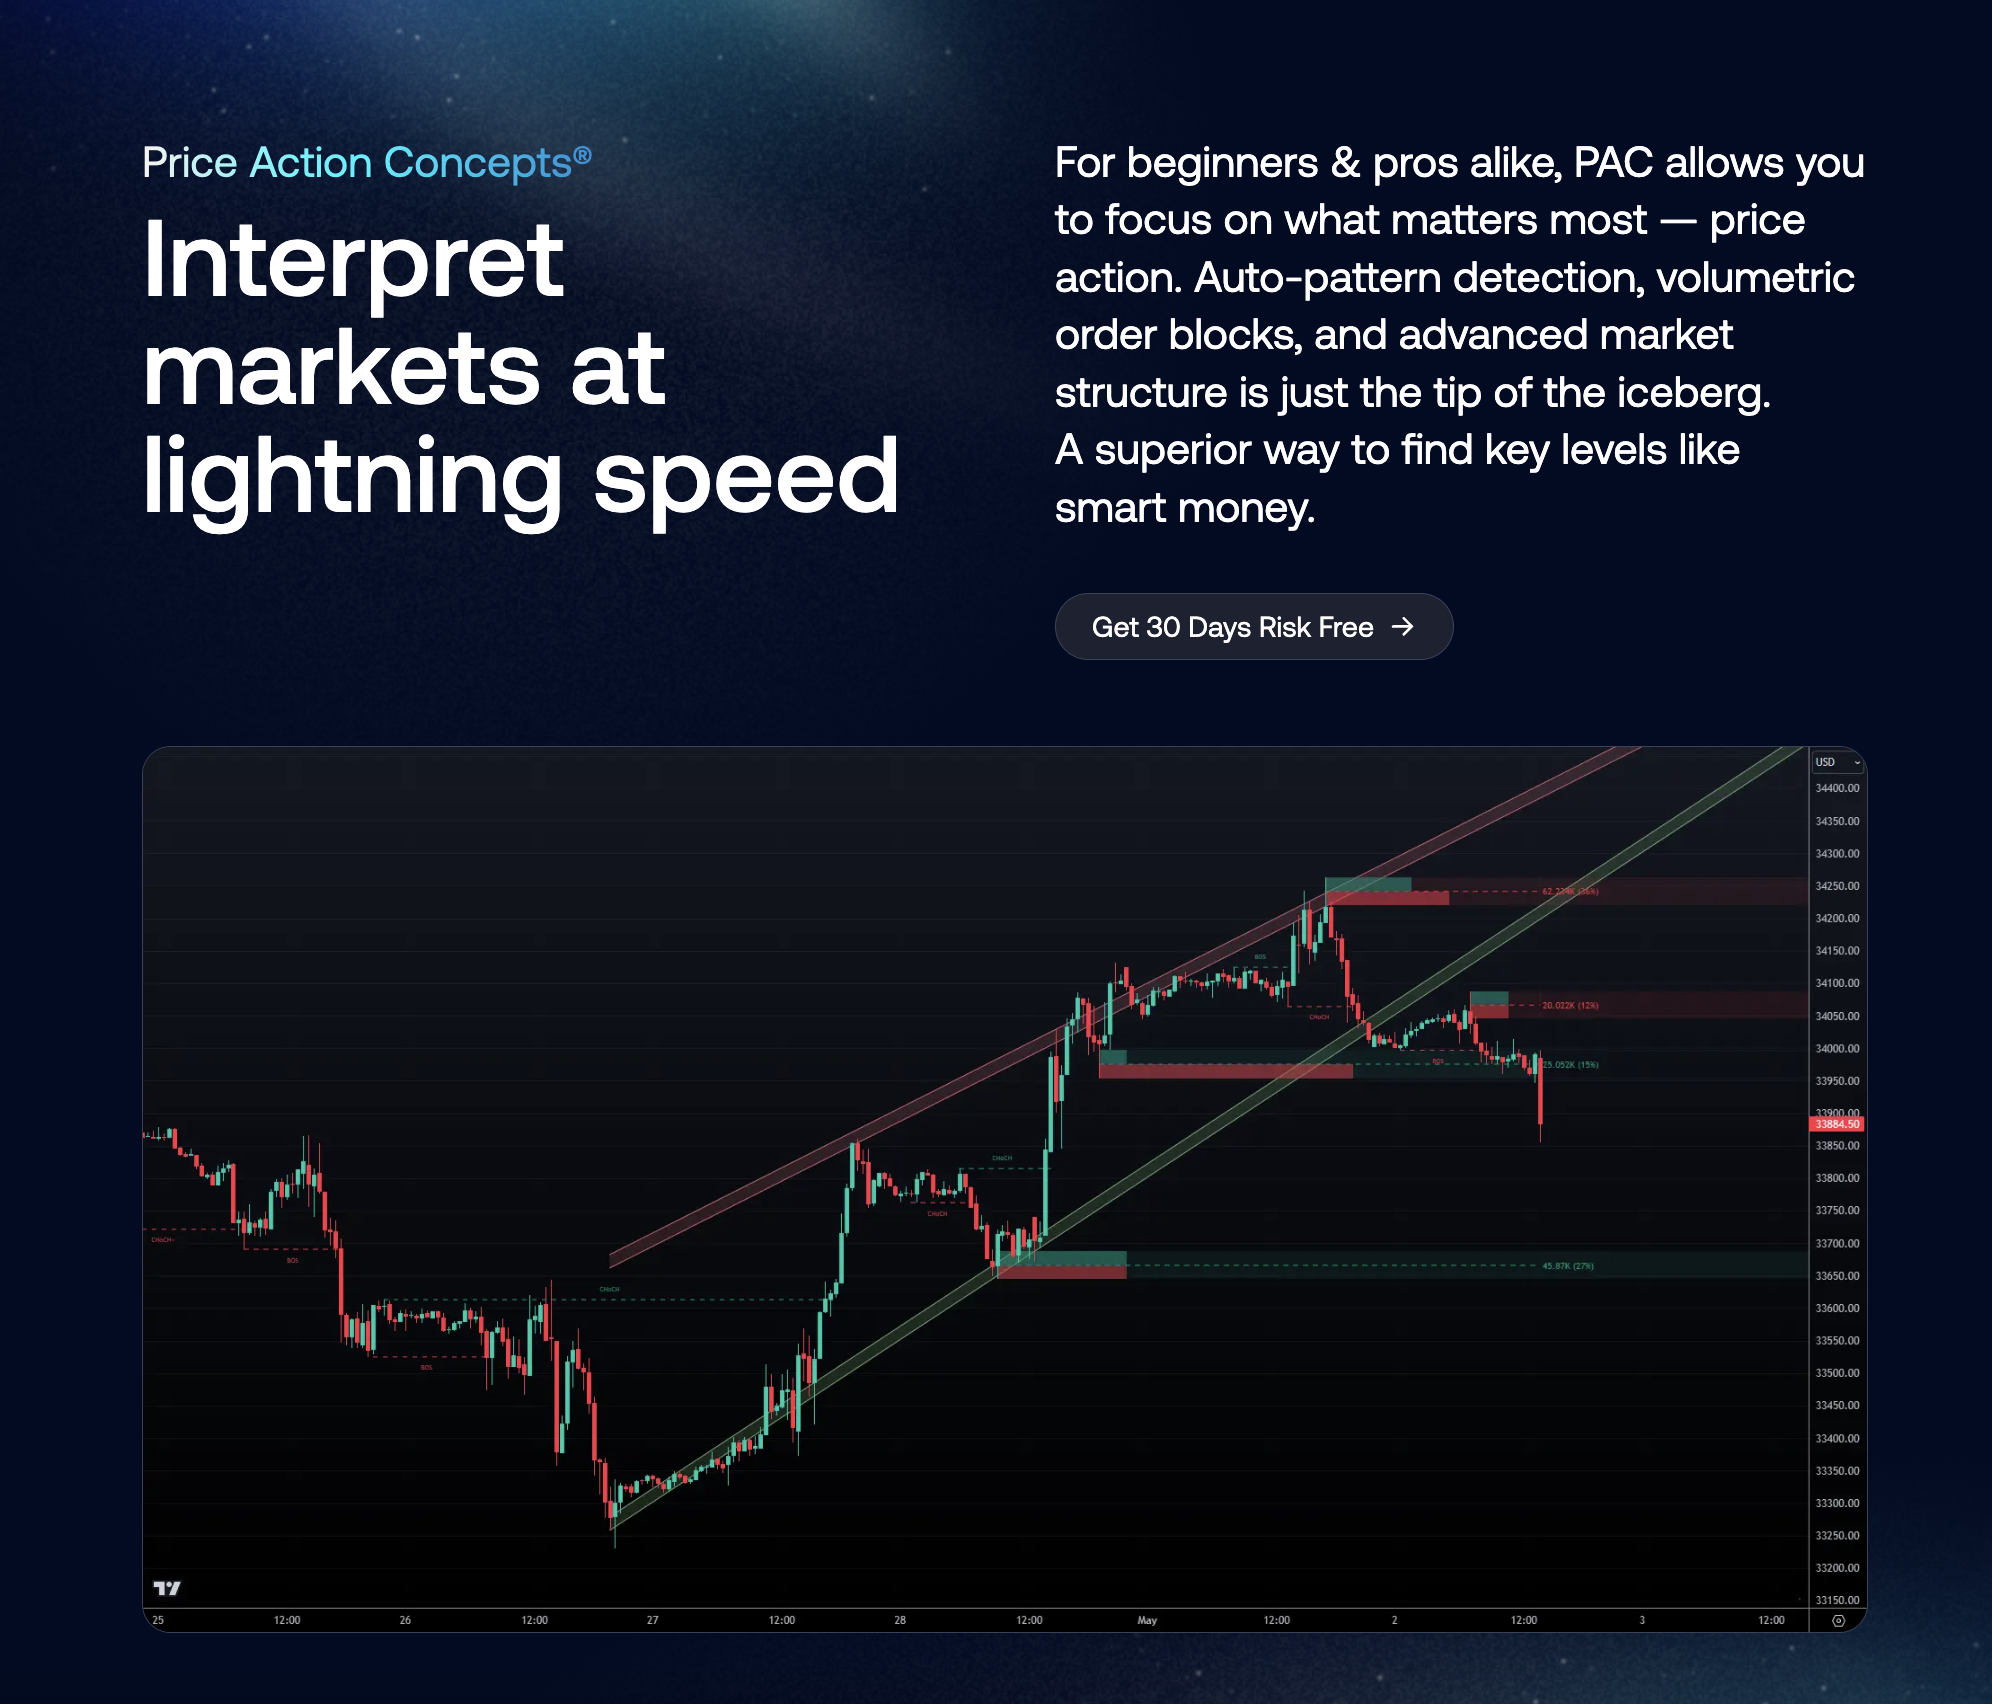
Automated solutions can save time and improve accuracy. One standout option is LuxAlgo's Price Action Concepts (PAC) Toolkit. Here’s what it offers:
Key Features
- Real-time identification of high-volume order blocks.
- Market structure analysis with advanced insights.
- Pattern recognition across different timeframes.
- Visual overlays that highlight critical zones.
The PAC Toolkit scans multiple assets, providing objective results and dynamic updates.
For the best results, combine automated detection with manual validation. This approach balances the speed of automation with the context provided by human analysis.
When validating zones, focus on:
- Volume consistency.
- Alignment across multiple timeframes.
- How prices have reacted to these zones historically.
4 Steps to Map Trading Zones
Once you've identified potential zones using manual or automated methods, here’s how to map them effectively on your charts.
1. Choose the Right Timeframe
Use daily charts for broader institutional zones, 4-hour charts for swing trades, and 1-hour charts for more precise intraday setups [3].
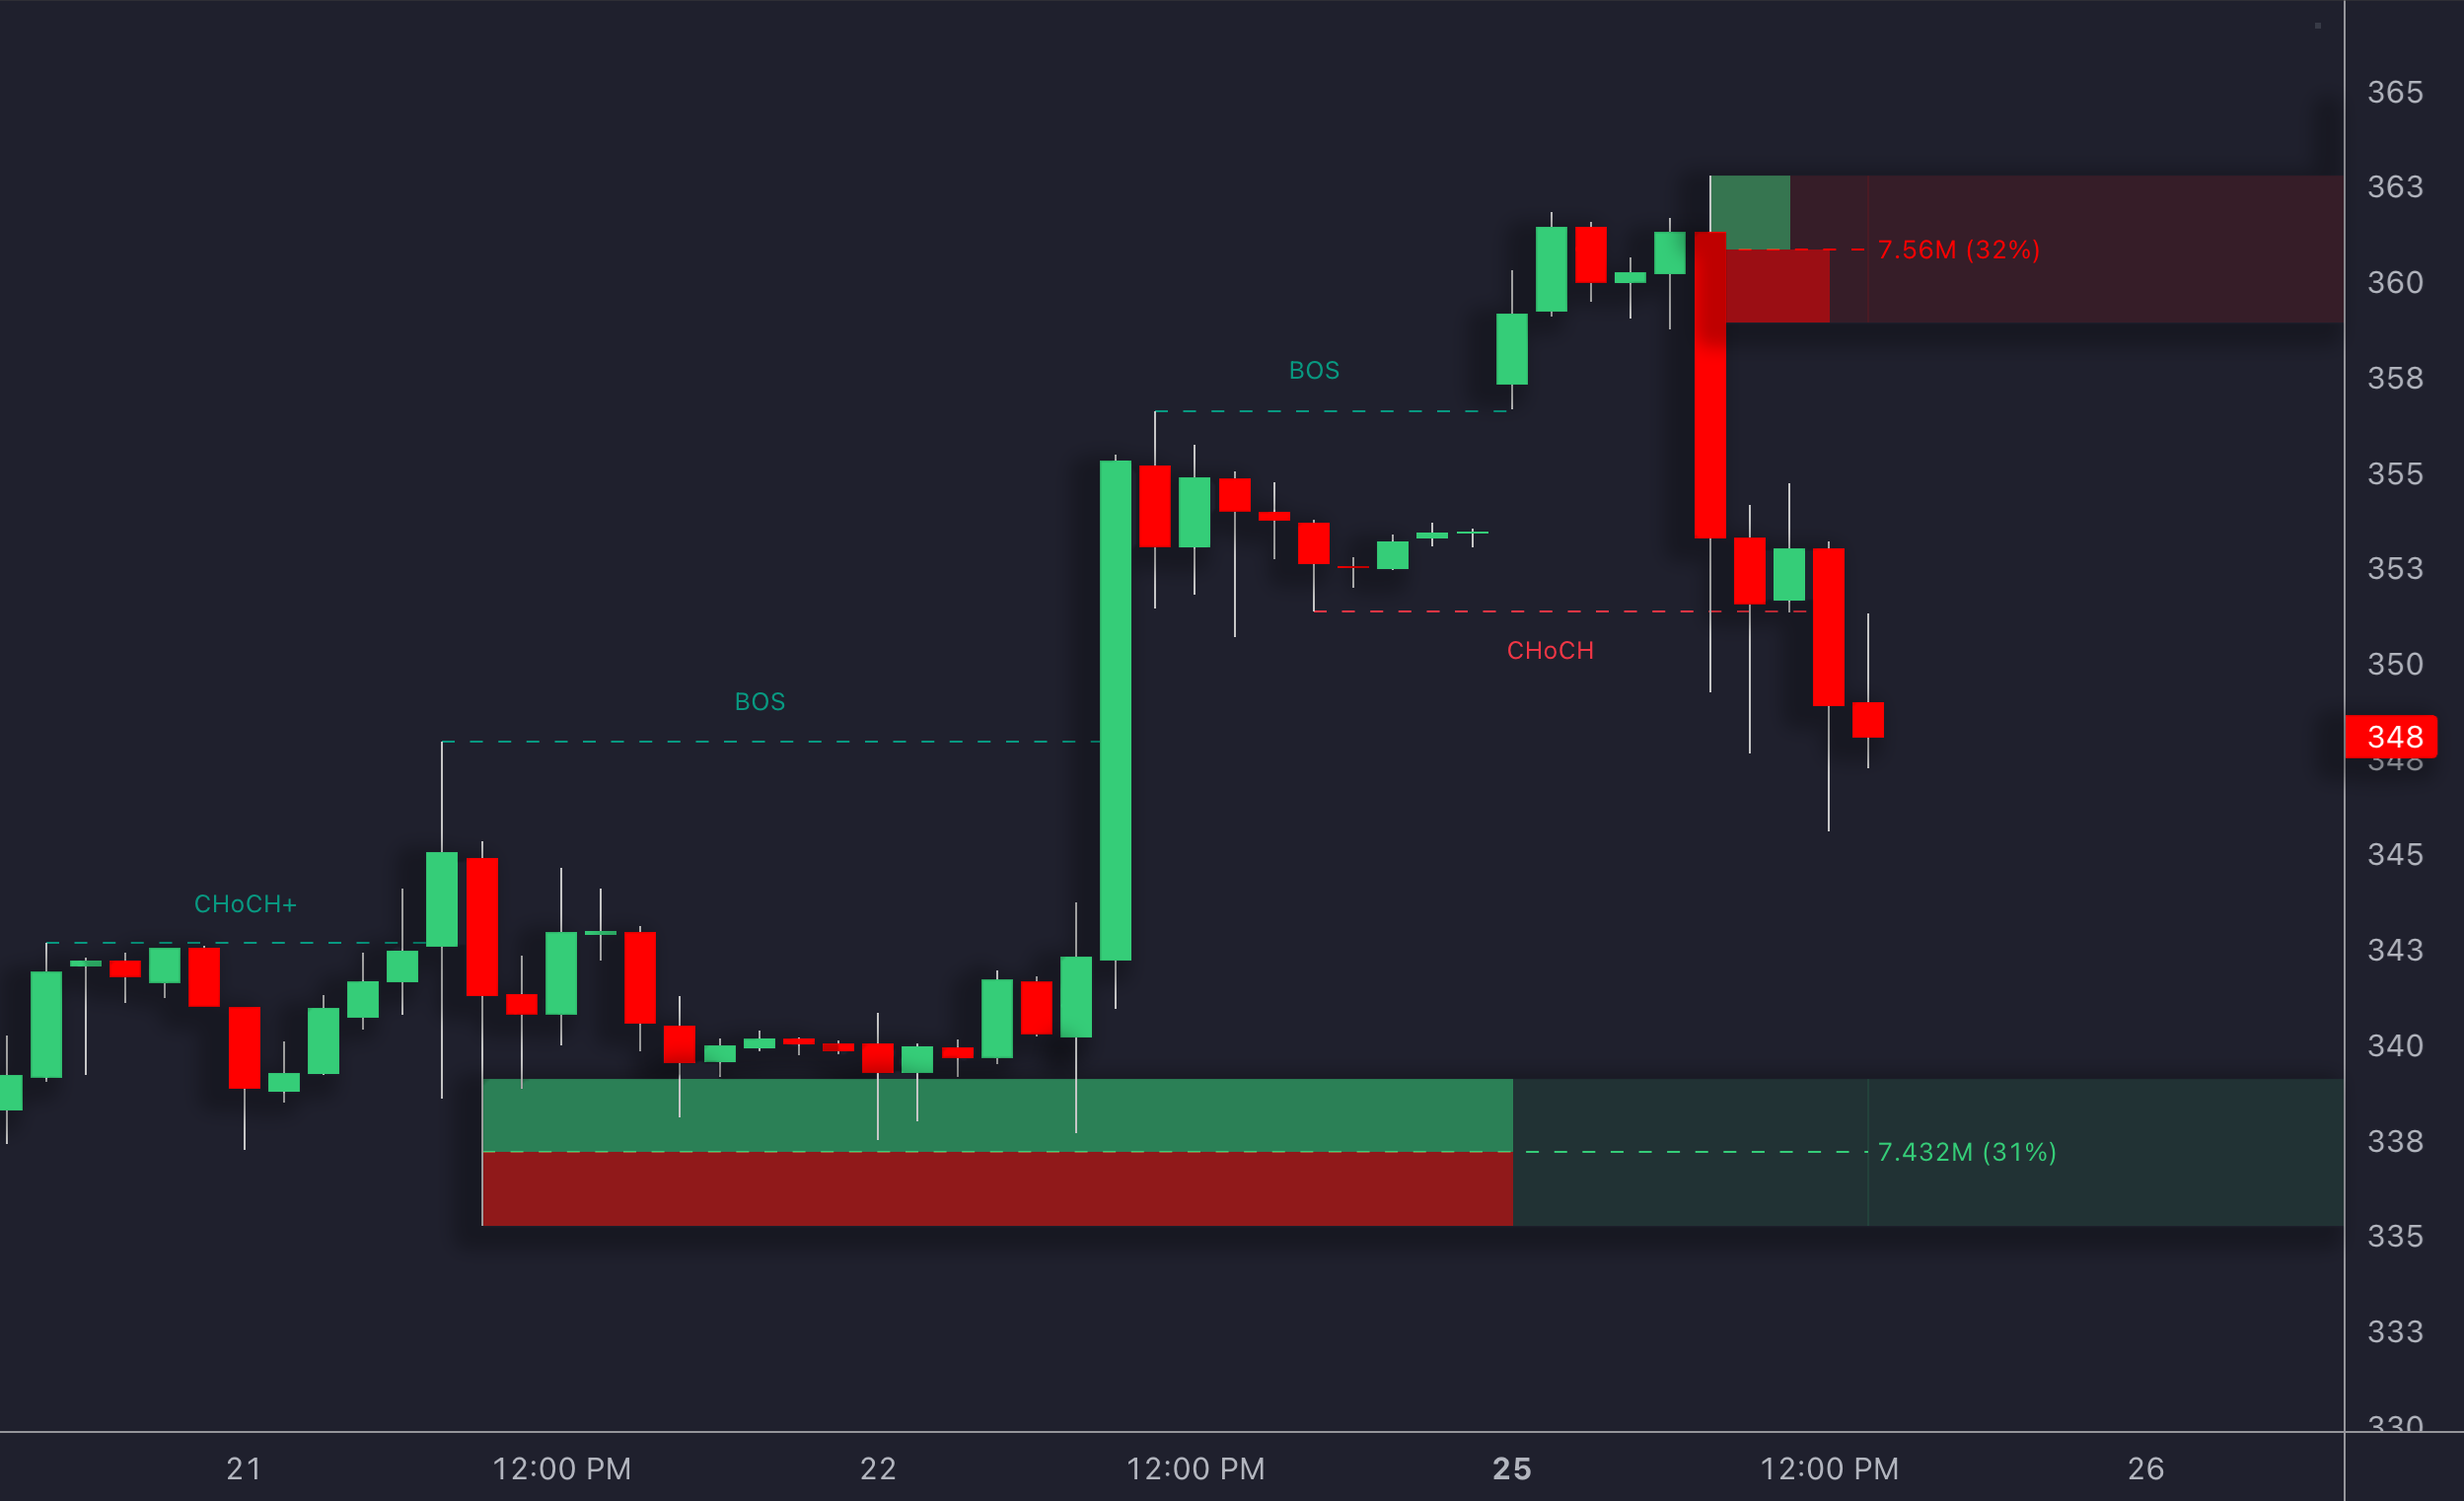
2. Mark and Test the Zones
When defining your trading zones, focus on these key indicators:
- Strong price rejections
- High volume nodes
- Noticeable delta imbalances
To confirm the validity of a zone, observe:
- How price behaves when retesting the zone.
- Volume spikes during interactions with the zone.
- Whether support turns into resistance (or vice versa).
A reliable zone usually shows consistent reactions over time.
3. Assess Zone Strength
Give priority to zones that align across multiple timeframes, show high volume clusters, and have repeated price interactions [3].
Once your zones are mapped and evaluated, the next step is to test them using price action signals and set appropriate risk parameters.
Zone Testing and Risk Control
Once you've mapped potential zones, it's time to confirm their validity. Here's how you can use specific signals and risk parameters to refine your approach:
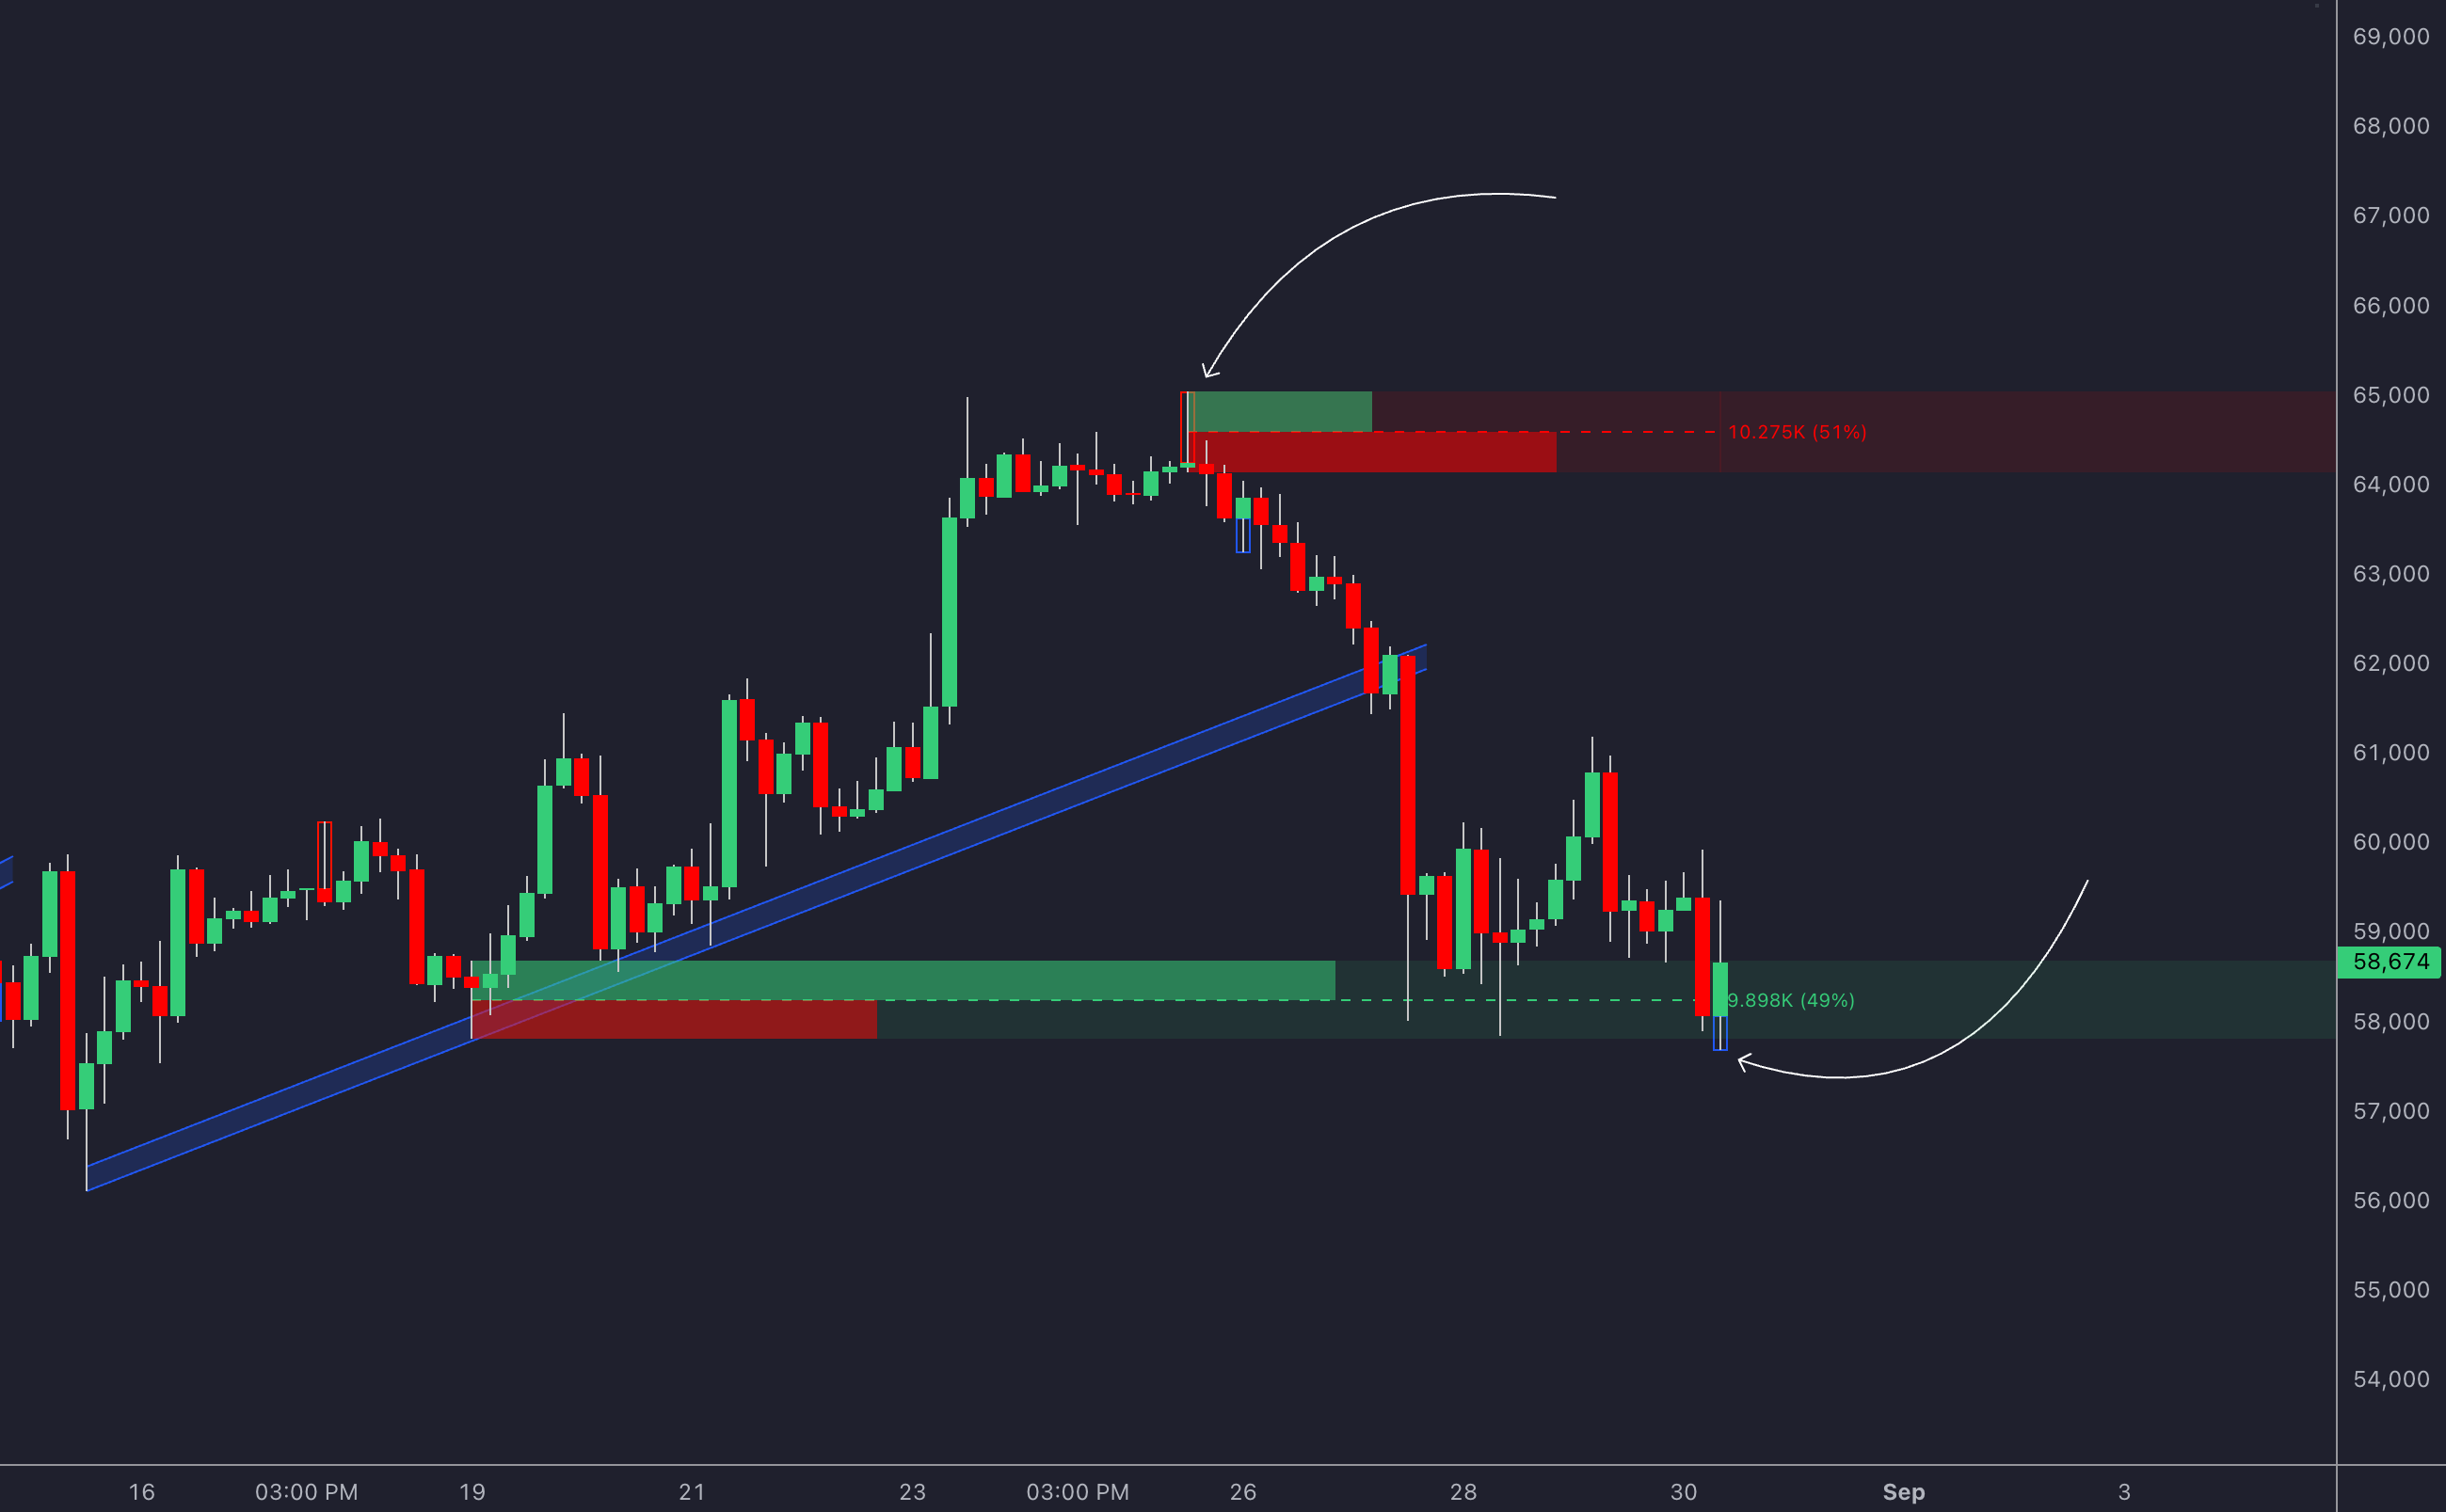
Price Action Signals
The best zones often exhibit certain telltale signs:
- Long rejection wicks at the edges of the zone [1]
- Volume spikes when price interacts with the zone [2]
- Alignment with institutional order blocks [3]
These signals work hand-in-hand with the zone identification techniques we've covered earlier.
For a deeper dive, solutions like LuxAlgo's Price Action Concepts (PAC) provide features like volumetric order block analysis and advanced market structure detection to enhance your analysis.
Risk Management Rules
When trading zones, follow these guidelines to manage your risk effectively:
| Parameter | Guideline | Implementation Tip |
|---|---|---|
| Position Size | Risk only 1-2% of your capital per trade | Ensures you can test zones multiple times [9] |
| Stop Loss | Place stops beyond the zone boundary, adding a buffer | Accommodates normal price fluctuations [5] |
| Reward-to-Risk | Aim for at least a 2:1 ratio | Keeps trades profitable, even with lower win rates [9] |
| Daily Loss Limit | Cap losses at 3-5% of your account per day | Helps avoid emotional overtrading [9] |
Advanced Mapping Methods
Expanding on single-asset zone testing, multi-market analysis offers a broader perspective by examining order blocks across related instruments. This method improves the accuracy of identified zones through cross-checking.
The LuxAlgo Price Action Concepts also include innovative features such as the liquidity grab, which identifies sudden liquidity voids in the market, and the liquidity trendline, which dynamically highlights these shifts. These features empower traders to pinpoint potential reversal points and shifts in market momentum with precision. Learn more about these features in the Liquidity Grabs documentation and Liquidity Trendlines documentation.
Summary
Effectively mapping liquidity zones and order blocks hinges on understanding key technical principles and following reliable methods. These strategies are most effective when applied systematically, as outlined in the earlier four-step process.
Main Points
To map zones accurately, traders need to recognize institutional activity patterns and understand market structure. Order blocks highlight areas where significant buying or selling pressure occurred, often signaling potential trend reversals or continuations [4][3]. These zones offer several strategic benefits:
Advanced Applications
LuxAlgo's Price Action Concepts (PAC) toolkit simplifies zone mapping by automating detection while allowing for customization. With this solution, traders can:
- Quickly analyze multiple assets and timeframes.
- Spot subtle patterns that might go unnoticed with manual analysis.
- Confirm zones using algorithmic insights, as shown in the multi-asset analysis section.
- Incorporate volume profile analysis for greater precision.
By combining automated solutions with manual techniques, traders can improve mapping accuracy, blending algorithmic speed with a deeper understanding of market dynamics.
Risk Considerations
- Avoid relying solely on a single timeframe [9]
- Assess the broader market context before making trading decisions [1][3]
- Wait for clear confirmation signals before entering trades [1][8]
- Use proper position sizing and follow risk management guidelines.
FAQs
How do I mark an order block?
To identify an order block, start by spotting a strong price movement. For a bullish order block, look for the last bearish candle before a sharp upward move. Mark the zone from the low to the high of this bearish candle. For a bearish order block, do the reverse – find the last bullish candle before a strong downward move and mark the zone accordingly.
How can I spot liquidity zones in trading?
Liquidity zones are areas where significant trading activity occurs. You can recognize them by:
- High trading volume and periods of price consolidation.
- Repeated price tests of the same level.
- Strong price reactions when the zone is revisited.
- Historical support and resistance levels.
These characteristics align with volume-based validation methods mentioned earlier [6].
What timeframes work best for order blocks?
Daily and weekly charts are often the most reliable for identifying order blocks [7]. These higher timeframes:
- Highlight institutional activity more clearly.
- Filter out market noise.
- Provide dependable signals.
- Offer a better view of market structure.
Daily charts are ideal for swing traders, while weekly charts suit position traders. This approach aligns with the mapping strategies discussed in Step 1 of the core methodology.
How do order blocks differ from liquidity zones?
Here are the main differences:
- Origin: Order blocks are tied to institutional orders, while liquidity zones reflect broader market activity.
- Precision: Order blocks focus on specific levels, whereas liquidity zones cover wider areas.
- Formation: Order blocks form after consolidation and a sharp move, while liquidity zones can emerge under various conditions [12].
What is an order block zone?
An order block zone represents areas where institutions accumulate or distribute assets. These zones are marked by tight price consolidation followed by a strong price move, often confirmed by volume patterns [12].
Free Tools from LuxAlgo to Detect Liquidity Zones
LuxAlgo offers a complimentary indicator designed to help traders identify liquidity zones effortlessly. The Liquidity Pools indicator automatically detects areas of concentrated liquidity, giving you an edge in pinpointing potential entry and exit points. This free tool is available on TradingView and integrates seamlessly with your chart analysis.
Explore the indicator on TradingView here.