Learn to trade market gaps effectively by combining gap types with candlestick patterns for better price direction predictions.
Want to trade market gaps effectively? Here's how:
Gaps occur when prices jump between trading sessions, leaving a blank space on the chart. By combining gap types with candlestick patterns, you can predict price direction, assess risks, and improve your trading strategy.
Key Takeaways:
-
4 Types of Gaps:
- Common Gaps: Random, high fill probability, low trading value.
- Breakaway Gaps: Start new trends, confirmed with high volume and patterns like Bullish Engulfing.
- Runaway Gaps: Mid-trend continuation signals, often paired with Three White Soldiers.
- Exhaustion Gaps: End of trends, signal reversals with patterns like Doji.
-
Candlestick Patterns for Confirmation:
Use patterns like Bullish Engulfing, Three White Soldiers, and Doji to confirm gaps and predict price movement. -
Key Trading Steps:
- Identify gap type and confirm with volume.
- Set entry near the gap edge using candlestick signals.
- Define profit targets and stop losses based on gap size and volatility.
-
Tools to Simplify Analysis:
LuxAlgo provides exclusive features—including automated gap detection, volume analysis, and an AI Backtesting Assistant—to enhance your decision-making.
Bottom Line: Pair gap types with candlestick patterns and volume analysis to maximize your trading edge while managing risks effectively.
Understanding Gaps: Common, Breakaway, Runaway, and Exhaustion Gap
4 Main Types of Gaps
There are four main types of gaps in trading, each requiring a different approach when analyzing candlestick patterns.
Gap Types and Definitions
Common Gaps are the most frequent and occur under normal market conditions. However, they rarely offer strong trading opportunities due to their unpredictable nature.
Breakaway Gaps mark the start of new trends, forming at the end of price patterns or consolidation phases. These gaps are especially noteworthy when accompanied by a sharp increase in trading volume [1][2]. For example, Apple Inc. (AAPL) gapped from $159.30 to $165.25 with trading volume 250% above the average. Confirmation of such gaps often comes from bullish engulfing patterns.
Runaway Gaps, also called measuring gaps, appear during strong trends and are usually located near the midpoint of the price movement [1]. They typically feature above-average trading volume and act as continuation signals, indicating the trend still has momentum.
Exhaustion Gaps are seen toward the end of trends and often hint at potential reversals. These gaps are marked by volume spikes and usually follow a series of runaway gaps [1][2]. Traders should approach these gaps with caution, as they often signal significant trend changes. Reversal patterns like doji can help confirm exhaustion gaps.
Gap Type Comparison Chart
| Characteristic | Common Gap | Breakaway Gap | Runaway Gap | Exhaustion Gap |
|---|---|---|---|---|
| Formation | Random occurrence | End of consolidation | Mid-trend | End of trend |
| Volume | Low to normal | High | Above average | Very high |
| Fill Probability | High | Low | Medium | Medium to high |
| Trading Signal | Limited value | Start of new trend | Trend continuation | Potential reversal |
| Risk-Reward Ratio | Poor | Excellent | Good | Moderate |
| Target Basis | Quick fill | Pattern projection | Measured move | Reversal confirmation |
Using candlestick patterns alongside gap types can improve trading signals. For instance, pairing breakaway gaps with bullish engulfing patterns or exhaustion gaps with doji formations can lead to more reliable trade entries.
Candlestick Patterns for Gap Confirmation
Best Candlestick Patterns for Gaps
When analyzing gaps, certain candlestick patterns can help traders separate meaningful signals from market noise. These patterns align with the characteristics of the four gap types discussed earlier.
For Breakaway Gaps, pay attention to Bullish Engulfing patterns for upward gaps and Bearish Engulfing patterns for downward gaps. These patterns occur when a candle engulfs at least 150% of the previous candle's body [1][2].
Runaway Gaps often pair well with the Three White Soldiers pattern for bullish trends or the Three Black Crows pattern for bearish trends. These patterns are characterized by candles of consistent size and minimal wicks, showcasing strong directional momentum [1][3].
The Upside Tasuki Gap pattern is a strong indicator for bullish continuation. This forms when a long green candle gaps up, followed by a red candle that opens within the green candle’s body and closes below its open but above the gap [3].
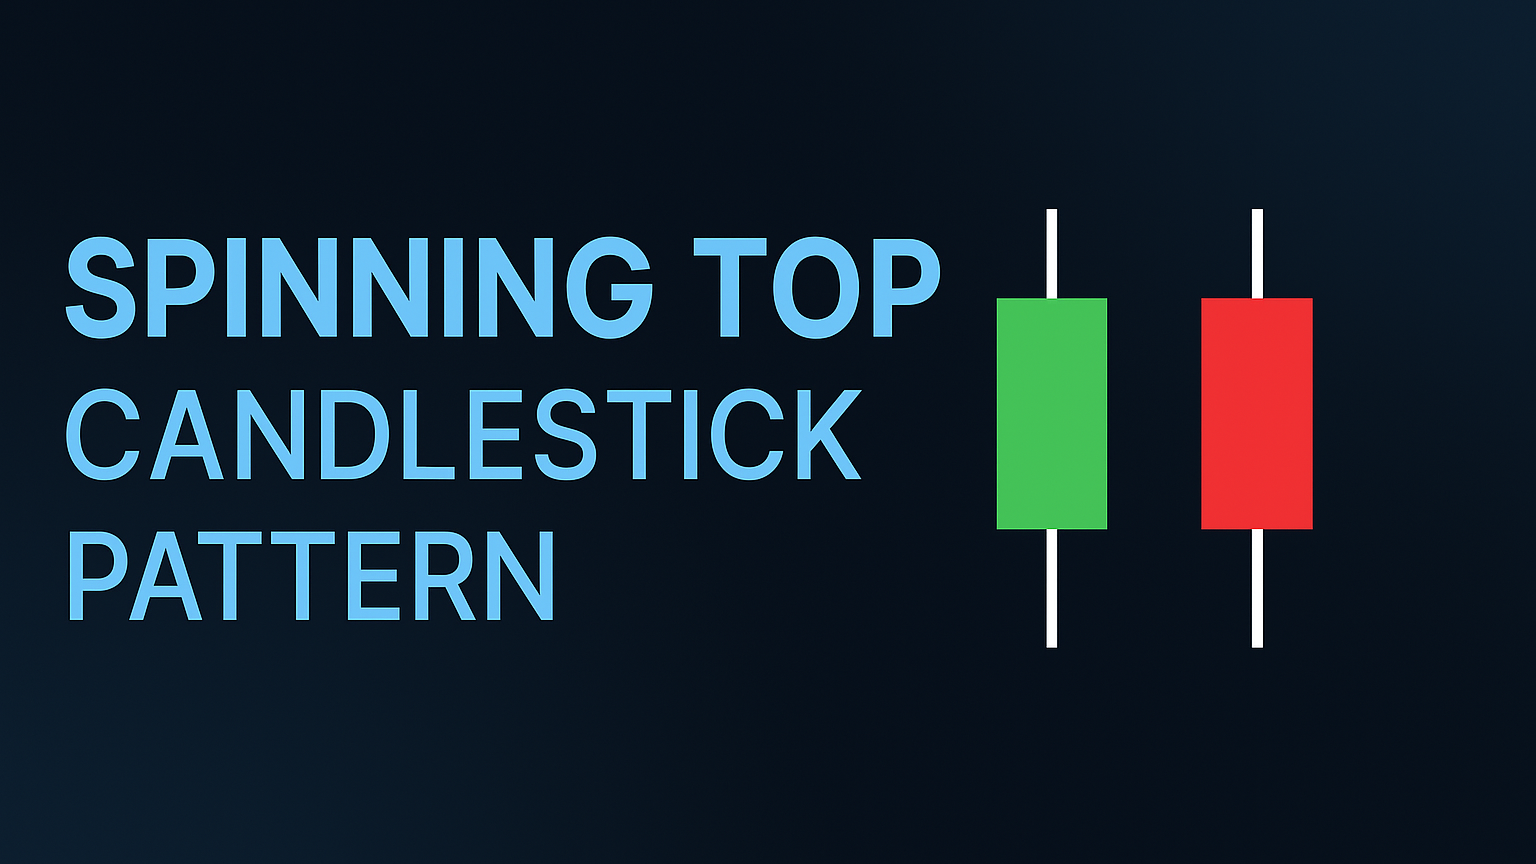
For Exhaustion Gaps, look for Doji or Spinning Top patterns, especially when paired with high trading volume. These patterns often signal potential reversals [1][2].
| Gap Type | Primary Confirmation Patterns | Volume Requirement | Pattern Size Requirements |
|---|---|---|---|
| Breakaway | Bullish/Bearish Engulfing | High volume | Engulfing candle ≥150% |
| Runaway | Three White Soldiers/Black Crows | Above average | Similar-sized candles |
| Exhaustion | Doji, Spinning Top | Very high | Body spans ≤5% of total range |
Pattern Confirmation Rules
To effectively use candlestick patterns in gap trading, consider these key confirmation steps:
Volume Analysis
Volume plays a critical role in confirming gaps. Look for noticeable volume increases, especially with breakaway gaps [2][4].
Pattern Formation Requirements
For hammer patterns, the shadow should be at least twice the length of the candle’s body, with the body positioned in the upper third of the range [1]. Doji patterns are valid when the opening and closing prices are within 5% of each other [1][2].
Multi-Timeframe Validation
Check patterns across different timeframes to ensure consistency [2].
Support/Resistance Levels
Ensure patterns align with key support or resistance levels for stronger confirmation [4].
Gap Trading Steps and Position Management
Gap Trade Entry Methods
Once you've identified the gap type and confirmed it with candlestick signals, consider these entry strategies:
Wait for the price to pull back to the gap area, then look for a reversal candlestick pattern near the gap's edge. The best entries often occur when the price tests the gap boundary while aligning with the broader trend. A study of 1,000 gap trades found that entries confirmed within the first 30 minutes of market open had a 62% win rate[1].
Setting Profit Targets
Base your profit targets on the size of the gap, and consider using multiple exit levels to lock in gains:
| Target Level | Exit Percentage |
|---|---|
| First Target (1x gap size) | Exit 50% |
| Second Target (1.5x gap size) | Exit 30% |
| Final Target (2x gap size) | Exit 20% |
For example, if there's a $2 gap (from $50 to $52), the first target would be $54 (1x gap size). Once the first target is hit, activate a trailing stop at 1x the Average True Range (ATR). Adjust your targets if reversal patterns appear before reaching the expected levels[1][2].
Stop Loss and Risk Rules
Your stop loss and position size should depend on the type of gap:
- Breakaway Gaps: Place stops below the pre-gap consolidation area.
- Runaway Gaps: Set stops just under the previous day's low.
- Exhaustion Gaps: Use tighter stops within the gap area.
Always place stops beyond key levels identified through confirmation patterns. For position sizing, aim to risk 1-2% of your account balance per trade. Use this formula:
Position Size = (Account Risk) / (Distance to Stop Loss)
For instance, with a $100,000 account risking 1% ($1,000) and a $1 stop distance, you would trade 1,000 shares. If gap volatility exceeds the asset's 20-day average, adjust your position size accordingly[1][2].
Tools for Price Action Analysis
LuxAlgo Price Action Imbalances Feature
LuxAlgo’s Price Action Concepts toolkit includes a robust imbalances feature that automatically detects market inefficiencies created by disparities between supply and demand. These imbalances often highlight areas where price is likely to revert, acting as potential support and resistance zones for traders.
The toolkit detects the following imbalances:
- Fair Value Gaps (FVG): Formed by a sequence of three candles where the outer candle wicks do not overlap the central candle body. Bullish FVGs occur when the current price low is higher than the high from two bars ago, while bearish FVGs form when the current price high is lower than the low from two bars ago.
- Inverse Fair Value Gaps (Inverse FVG): These indicate areas where a previous FVG has been mitigated, offering potential retest zones.
- Double Fair Value Gaps (Double FVG): Also known as Balanced Price Ranges, these occur when two FVGs overlap, creating a new area of imbalance.
- Volume Imbalance: Identified when adjacent candles have non-overlapping bodies but overlapping wicks, suggesting a significant volume discrepancy.
- Opening Gap: A gap that occurs at market open due to a lack of trading activity, indicating a sudden shift in supply and demand.
These imbalances not only serve as markers for potential price reversals but also help in defining key levels for trade entries and exits. With built-in alerts, traders can stay informed in real time when these imbalances occur.
LuxAlgo and TradingView Setup

To apply the gap trading and price action strategies discussed, you’ll need to activate three essential features:
- Gap Detection Indicator: Use LuxAlgo’s automated feature to identify gaps across your chosen timeframes.
- Volume Analysis Overlay: Add volume indicators to confirm the strength of identified gaps.
- Custom Alert Settings: Set up alerts to notify you of gap formations and price action imbalances that meet volume confirmation criteria.
Summary
Traders can create a structured approach to technical analysis and risk management by pairing the gap trading framework with candlestick confirmation signals. Each type of gap—breakaway, exhaustion, or runaway—calls for its own set of trading parameters and risk strategies.
To make the most of gaps and candlestick patterns, focus on well-known formations like dojis, hammers, and engulfing patterns, which offer clear confirmation signals. When managing risk, consider using the gap size to set up a 1:2 risk-to-reward ratio.
LuxAlgo provides hundreds of free trading indicators along with exclusive features and an AI Backtesting Assistant, streamlining the execution of these trading strategies.