How to Use Parabolic SAR in Trading Strategies
Parabolic SAR turns price movement into a sequence of trend and trailing-stop reference levels. To use it in a trading strategy, define when a signal becomes actionable, how a stop is updated, and how much you can lose if the fill is worse than expected.
You can explore Parabolic SAR in the LuxAlgo Library, use it on native charts, and work with Quant to build and test explicit rules. A plotted dot is an analytical level; it does not place or amend a broker order by itself.
Read the Dots Before Trading the Signal
In the indicator’s upward state, dots appear below price; in its downward state, they appear above. A change of side marks a stop-and-reverse event in the calculation. It does not establish that a lasting market reversal has begun.
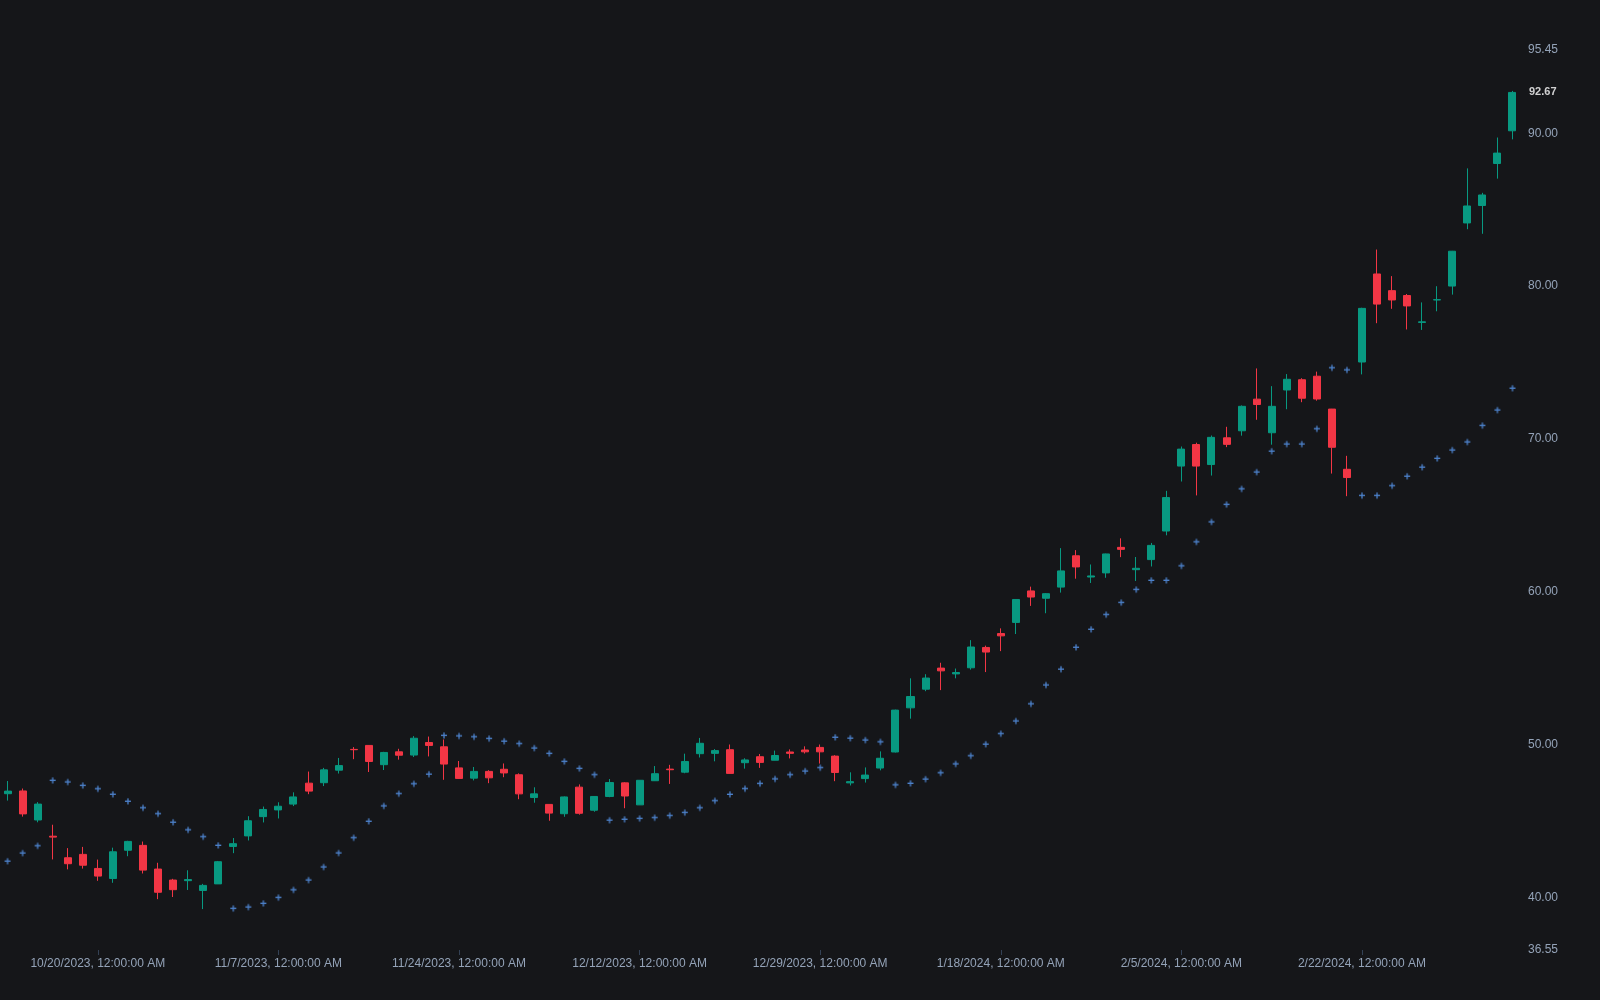
Choose how your strategy responds to a flip. An always-in-market system exits and reverses, whereas a long-only system can exit and remain in cash. A filtered system may ignore entries that fail an additional condition. These choices produce different exposures and should be tested separately.
Understand the Calculation and Acceleration
A simplified update moves the prior SAR toward the trend’s extreme point: prior SAR + prior acceleration factor × (prior extreme point − prior SAR). The extreme is the highest high in an upward run or lowest low in a downward run. New extremes increase acceleration up to a cap.
The complete algorithm also handles reversals, initialization, and constraints involving the previous two bars’ highs or lows. The formula alone is not a complete implementation. TradingView’s technical reference documents its calculation, including its use of price penetration rather than a mandatory closing-price crossover.
This means you must distinguish the indicator’s own reversal event from a strategy that waits for a completed candle before acting. A strategy with close confirmation may receive a different fill from one using a resting order at a previously known SAR level.
Set Start, Increment, and Maximum Separately
The reference configuration uses a start of 0.02, an increment of 0.02, and a maximum of 0.20. Start sets initial acceleration; increment controls its increase after a new extreme; maximum limits it. Interfaces may use different labels, so record all three values.
| Adjustment | Effect to investigate | Tradeoff |
|---|---|---|
| Higher start or increment | A more aggressive trail toward price | Earlier exits can include ordinary pullbacks |
| Lower start or increment | A slower trail | More room can mean more profit given back |
| Higher maximum | More acceleration once the old cap would bind | The difference depends on the trend path |
| Different chart interval | Different bars and signal timing | Settings and costs need a separate test |
Do not assume cryptocurrency needs higher acceleration to reduce noise, or that a lower setting makes a ranging market safe to trade. Start with a documented baseline and compare a limited set of alternatives. Keeping a default is reasonable when the evidence does not justify changing it.
Define an Entry and Exit Strategy
Here is a hypothetical long-only specification you can evaluate:
- Wait for a completed bar showing a new upward SAR state.
- Enter at the next available price under an explicit order assumption, such as the next bar’s open.
- Use the confirmed SAR below the entry as the initial stop reference, with any buffer defined in advance.
- While the upward state remains valid, raise the protective stop when the eligible reference rises; never lower it to increase the trade’s risk allowance.
- Exit according to the protective order or your specified reversal rule. Remain flat until another qualifying entry.
If a bearish flip moves the dot above price, it is no longer a valid protective sell-stop level for an existing long. Handle that transition as an exit decision, rather than blindly copying every new dot. A short strategy needs mirrored order logic and its own execution assumptions.
Choose the stop-update timing before testing. Updating after every completed chart bar and updating every several hours are different rules. An arbitrary timetable based only on an asset’s label can leave the order out of step with the signal.
Work Through the Risk in Numbers
Suppose a hypothetical share trade enters at $50, with a confirmed SAR of $48.50 and a chosen $0.10 buffer. The initial stop is $48.40, giving a $1.60 entry-to-stop distance. With a $200 risk budget and an additional $0.05 allowance per share for costs, quantity is floor($200 / $1.65) = 121 shares. Planned loss including that allowance is $199.65.
If a later eligible SAR is $49.20, the same buffer produces a $49.10 stop. If it reaches $50.30, the stop becomes $50.20. Neither a plotted level nor a positive stop price guarantees a profit: gaps, slippage, and fees affect the outcome.
For futures or forex, use the contract’s point or pip value, valid size increments, and account-currency conversion. Check buying power and aggregate exposure as well. CME’s position-sizing guidance explains the connection between stop distance and quantity, while the SEC’s stop-order bulletin explains why stops can fill beyond their trigger.
Evaluate Filters Without Assuming Improvement
One candidate is to allow long SAR flips only when price is above a selected moving average. Another is to require RSI above a specified level. A trend-strength measure such as ADX is also a possible filter, but a fixed threshold is not a universal boundary between tradable trends and ranges.
Test the unfiltered strategy first, then add one condition at a time. A filter can remove both winners and losers. Compare changes in trade count, average outcome, drawdown, time in the market, and costs, rather than judging it only by win rate.
For multiple timeframes, use only higher-timeframe information available at the decision point. Do not let the final value of an unfinished daily bar influence an earlier intraday entry. Keep the chosen data source and session consistent across comparisons.
Build and Review the Strategy With Quant
Open the Library indicator on LuxAlgo’s native charts and describe the intended rules to Quant. Include long-only or two-way trading, confirmation timing, entry fills, stop updates, buffers, and sizing. Review the code and inspect example trades before interpreting the backtest.
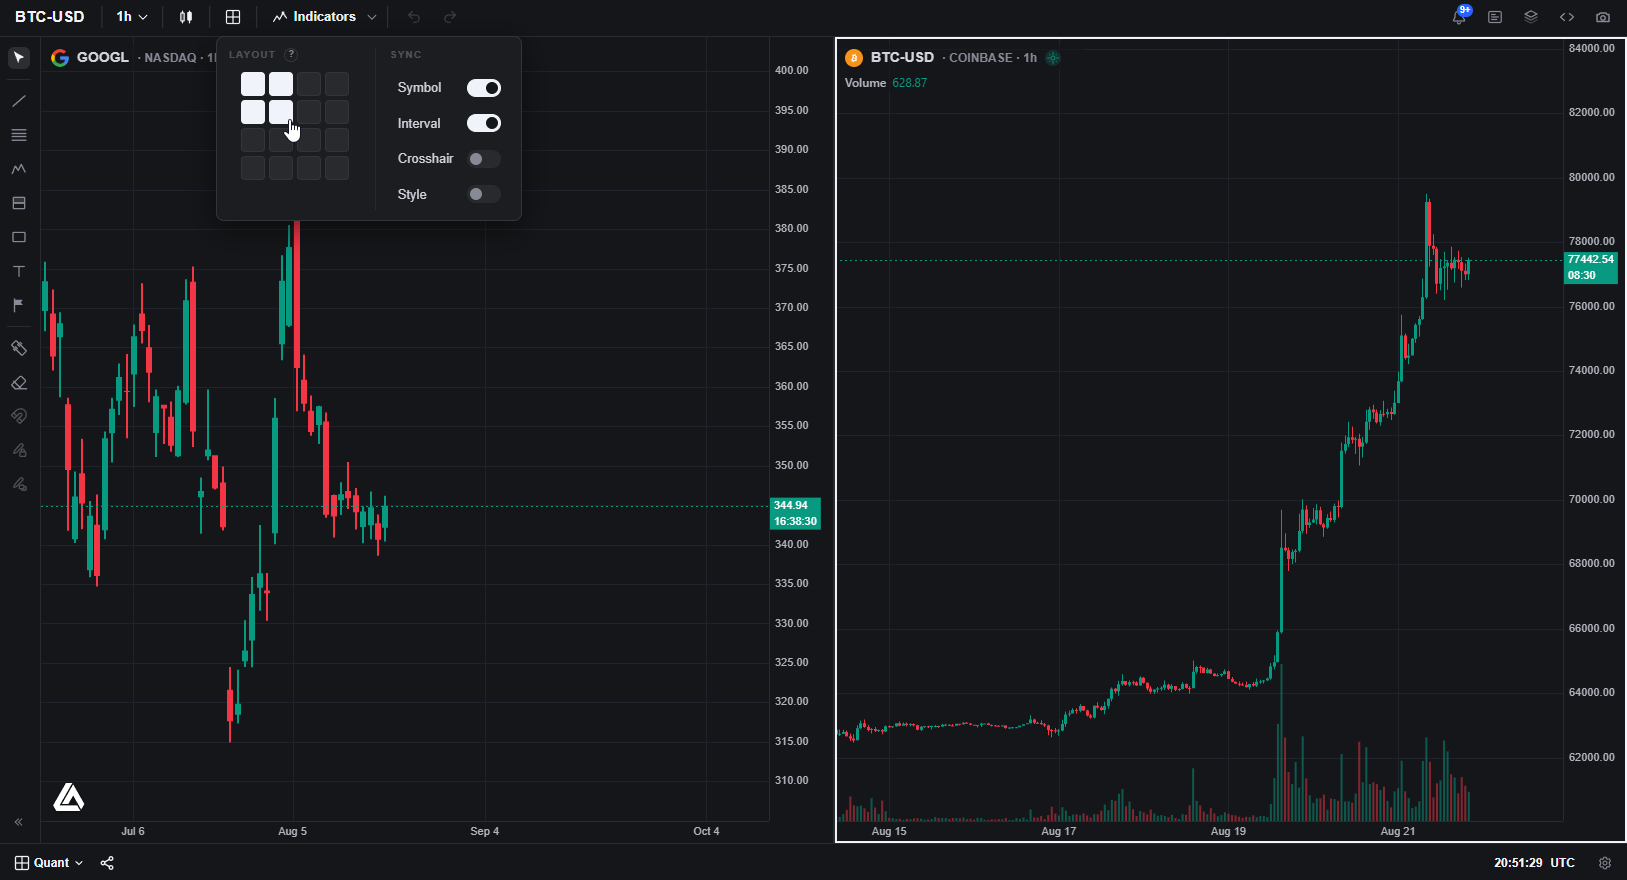
Set realistic commissions and slippage, and check trades around gaps and bars that touch multiple order levels. Compare results on a later period excluded from parameter selection. Keep the strategy logic, symbol, timeframe, inputs, and test properties with each saved result. Our out-of-sample testing guide explains why that separation matters.
Quant is a coding and research workflow. A generated strategy or an alert is not proof of a working live execution connection. If you use notifications, verify the actual trigger and delivery separately; broker-side order placement and amendments require their own supported integration and testing.
LuxAlgo’s separate TradingView toolkits and open-source Library indicators serve different purposes. Do not assume a toolkit reproduces your SAR rules, exposes every internal value for combination, or automatically synchronizes a trailing stop with your broker.
Video: Parabolic SAR Explained
TradingView’s tutorial explains the indicator and its settings. Apply the concepts to the implementation you use, then check your own strategy’s order timing and risk assumptions.
FAQs
How to use Parabolic SAR for trading?
Define how a change in the indicator’s state becomes an entry or exit, choose confirmation and fill timing, and size the trade from a valid stop distance. A flip can be an exit-only event; taking the opposite position is a separate strategy choice.
What are the best parameters for Parabolic SAR?
There is no universally best parameter set. Compare a documented baseline with a small number of alternatives on the intended market and timeframe, including costs and a later validation period. More aggressive settings do not automatically improve results.
How to use Parabolic SAR as a trailing stop?
Use an eligible dot on the protective side of the position, apply a consistent buffer if required, and update the actual order according to a defined schedule. Tighten protection without widening risk, and handle a direction flip explicitly. The dot itself does not manage a broker order.
Read next