
Learn how to effectively use the stochastic oscillator in both trending and ranging markets to identify key trading signals and improve your strategies.
The stochastic oscillator is a momentum indicator that helps traders identify overbought and oversold conditions or potential trend reversals. Its signals vary depending on whether the market is trending or ranging:
- In trending markets: Focus on trend continuation by watching pullbacks into the 40-60 zone or divergences for possible reversals. Use slower settings like 14,3,3 for smoother signals.
- In ranging markets: Prioritize overbought/oversold levels (above 80 or below 20) to spot reversals near support or resistance. Faster settings like 5,3,3 work better for quick moves.
Quick Comparison
| Aspect | Trending Markets | Ranging Markets |
|---|---|---|
| Stochastic Settings | Slower (14,3,3) | Faster (5,3,3) |
| Key Signals | Continuation, Divergence | Reversals at Extremes |
| Key Levels | 40-60 for pullbacks | 20/80 for reversals |
| Stop Loss | Wider stops | Tighter stops |
| Trade Duration | Longer-term | Short-term |
To improve accuracy, combine stochastic signals with tools like ADX (for trend strength) or support/resistance levels (for range confirmation). Adjust settings based on market type and always confirm signals with price action.
Simple Stochastic Indicator Strategy Guide for Different Market Conditions
Trading Trends with Stochastic
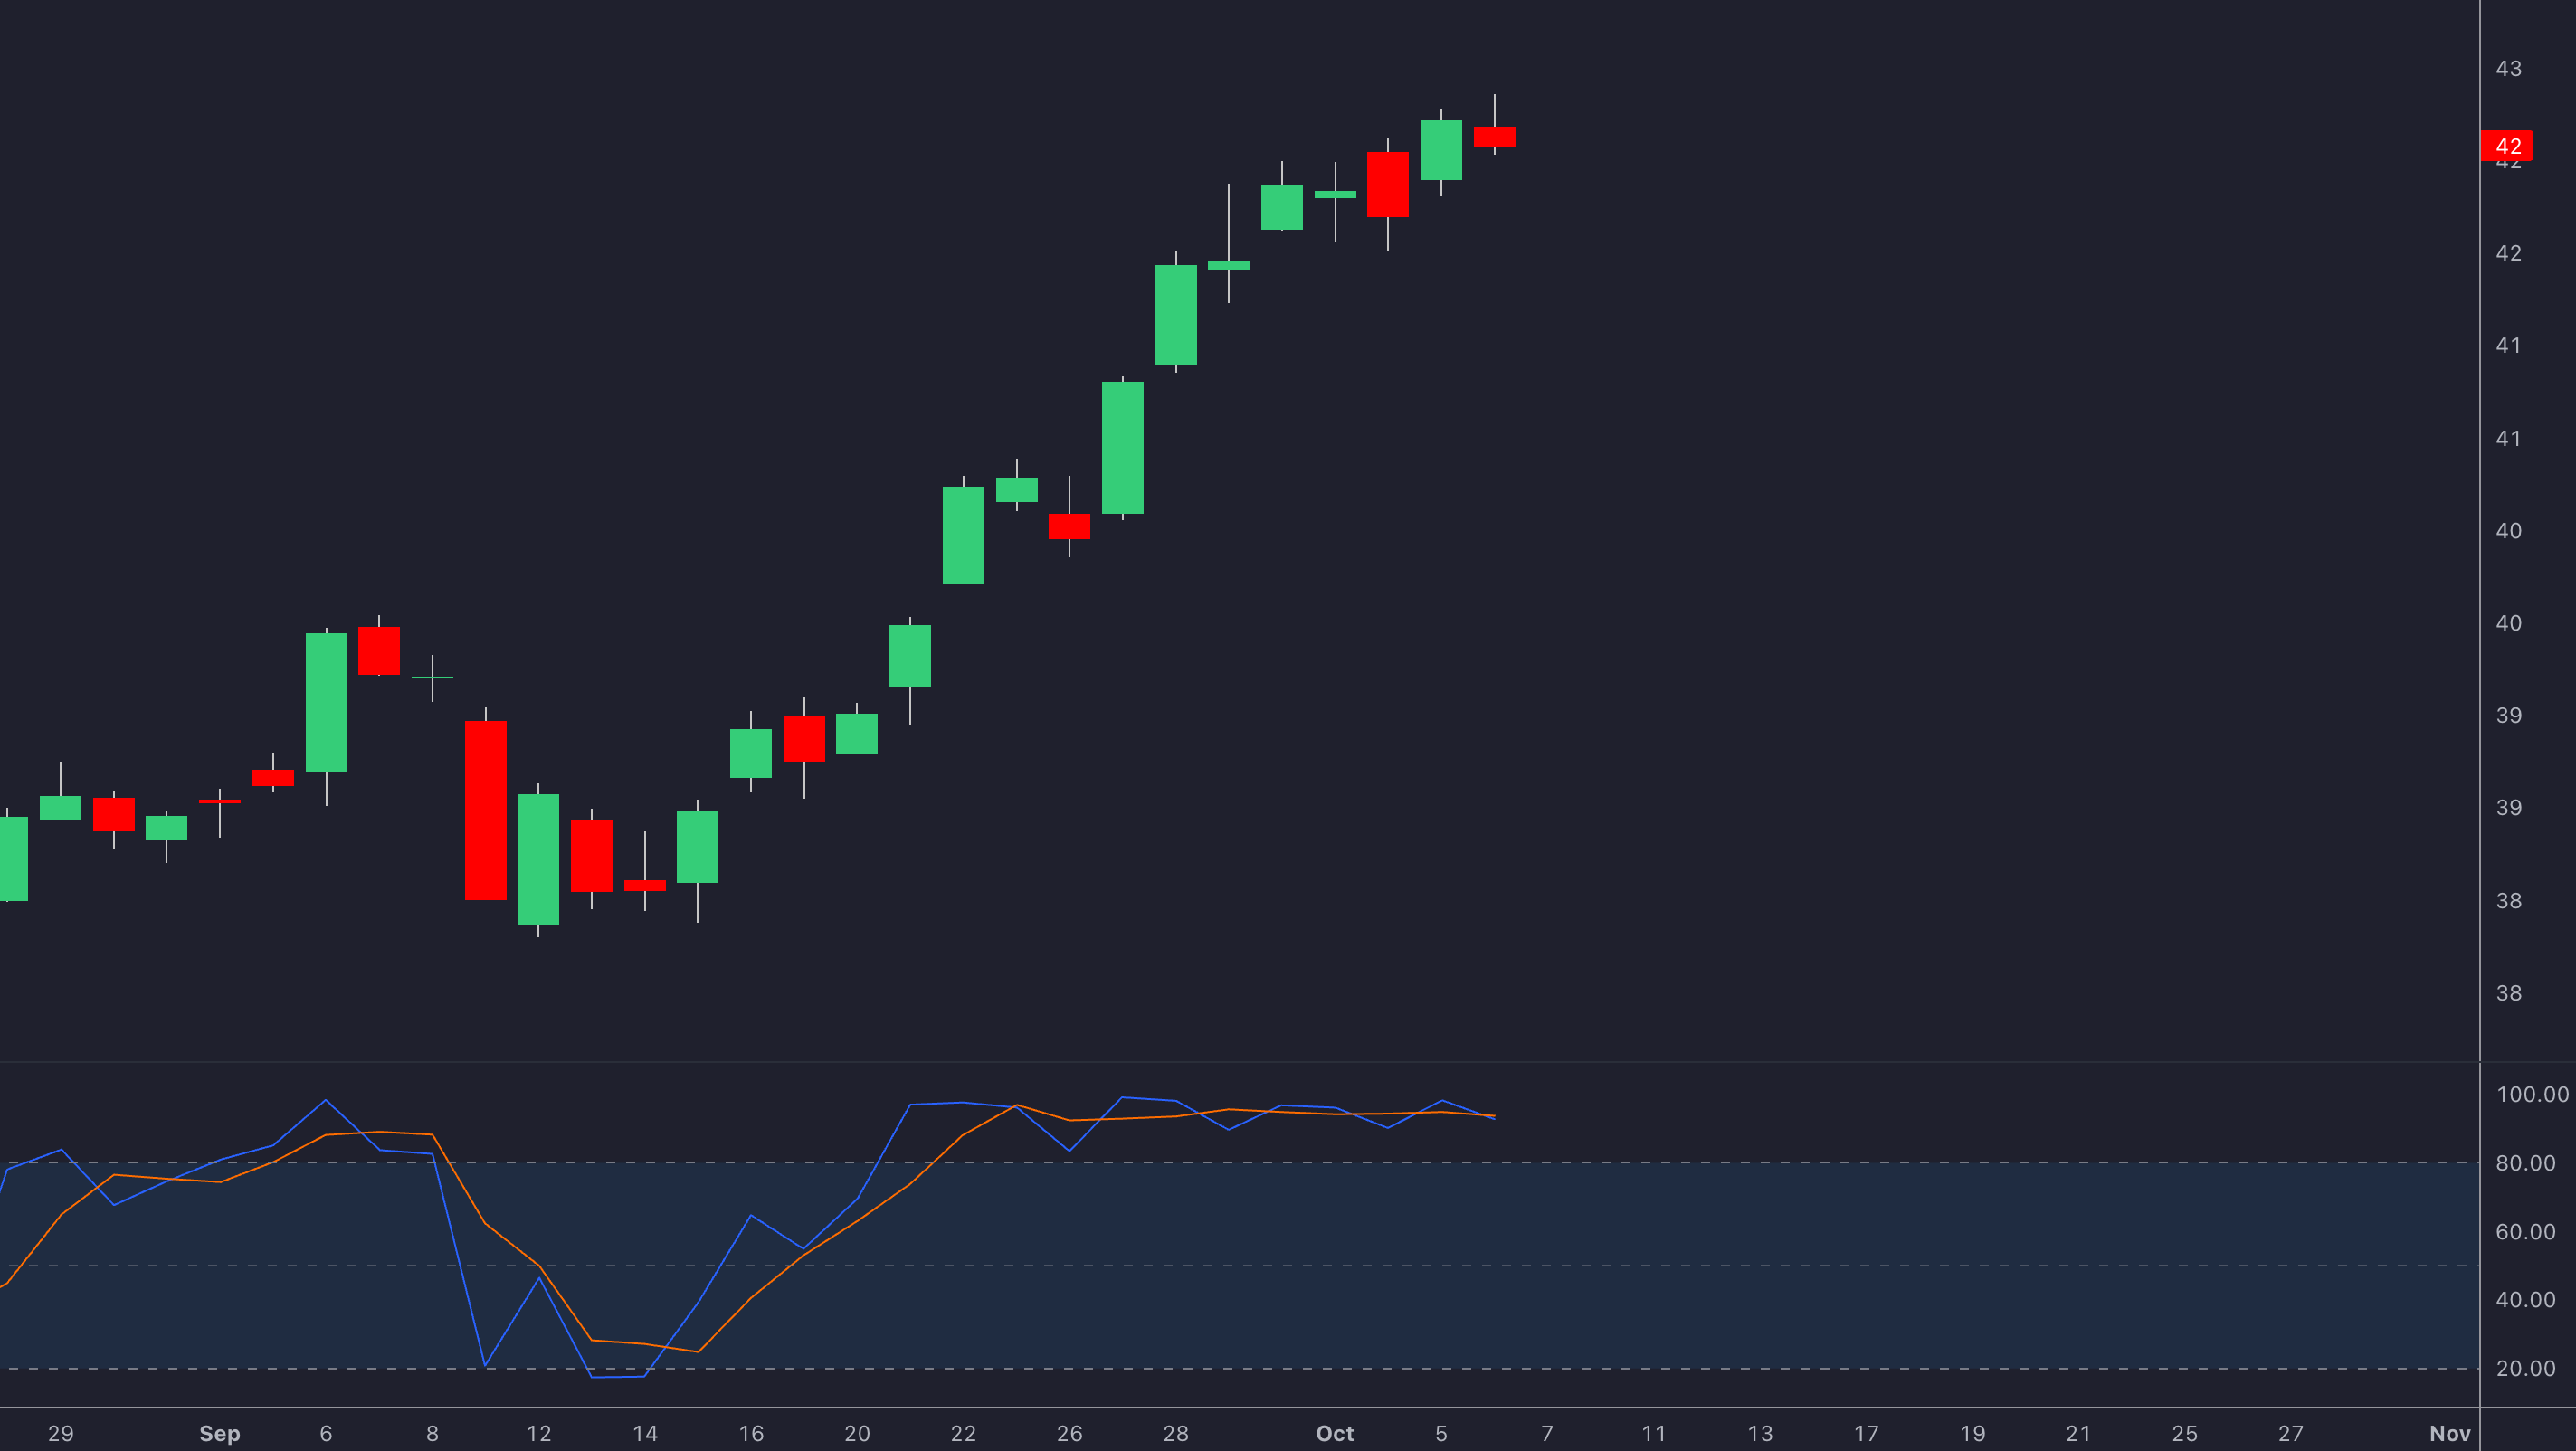
When markets are moving strongly in one direction, the stochastic oscillator needs to be interpreted differently than in sideways or ranging markets. This adjustment aligns with the concepts introduced earlier.
Trend Continuation Signals
In trending markets, the usual overbought (above 80) and oversold (below 20) levels tell a different story. During a strong uptrend, the stochastic may stay above 80 for an extended period, and in a downtrend, it can remain below 20. Instead of signaling reversals, these extreme readings often highlight the strength of the trend.
| Signal Type | Uptrend | Downtrend |
|---|---|---|
| Entry Points | Pullbacks to the 40-60 zone | Rallies to the 40-60 zone |
| Continuation | Stays above 80 | Stays below 20 |
| Momentum | Higher lows in oscillator | Lower highs in oscillator |
The key is to watch for pullbacks into the 40-60 range. When %K bounces back in the direction of the main trend, it often signals a continuation.
Spotting Trend Reversals
Divergences between price and the stochastic oscillator can signal potential trend reversals:
- Bearish Divergence: If the price makes higher highs but the stochastic forms lower highs, it could indicate weakening upward momentum[4].
- Bullish Divergence: When the price creates lower lows but the stochastic shows higher lows, it suggests a possible loss of downward pressure[4].
Adding Trend Confirmation
To strengthen your analysis, combine stochastic signals with these tools:
- Moving Averages: Long-term moving averages, like the 50-day or 200-day, can confirm the overall trend direction[2].
- ADX Integration: An ADX reading above 25 confirms that the trend has solid strength[5].
These methods are particularly useful in trending markets, offering a contrast to the strategies used in ranging markets, where overbought and oversold levels play a bigger role. We'll dive into those approaches next.
Trading Ranges with Stochastic
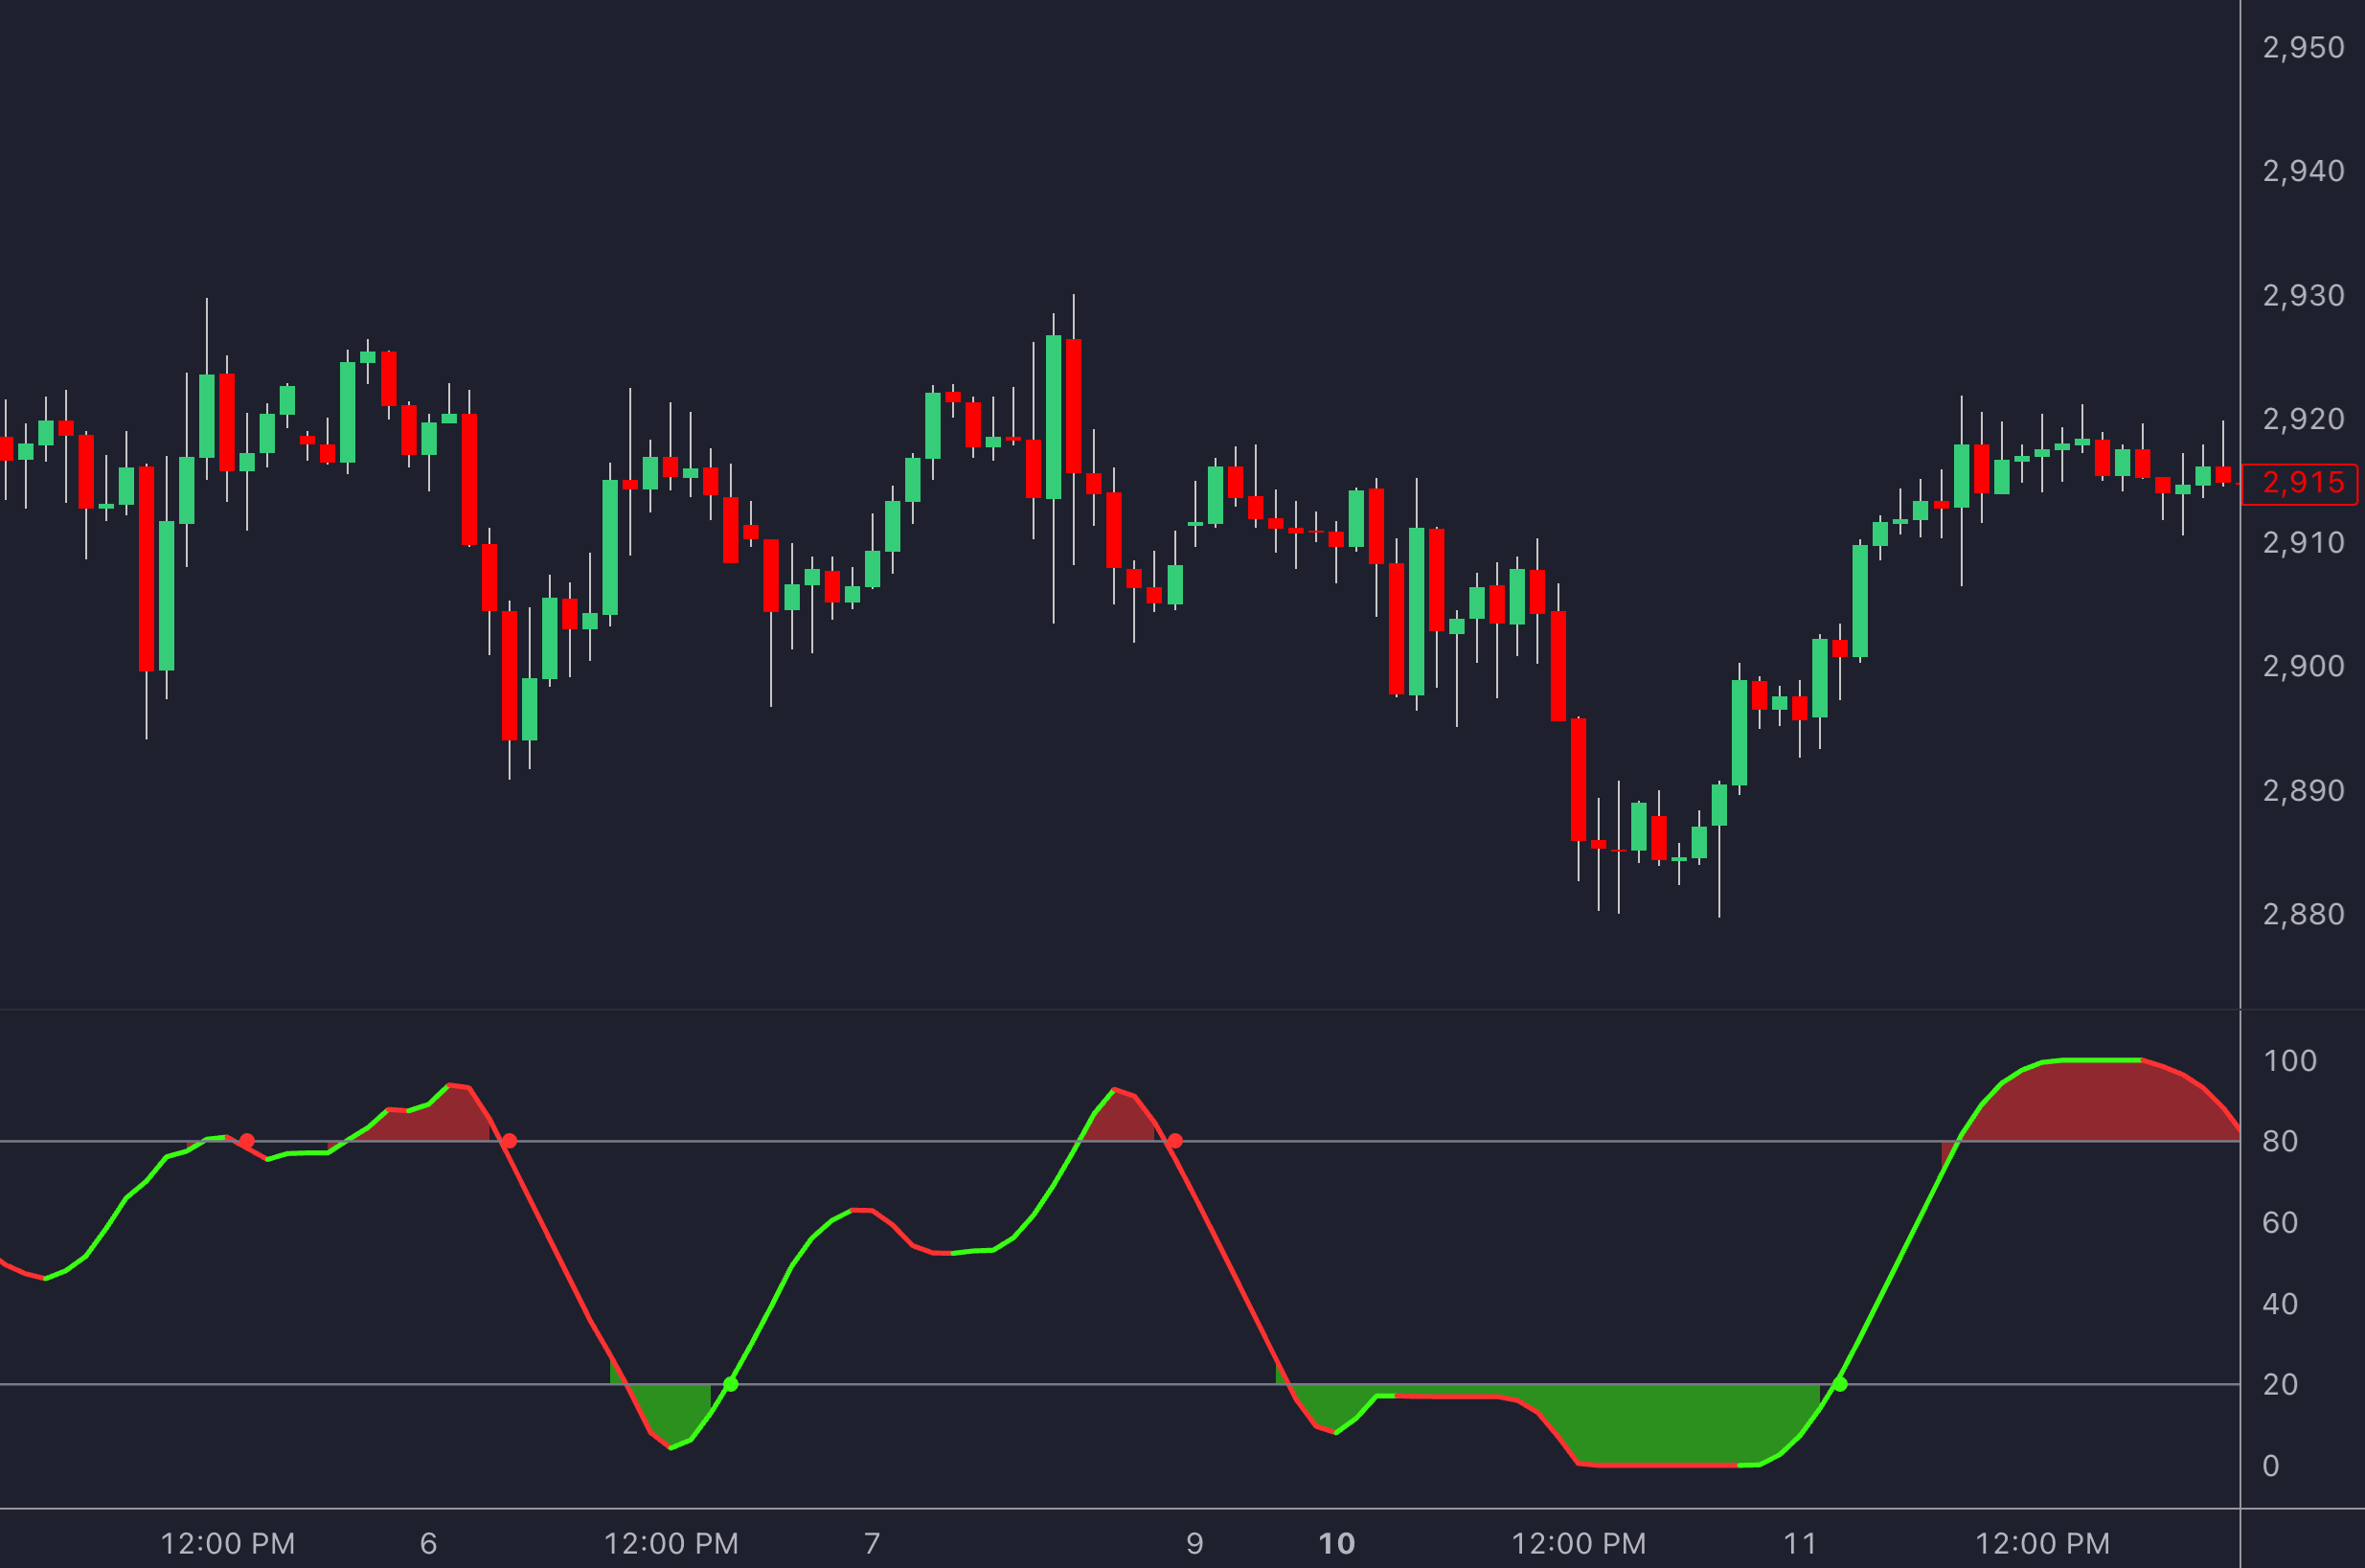
In range-bound markets, overbought and oversold levels tend to provide more consistent signals compared to trend trading, where extreme levels often reflect momentum shifts [1][3].
Range Reversal Points
For range trading, focus on extreme readings rather than mid-range bounces. Here are the key signals to watch for:
| Signal | Condition | Action |
|---|---|---|
| Buy | %K crosses above %D below 20 | Enter near support |
| Sell | %K crosses below %D above 80 | Exit near resistance |
Support and Resistance Confirmation
To improve accuracy, combine stochastic signals with well-defined price levels. This approach aligns with methods used in trend trading but focuses on key range levels:
| Price Level | Stochastic Reading | Trade Action |
|---|---|---|
| Support | Below 20 (Oversold) | Watch for a bullish crossover |
| Resistance | Above 80 (Overbought) | Watch for a bearish crossover |
| Mid-Range | Between 40-60 | Avoid opening new positions |
Volume spikes at these levels can further confirm potential reversals [2][3].
Adjusting Levels for Tight Ranges
In tighter trading ranges, fine-tuning your stochastic settings can enhance sensitivity to smaller price movements. Here's how:
- Shorten the period to 5-9 days and adjust boundaries to 70/30.
- Use a faster %K setting, such as a 3-period %K.
Note: While these adjustments can help capture minor moves, they may also lead to more false signals. Always apply sound risk management strategies and consider using advanced divergence detection to validate potential reversals.
Trend vs. Range Strategy Differences
These strategies build on earlier principles—using divergences during trends and extremes within ranges—while requiring different technical setups.
In trending markets, the stochastic oscillator works as a momentum indicator to spot continuation signals. Using slower settings like 14,3,3 helps filter out noise and stay aligned with the overall trend. During strong trends, the oscillator often remains in overbought or oversold zones, signaling trend strength rather than an imminent reversal.
For ranging markets, the focus shifts to spotting reversals at price extremes. Here, faster settings such as 5,3,3 are more useful because they respond better to short-term price movements. This sensitivity helps traders pinpoint potential turning points more quickly without sacrificing reliability.
Strategy Comparison Chart
| Aspect | Trending Markets | Ranging Markets |
|---|---|---|
| Stochastic Settings | Slower (14,3,3) | Faster (5,3,3) |
| Signal Priority | Continuation signals | Reversal signals at extremes |
| Key Levels | 20/80 for pullbacks | 20/80 for reversals |
| Stop Loss Placement | Wider stops below highs/lows | Tighter stops outside range |
| Position Sizing | Larger for trend runs | Smaller for range trades |
| Trade Duration | Longer-term trades | Short-term trades |
Before applying these strategies, use the ADX indicator to evaluate market conditions. As noted earlier, ADX readings above 25 confirm trending environments, making it a helpful tool for deciding which approach to use.
Additionally, advanced divergence detection capabilities can fine-tune your strategy, offering greater accuracy when switching between these methods.
Tools for Better Stochastic Trading
Stochastic trading can be taken to the next level with modern trading solutions that enhance the ability to detect divergences—a key aspect of identifying trend reversals.
Multi Length Stochastic Average
This indicator provides traders with a dynamic view of momentum by calculating stochastic averages over multiple lengths. By smoothing out price noise and adjusting to varying market conditions, it offers a more comprehensive picture of overbought and oversold conditions. For more details, please visit the Multi Length Stochastic Average page.
Testing Strategies Across Timeframes
An AI Backtesting Assistant allows for thorough testing of stochastic trading strategies, offering features like:
| Feature | Action |
|---|---|
| Multi-timeframe Analysis | Test strategies across different periods |
| Parameter Optimization | Automatically adjust stochastic settings |
| Market Segmentation | Identify whether the market is trending or ranging |
This automated approach supports earlier advice to adjust stochastic settings for trending markets (14,3,3) versus ranging markets (5,3,3).
The platform also enables custom alerts for:
- Crossovers at critical levels
- Divergence confirmations
- Multi-timeframe signal alignment
AI-powered optimization helps reduce false signals during strong trends, according to recent data [5].
Wrapping It Up
Understanding the stochastic oscillator means knowing how its signals behave differently in trending versus range-bound markets. Let’s break down the key strategies and tools that can improve your trading outcomes.
Tips for Trading Trends
When focusing on trends, it’s important to adjust your approach to align with market movement:
- Look for trend continuation signals – such as oversold conditions in an uptrend or overbought conditions in a downtrend.
- Watch for divergences between price action and the oscillator, as these can hint at potential reversals.
- Stay in positions even during extreme oscillator readings, but only if the trend is clearly confirmed.
Tips for Trading Ranges
Range-bound markets often provide more reliable signals from the stochastic oscillator. Here’s what to focus on:
- Pay attention to overbought and oversold levels – these are often key indicators.
- Prioritize crossovers at important support or resistance levels.
- Keep an eye on potential reversal points within the range.
FAQs
When should you use a stochastic oscillator to buy or sell?
The approach to using stochastic oscillator signals depends on the market type:
In trending markets:
- Look to buy when the oscillator shows oversold conditions (below 20) during an uptrend.
- Consider selling when it indicates overbought conditions (above 80) in a downtrend.
In ranging markets:
- Buy when the %K line moves above 20 near a support level.
- Sell when the %K line drops below 80 near a resistance level.
These methods are tailored for different market conditions, as discussed earlier. Always double-check signals by analyzing price action and the overall trend.
References
- Oscillator Matrix Reversal Signals – Documentation
- Stochastic Oscillator Guide in Range Trading – Tiomarkets
- Stochastic Oscillator Overview – The Trading Analyst
- Stochastic Oscillator Strategy – StocksToTrade
- Stochastic Oscillator in Trading – Investopedia
- Unlocking the Secrets of the Stochastic Oscillator – SGT Markets
- Spotting Trend Reversals with the Stochastic Oscillator – OANDA


