Master volume analysis for scalping by identifying trends, managing risk, and using advanced tools to enhance your trading strategy.
Volume analysis is key for scalping, a fast-paced trading strategy focused on small profits from quick price movements. Here's what you need to know:
- Why Volume Matters: High volume confirms price trends, while low volume signals weak momentum.
- Essential Tools: Use indicators like Volume Bars, VWAP, and Volume Profile on platforms like TradingView or advanced features provided by LuxAlgo.
- Key Techniques:
- Spot volume spikes for potential price changes.
- Identify divergences for trend reversals.
- Use Volume Profile to find support/resistance levels.
- Entry & Risk Management:
- Confirm entries with volume trends (e.g., spikes above VWAP).
- Adjust position sizes based on volume strength.
- Exit trades if volume moves against your position.
Start by setting up your platform with real-time data and volume indicators. Practice on short timeframes (1-5 minutes) and refine your strategy using features provided by LuxAlgo for automated alerts and deeper analysis. Scalping success depends on quick decision-making, precise timing, and disciplined risk management.
Setting Up Your Platform for Volume Analysis

Choosing a Charting Platform
TradingView is a popular choice for its fast data updates and scalping-friendly features. When selecting a platform, look for these key characteristics:
- Real-time data streaming with minimal lag
- Support for multiple volume indicators to enhance analysis
- Custom alert options for timely notifications
- Stable performance during periods of high market activity
Adding Volume Indicators
Once you've chosen your platform, it's time to set up essential volume indicators for scalping. Here's a quick guide:
| Indicator Type | Purpose | Suggested Settings |
|---|---|---|
| Volume Bars | Basic volume tracking | 1-minute timeframe for quick signals |
| VWAP | Price-volume relationship | Reset daily for intraday trading |
| Volume Profile | Support/resistance zones | Fixed range, 30-minute segments |
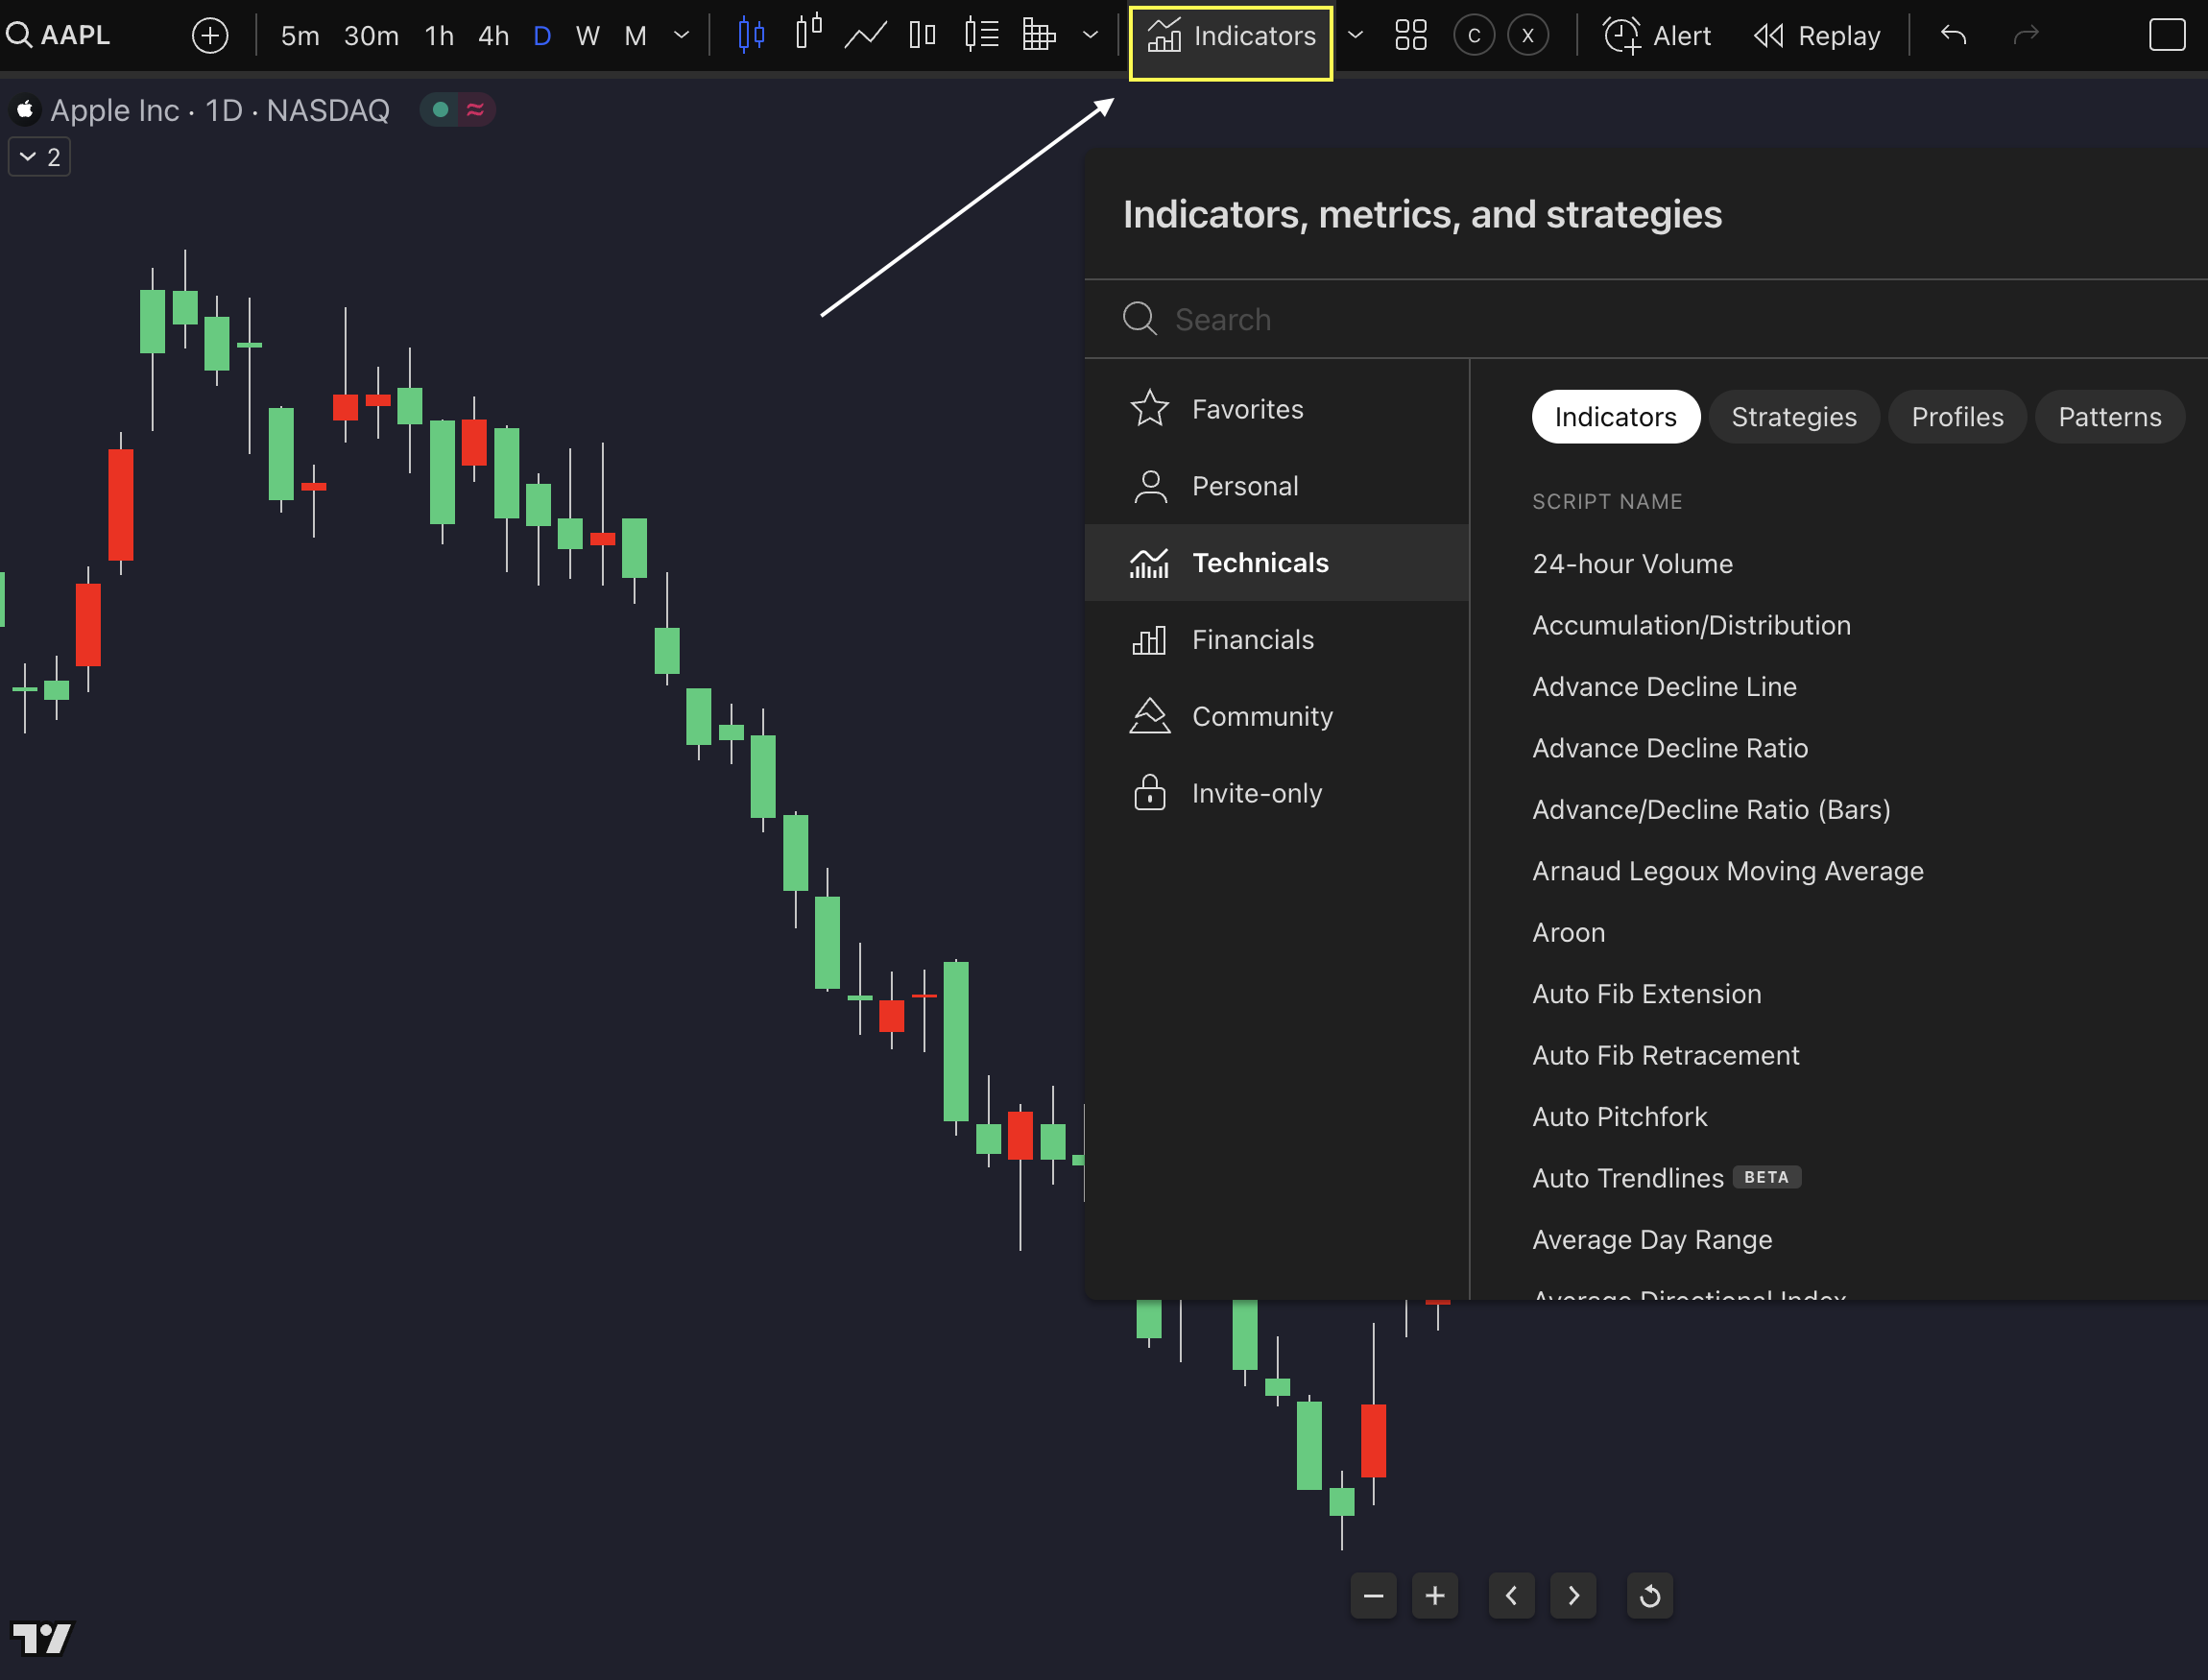
To add these indicators on TradingView, click "Indicators", search for the indicator by name, and tweak settings based on your trading timeframe. For scalping, shorter timeframes like 1-minute or 5-minute charts work best to capture fast market movements. Advanced users can explore features provided by LuxAlgo, which is designed for deeper volume analysis.
Leveraging LuxAlgo's Oscillator Matrix Toolkit for Moneyflow Analysis
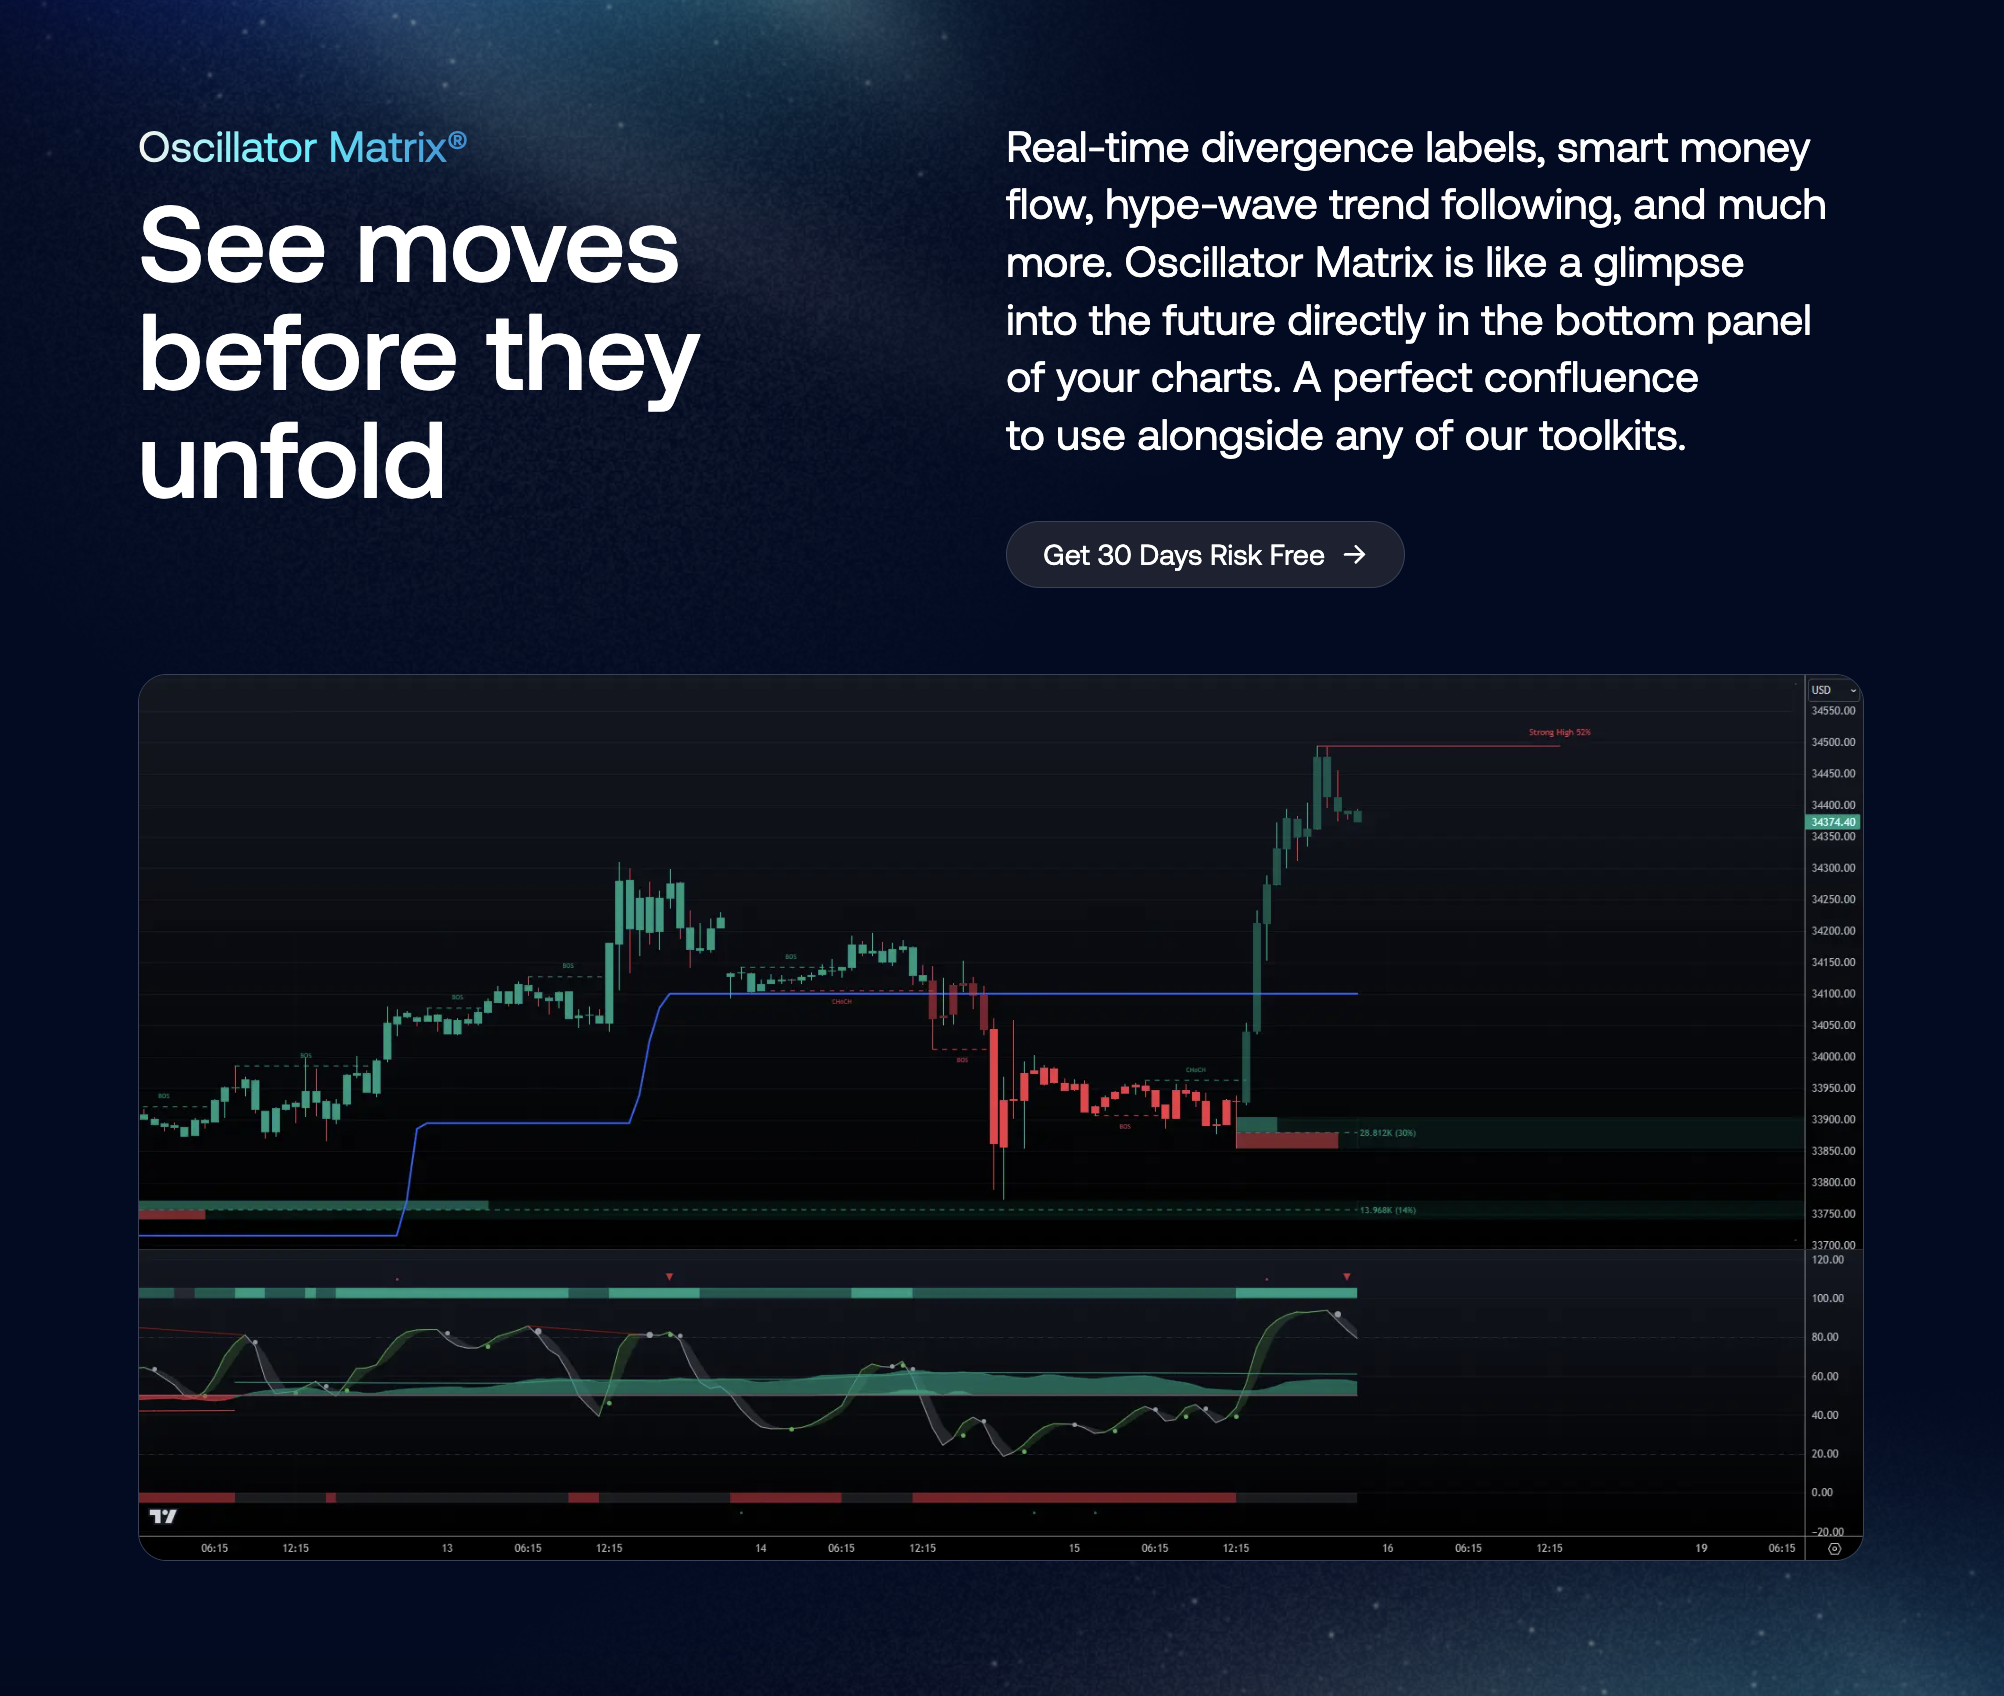
LuxAlgo's Oscillator Matrix Toolkit is designed to be moneyflow-ready, detecting excessive buying or selling activity. This toolkit analyzes market sentiment through moneyflow indicators, alerting you to moments of excessive bullish or bearish pressure. Its ability to highlight abnormal market behavior helps traders identify potential reversals or confirm trending momentum.
Key features of the Oscillator Matrix Toolkit include:
- Detection of excessive buying or selling by monitoring moneyflow indicators.
- Real-time alerts that help you spot shifts in market sentiment immediately.
- Automated pattern recognition to quickly identify potential turning points in the market.
To take advantage of this toolkit:
- Install the Oscillator Matrix Toolkit from the TradingView marketplace.
- Configure alerts based on your specific trading strategy and risk tolerance.
- Monitor the toolkit’s signals to adjust your trades as market conditions evolve.
Pro Tip: Pair the insights from the Oscillator Matrix Toolkit with other price action indicators for a comprehensive market analysis, enhancing your ability to identify optimal trade setups.
Techniques for Real-Time Volume Analysis
Identifying Volume Spikes
Volume spikes often signal strong market activity and potential price changes. To catch these in real-time:
- Use the Volume Rate of Change (VROC) indicator to detect spikes above 50%.
- Pay attention to sudden volume increases during significant price movements.
- Automate detection with features like LuxAlgo's toolkits, which allow you to set custom threshold alerts.
Finding Volume Divergences
Unlike volume spikes, divergences reveal market imbalances that can hint at trend reversals.
| Divergence Type | Price Action | Volume Pattern |
|---|---|---|
| Bearish | Higher highs | Decreasing volume (indicates a potential drop) |
| Bullish | Lower lows | Increasing volume (indicates a potential rise) |
The On-Balance Volume (OBV) indicator is helpful here. For instance, if prices hit new highs but OBV doesn't confirm, this bearish divergence suggests weakening buying momentum.
Using Volume Profile to Find Key Levels
Once divergences are spotted, the Volume Profile tool can identify important price levels where shifts might occur. These levels often act as support or resistance zones, making them crucial for traders.
Key elements to focus on:
- Point of Control (POC): The price level with the highest trading activity, often attracting price movement.
- High-volume nodes (HVN): Act as support or resistance zones.
- Low-volume nodes (LVN): Indicate areas where price tends to move quickly.
For scalpers, marking the day's POC can provide actionable insights. Watching how price reacts when it revisits this level—especially with strong volume—can highlight high-probability trading opportunities. Combining this with real-time volume spikes or divergences enhances precision.
Making Trades with Volume Signals
Entry Strategies with Volume
Volume analysis can help traders confirm scalping entries with more accuracy. When price movements align with volume trends, you can make better-informed decisions.
For long trades, look for a 50%+ volume increase above VWAP and set stops just below recent lows. For short trades, watch for a 40%+ volume surge below VWAP and place stops above recent highs. Breakout trades should show at least double the average volume, with stops positioned just behind the breakout level.
Some key signals to watch for include:
- Price crossing VWAP while volume increases
- Volume spikes exceeding 50% VROC during strong price moves
- OBV (On-Balance Volume) aligning with price direction
Managing Risk with Volume Data
After identifying an entry, managing your risk is essential to protect your capital and improve your chances of success.
"Trading is a probability game where you must play with the most probable setups with least possible loss and maximum gains."
Adjust your position size based on the strength of the volume signal:
- Strong volume confirmation (75%+ of average): take larger positions
- Declining volume: opt for smaller positions
- Contrary volume spikes: exit quickly to limit losses
Dynamic support and resistance levels, where trading activity clusters, can be used as reference points for setting stops.
Adjusting Positions with Volume Changes
Monitoring volume patterns after entering a trade can help you fine-tune your positions. The VWAP is a critical tool for deciding when to add, reduce, or exit trades.
Here’s how to manage your positions:
- Add to winning trades when:
- Price holds above or below VWAP, depending on trade direction
- Volume increases in your trade's favor
- OBV supports the momentum
- Reduce positions when:
- Volume weakens during price advances
- Price stalls at key volume levels
- The price-to-VWAP relationship shifts
- Exit positions when volume moves strongly against your trade, especially if the price breaks VWAP with heavy volume.
For a more streamlined approach, features like LuxAlgo's toolkits can help you detect these patterns automatically and send real-time alerts for position adjustments.
Avoiding Mistakes in Volume-Based Scalping
Dealing with Low Volume
Periods of low trading volume can make scalping signals less reliable. During these quieter market hours, price movements might seem important but often lack the volume support needed for confident trades.
Here’s how to navigate low volume effectively:
- Use 15-minute charts and raise volume thresholds by 50% to filter out unnecessary noise and improve signal clarity.
- Adjust your position sizes to match the reduced market liquidity.
- Set tighter stop-loss orders to guard against unexpected price swings.
Pay close attention to price levels where volume begins to rise but price movement slows down—these can signal potential reversal points where larger traders are either accumulating or offloading positions. While low volume requires extra care, combining it with additional indicators can help refine your decisions.
Balancing Volume with Other Indicators
Pairing volume with other indicators can increase the reliability of your trading signals. Here’s a framework you can use:
| Indicator Type | Purpose |
|---|---|
| Volume | Confirms the primary trend |
| MACD | Checks momentum |
| RSI | Identifies overbought/oversold levels |
| Moving Averages | Shows trend direction |
For example, combine volume with MACD to verify momentum, use RSI to gauge overbought or oversold conditions, and rely on moving averages to confirm the trend's direction. But remember, even the best combinations can be thrown off by unexpected news, so always be ready to adjust your strategy.
Handling News-Driven Volume Spikes
News events can cause sudden volume spikes, leading to false signals if you’re not careful. To differentiate between real market activity and temporary news-driven movements, it’s essential to analyze the volume patterns before and after the news.
Here’s how to manage news-driven volume effectively:
- Keep an eye on economic calendars for upcoming announcements.
- Wait 5-15 minutes after a news release for volume to stabilize.
- Focus on sustained volume that aligns with existing trends, rather than brief spikes that often result in false breakouts.
Features like LuxAlgo's toolkits can simplify this process. Their real-time alerts help you identify when volume patterns return to normal, allowing you to make better-informed trading decisions.
Conclusion: Using Volume for Scalping Success
Let's wrap up by highlighting the key takeaways and steps for using volume analysis to improve your scalping strategy.
Why Use Volume-Based Scalping?
Volume analysis offers crucial insights for trading in fast-paced markets. High trading volume confirms price trends and movements, providing traders with more confidence in their decisions. It works best during periods of high liquidity, allowing for faster trades with less impact on price. Pairing volume analysis with technical indicators can help pinpoint the best entry and exit points—key for scalping effectively.
How to Get Started
To begin scalping with volume, it’s essential to have the right tools and a solid plan. The Volume Weighted Average Price (VWAP) is a must-have indicator for identifying favorable trading levels during active sessions.
| Phase | Action |
|---|---|
| Setup | Install volume analysis tools |
| Practice | Use a demo account for 2–4 weeks |
| Execution | Begin with small positions |
For more advanced analysis, features like LuxAlgo's Oscillator Matrix Toolkit on TradingView can be a game-changer. Scalping success comes down to patience, practice, and sticking to your strategy. Start small, focus on times of high liquidity, and refine your approach as you gain experience.