Learn how to effectively use volume indicators in forex trading to enhance your analysis, confirm trends, and identify trading opportunities.
Volume indicators in forex trading help analyze market activity by tracking buying and selling pressure. They confirm trends, validate breakouts, and detect potential reversals. Popular tools include On-Balance Volume (OBV), Money Flow (MFI), and Accumulation/Distribution (A/D). Here's what you need to know:
-
Why Use Volume Indicators?
- Confirm trends and breakouts
- Spot reversals and analyze liquidity
-
How to Set Up and Use Them:
- Choose a trading platform like TradingView or MetaTrader.
- Add indicators such as OBV or MFI to your chart.
- Adjust settings for your trading style and timeframe.
-
Key Strategies:
- High volume confirms strong trends.
- Divergence between price and volume may signal reversals.
- Use multiple indicators for better accuracy.
For advanced analysis, tools like LuxAlgo offer AI-driven insights and backtesting to refine your strategy.
| Indicator | Purpose | Best For |
|---|---|---|
| On-Balance Volume | Tracks cumulative buying/selling | Spotting breakouts |
| Money Flow Index | Measures overbought/oversold levels | Identifying market conditions |
| Accumulation/Distribution | Analyzes price-volume relationship | Gauging trend strength |
Start with basic volume indicators, practice on a demo account, and gradually integrate them into your trading strategy.
How to Set Up Volume Indicators on Trading Platforms
Choosing a Trading Platform
Here's a quick comparison of popular trading platforms and what they offer:
| Platform | Key Features |
|---|---|
| TradingView | Large indicator library, cloud-based, social tools |
| MetaTrader | Customizable, broker integration, automated tools |
| NinjaTrader | Advanced charting, automated trading strategies |
Adding Volume Indicators to Your Chart
Follow these simple steps to add a volume indicator:
- Open your trading chart.
- Click the "Indicators" button located at the top of the chart.
- Search for your preferred volume indicator (like On-Balance Volume) and select it.
- The indicator will now appear below your main price chart.
Looking to explore more indicators? Check out the LuxAlgo Indicator Library to find tons of additional tools for your charting needs.

Tweaking Volume Indicator Settings
Choosing the Right Timeframe
- Match the timeframe to your trading style (e.g., 1-minute for quick trades, daily for longer-term strategies).
- Use multiple timeframes to confirm signals.
- Adjust based on how volatile the market is.
Customizing Visuals
- Change colors, line thickness, or set alerts to make it easier to read and act on the data.
Setting up volume indicators correctly helps you analyze market activity and spot trading opportunities more effectively. Once they're configured, the next step is learning how to interpret their signals to improve your trades.
How to Read and Understand Volume Indicators
What Volume Data Tells You
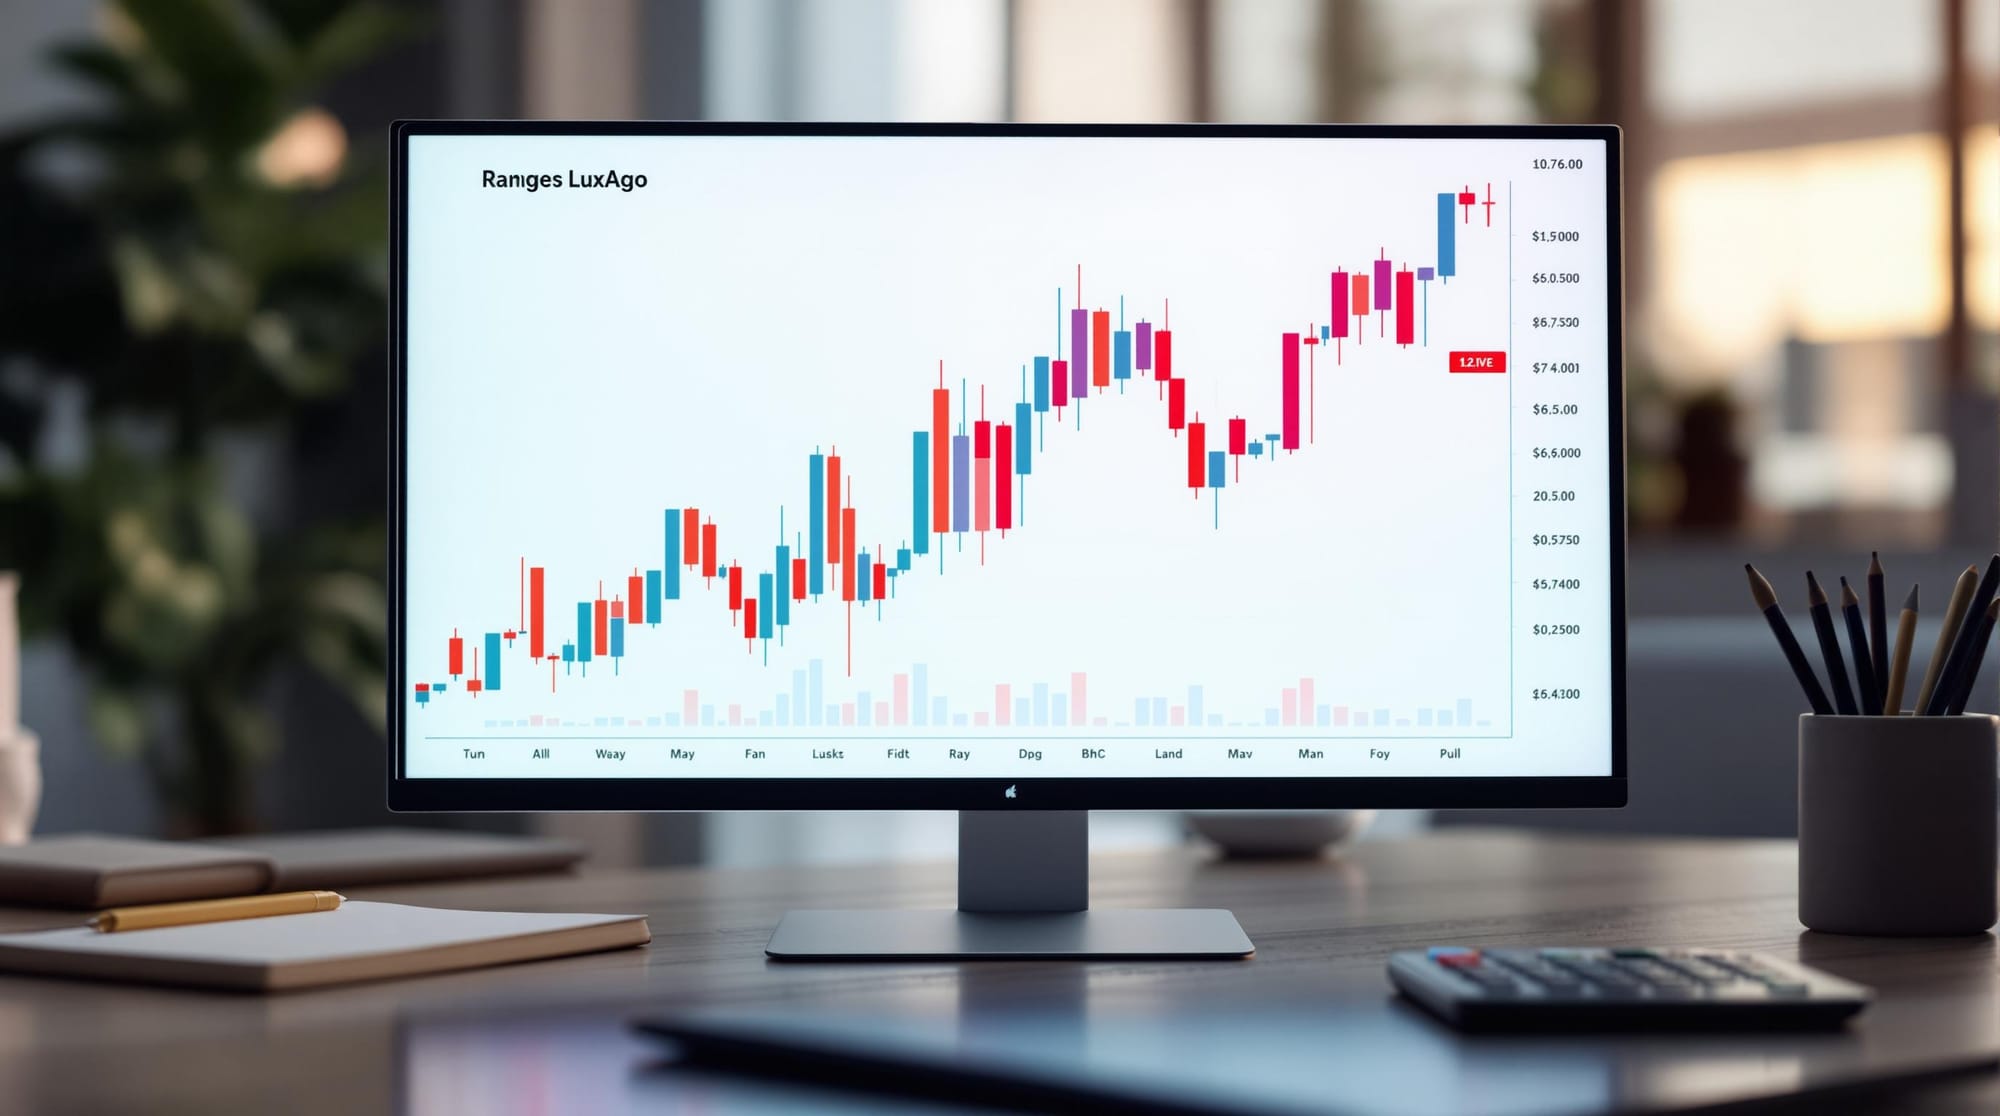
Volume provides insights into market activity and helps assess the strength behind price movements. When prices rise or fall with high volume, it signals strong market participation and validates the trend. On the other hand, low volume during price changes may indicate weak interest and a possible trend slowdown. Green volume bars represent buying activity, while red bars highlight selling pressure [4].
Types of Volume Indicators
Here are some commonly used volume indicators and how they can be applied in forex trading:
| Indicator | Purpose | Best Used For |
|---|---|---|
| On-Balance Volume (OBV) | Tracks cumulative buying and selling pressure | Spotting potential breakouts or breakdowns |
| Money Flow Index (MFI) | Measures money flow into and out of currency pairs | Identifying overbought or oversold conditions |
| Accumulation/Distribution (A/D) | Analyzes volume during price movements | Gauging the strength of a trend |
Using Volume to Spot Patterns
Volume patterns can reveal important market signals. Pay attention to these relationships:
- Trend Confirmation: High volume during price moves supports the trend and suggests it may continue [1][4].
- Divergence Signals: When price and volume move in opposite directions, it can indicate a potential reversal. For example, if prices are rising but volume is declining, buyer interest may be fading.
- Breakout Validation: Breakouts accompanied by high volume are more likely to be genuine, reducing the chances of false signals [2][3].
To improve accuracy, combine multiple indicators when analyzing volume patterns. Testing these strategies in a demo account allows you to see how they work in real market conditions without financial risk.
Understanding these patterns is a key step toward developing effective trading strategies. The next section will focus on how to apply volume indicators in forex trading strategies.
Using Volume Indicators in Forex Strategies
Analyzing Trends with Volume
Volume indicators play a key role in confirming trends by matching price movements with trading activity. For example, an upward trend paired with increasing volume often reflects strong buying interest, suggesting the trend may continue.
Here are some important relationships between volume and trends:
- When volume moves in sync with price, it confirms the trend, while a mismatch could signal a potential reversal.
- Low volume during sideways price movement might indicate that a breakout is on the horizon.
Confirming Trade Entries and Exits
Volume indicators are useful for validating decisions at critical price levels. Here's how they can guide your trading choices:
| Trading Scenario | Volume Signal | Action to Take |
|---|---|---|
| Breakout | High Volume | Enter in the direction of the breakout. |
| Support/Resistance Test | Rising Volume | Be alert for a potential reversal. |
| Trend Continuation | Steady Volume | Hold your current positions. |
| Price Rally | Declining Volume | Consider exiting or reducing your position. |
Testing Strategies with Volume Indicators
Using tools like LuxAlgo, you can backtest strategies to ensure they align with your trading goals. Backtesting helps confirm whether volume indicators support your approach and improve your decision-making.
For even better results, combine volume indicators with other tools:
- Money Flow Index (MFI): Pinpoint overbought or oversold conditions.
- On-Balance Volume (OBV): Confirm trends by tracking cumulative volume.
- Accumulation/Distribution (A/D): Analyze the balance of buying and selling pressure.
After testing, advanced tools can help fine-tune your strategies, giving you a more refined trading edge.
Advanced Tools for Analyzing Volume
In forex trading, analyzing volume effectively requires more than just basic indicators. Platforms like LuxAlgo step up by offering cutting-edge solutions that take volume analysis to the next level.
How LuxAlgo Supports Volume Analysis
LuxAlgo provides traders with powerful tools for pattern recognition and strategy testing. For example, the Volume Toolkit offers detailed volume-based metrics, while AI Backtesting can be used independently to validate trading methods. By combining these resources, traders gain deeper insights and can more accurately gauge market behavior.
Why Choose LuxAlgo for Trading
LuxAlgo offers real-time volume insights, customizable indicators, and AI-driven pattern detection. These tools work seamlessly with TradingView, giving traders a streamlined experience. The AI capabilities also uncover patterns that traditional tools might overlook, providing a deeper understanding of market movements.
The LuxAlgo Oscillator Matrix
The LuxAlgo Oscillator Matrix takes volume analysis to another level by incorporating multiple data points related to money flow and market momentum. It provides traders with an in-depth look at how volume is influencing price action, making it easier to identify potential entry and exit points.
This advanced oscillator is particularly helpful for:
- Spotting shifts in buying/selling pressure
- Confirming the strength of trends through volume components
- Combining volume-based signals with other technical indicators

How to Add LuxAlgo to Your Workflow
To make the most of LuxAlgo:
- Customize volume indicators to fit your trading style
- Combine these tools with other TradingView indicators to build a unified dashboard
- Take advantage of 24/7 community support and resources for guidance
Conclusion
Key Points Recap
Understanding and using volume indicators can make a big difference in forex trading. These tools give insight into market strength and potential trend changes. By analyzing volume, traders can confirm price movements and spot trading opportunities by seeing the buying and selling pressure behind the scenes.
Here are some important highlights:
- Combining Strategies: Pairing volume indicators with price action can lead to more accurate analysis and informed decisions.
- Spotting Trends: Volume helps confirm ongoing trends and can signal possible reversals.
Practical Steps for Forex Traders
Ready to put these ideas into action? Start small and build your skills step by step:
- Use basic volume indicators on a demo account to get comfortable and track your progress.
- Gradually mix volume data with price action strategies to improve your trade timing.
- For advanced traders, tools like LuxAlgo offer features to fine-tune volume analysis and test strategies more effectively.
| Skill Level | Action Plan | Goal |
|---|---|---|
| Beginner | Practice interpreting volume | Develop basic understanding |
| Intermediate | Combine volume and price action | Enhance trade accuracy |
| Advanced | Utilize AI-powered tools | Refine and optimize strategies |
The key is consistency. Focus on fully understanding volume signals before increasing your trade size. If you're looking for advanced tools, LuxAlgo's Volume Toolkit and AI features can help uncover patterns that might go unnoticed with standard indicators.
FAQs
What is the best volume indicator for forex?
The "best" volume indicator depends on your trading style and objectives. Each indicator has a specific purpose, from confirming trends to spotting potential reversals.
Here are some popular volume indicators and their uses:
| Indicator | Purpose | Ideal For |
|---|---|---|
| On Balance Volume (OBV) | Confirms trends | Detecting breakouts |
| Money Flow Index (MFI) | Identifies overbought/oversold levels | Analyzing divergences |
| Accumulation/Distribution (A/D) | Examines price-volume relationships | Gauging trend strength |
| Volume Weighted Average Price (VWAP) | Tracks price levels relative to volume | Monitoring price-volume balance |
| Chaikin Oscillator | Measures volume momentum | Identifying reversals |
Experienced traders often combine multiple indicators for a more detailed view of market activity.
For advanced traders, tools like LuxAlgo's Volume Toolkit on TradingView can provide enhanced pattern recognition and strategy testing capabilities, offering deeper insights into market behavior.
Things to Consider:
- Your trading timeframe
- Level of experience
- Patterns you're targeting
- Compatibility with your strategy
When paired with price action and other technical tools, volume indicators can improve your ability to read market trends and make informed decisions. Choosing the right indicator and integrating it effectively is key to understanding market dynamics.


