Origins
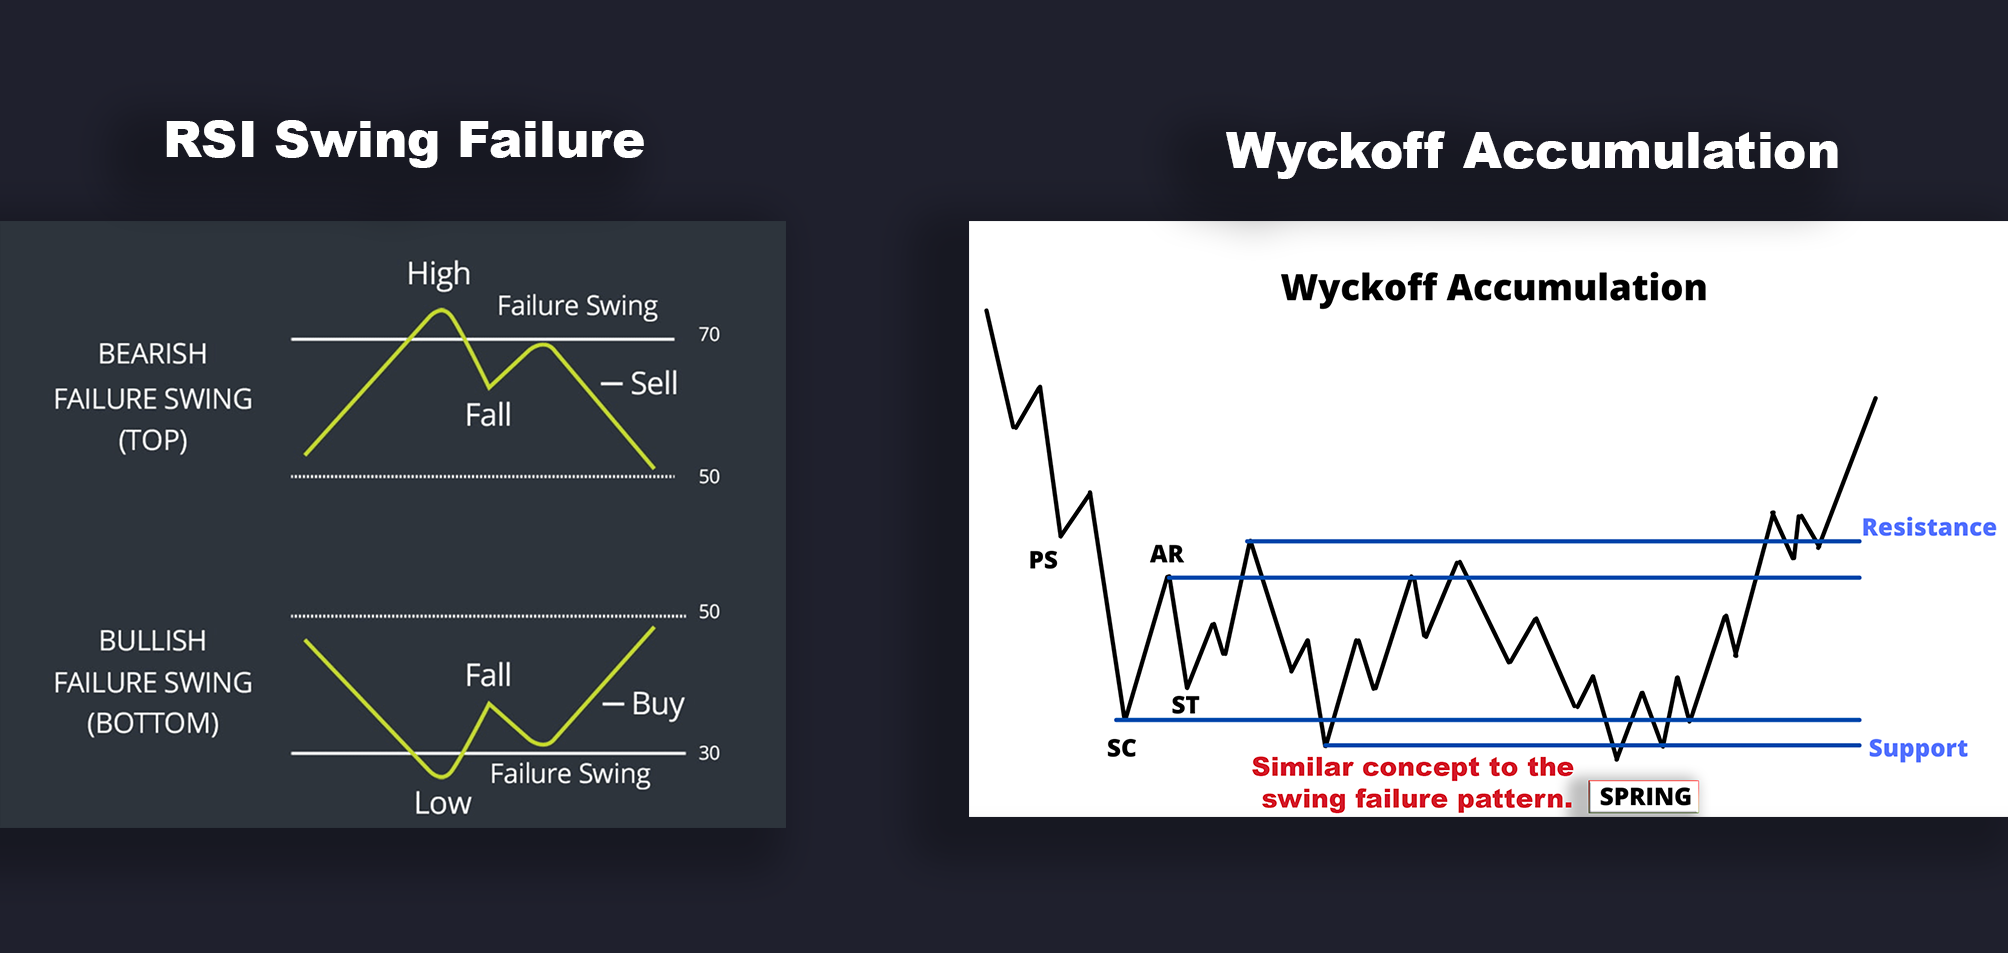
The swing failure pattern has been around for over a decade, though its exact origins remain unclear. It likely evolved from popular patterns developed between 1873 and the 1970s, such as the Wyckoff Method by Richard Wyckoff and the RSI Swing Failure Pattern by J. Welles Wilder since they present a similar approach which we'll discuss later.
The earliest found mention of this pattern by this name, was by the popular trader "Trader Dante" in 2012, during a webinar where he discussed this pattern. Even then, he mentioned that the pattern was something he discovered and had been studying. But while Dante did not develop the pattern, it was certainly popularized by him.
What is the Swing Failure Pattern ?
The Swing Failure pattern stems from the same pool of liquidity trading concepts. The pattern involves identifying market structure and using the swing points within this market structure to detect swing failures. So, let’s first understand market structure.
Market Structure
Market structure typically refers to a wave-like formation observed when a market trends. A bullish market structure is categorized by the market making higher highs (HH) and higher lows (HL), while a downtrend is categorized by the market making lower lows (LL) and lower highs (LH). These points in the market are referred to as swing points.
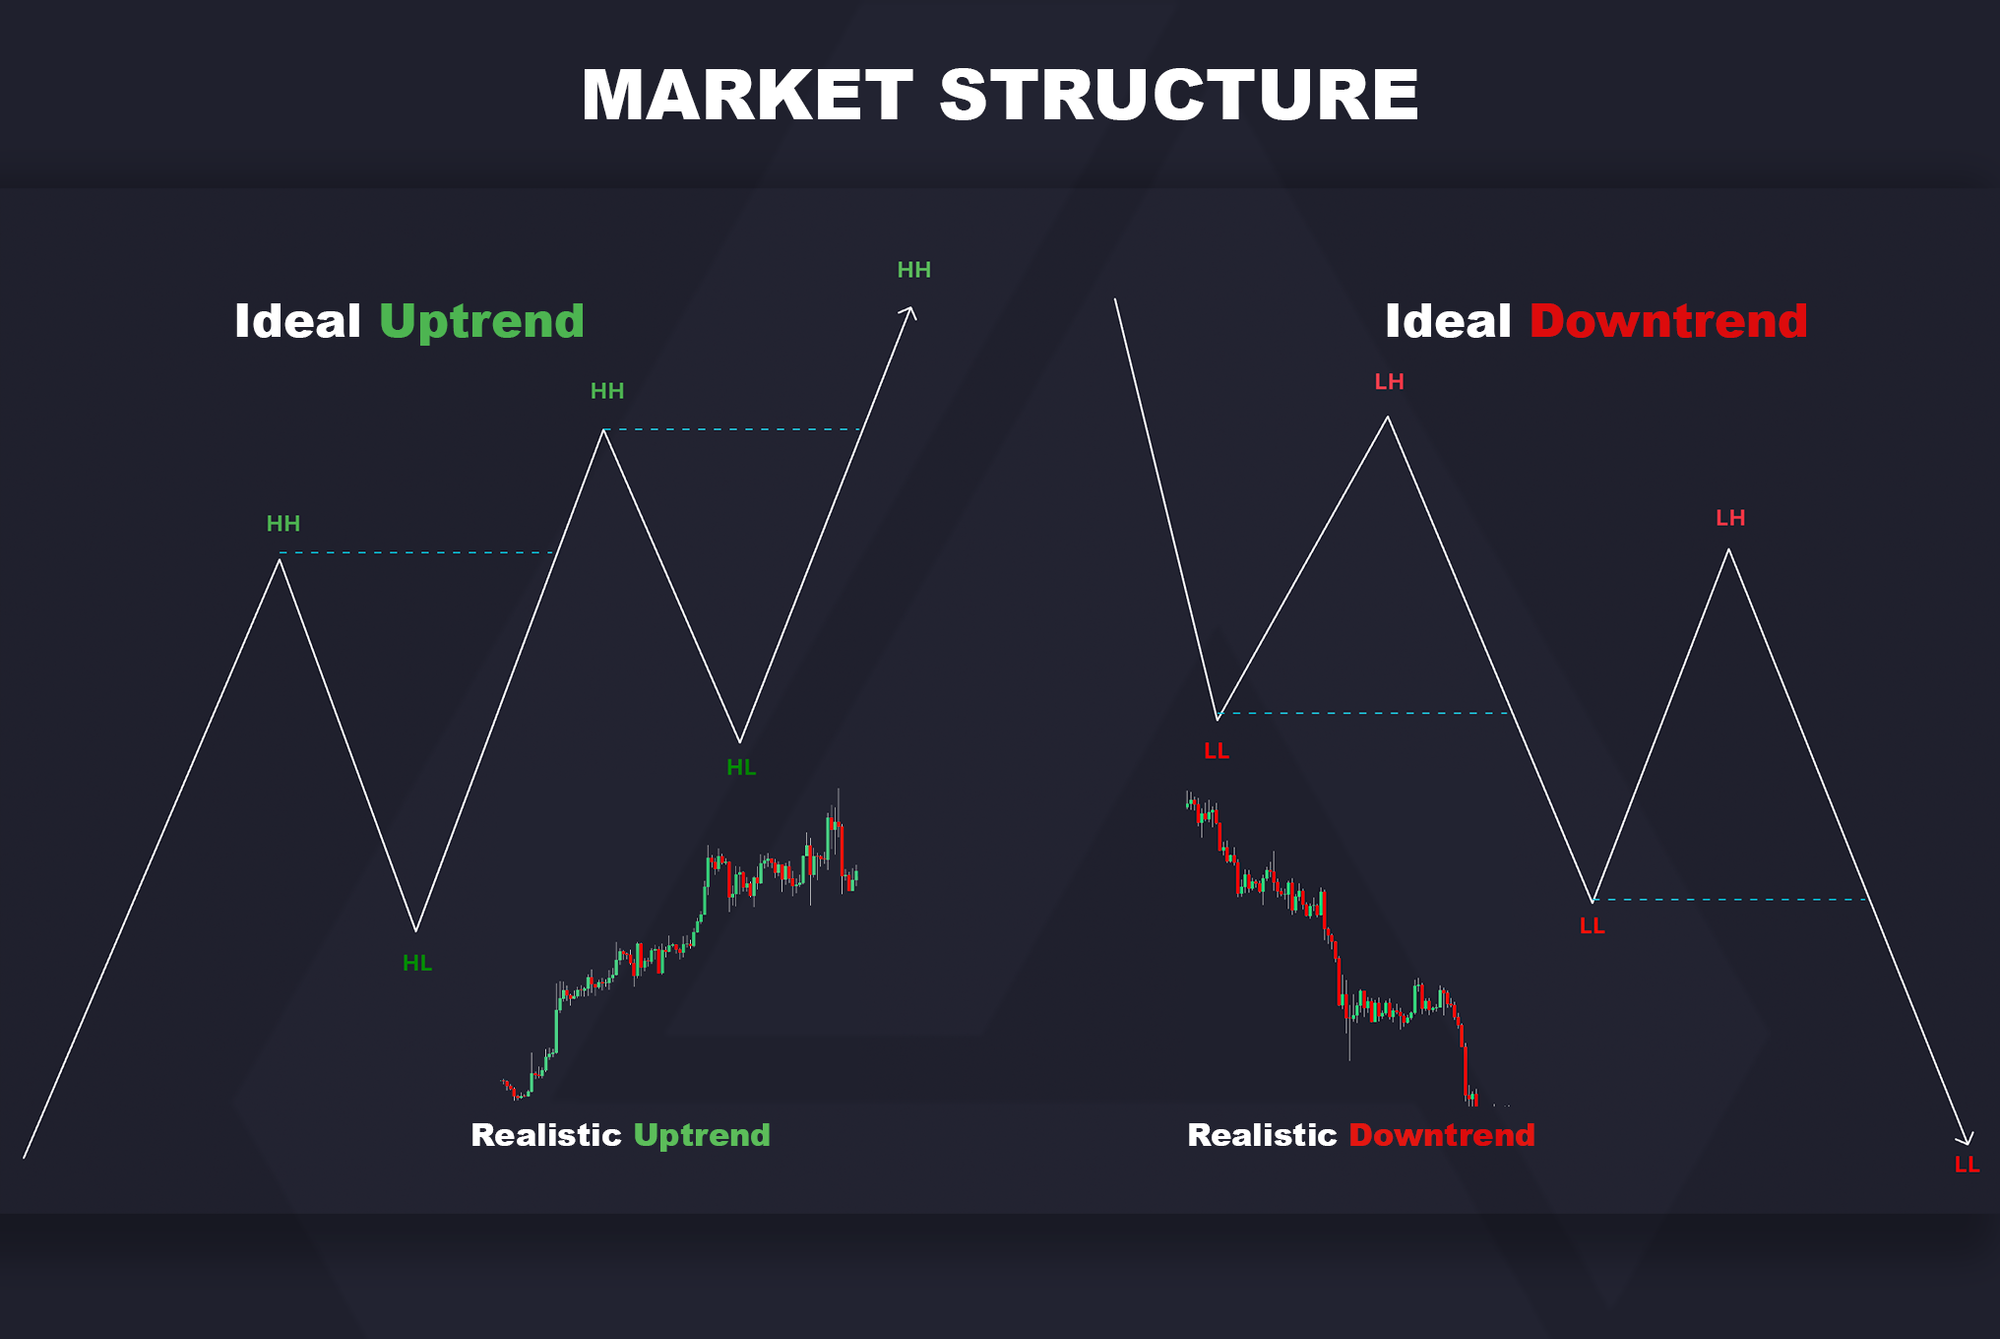
In the context of market structure, for the price action to remain bullish, the market needs to constantly break the latest higher highs (HH) while remaining above the higher lows (HL). Conversely, for the price action to remain bearish, the market needs to break the lower lows (LL) while remaining below the lower highs (LH).
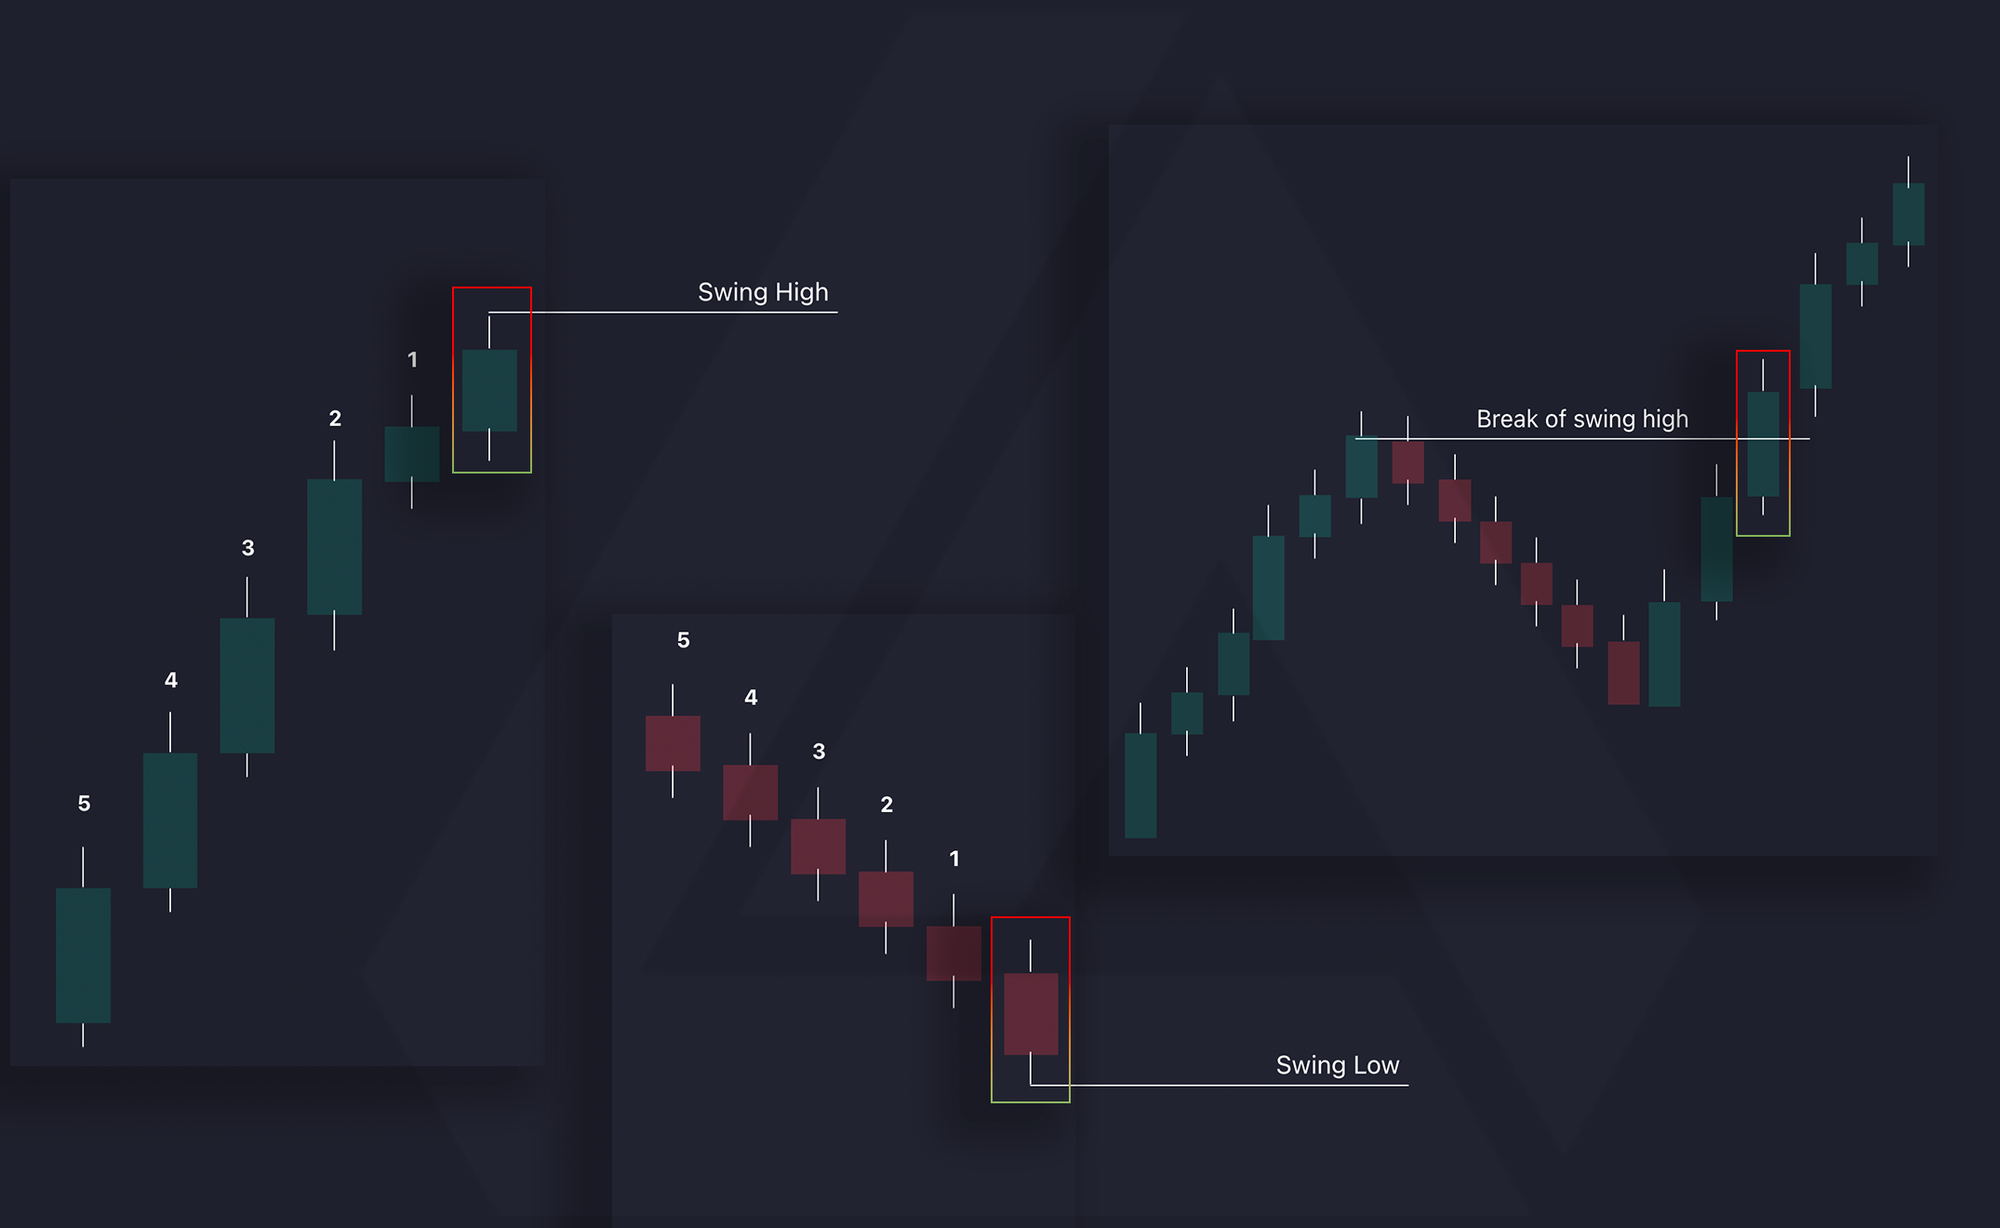
It's important to note that these swing points are heavily subjective and will depend on individual traders. An easy way to determine these levels is by identifying a high or low price and then using an X number of candles lower or higher to the left and/or right of that price point to determine a swing high/low, where X is determined by the trader. The same approach can be applied to the breaks of swing points. Once a swing point is established, a break of that swing point might be categorized by a candle closing above or below that swing point, while some traders prefer a wick beyond that swing point. For the purposes of this explanation, we will assume that a swing point is determined by at least 5 candles to the left or right of the close of the candle, and a break of a swing point is determined by the price closing above or below the swing point.
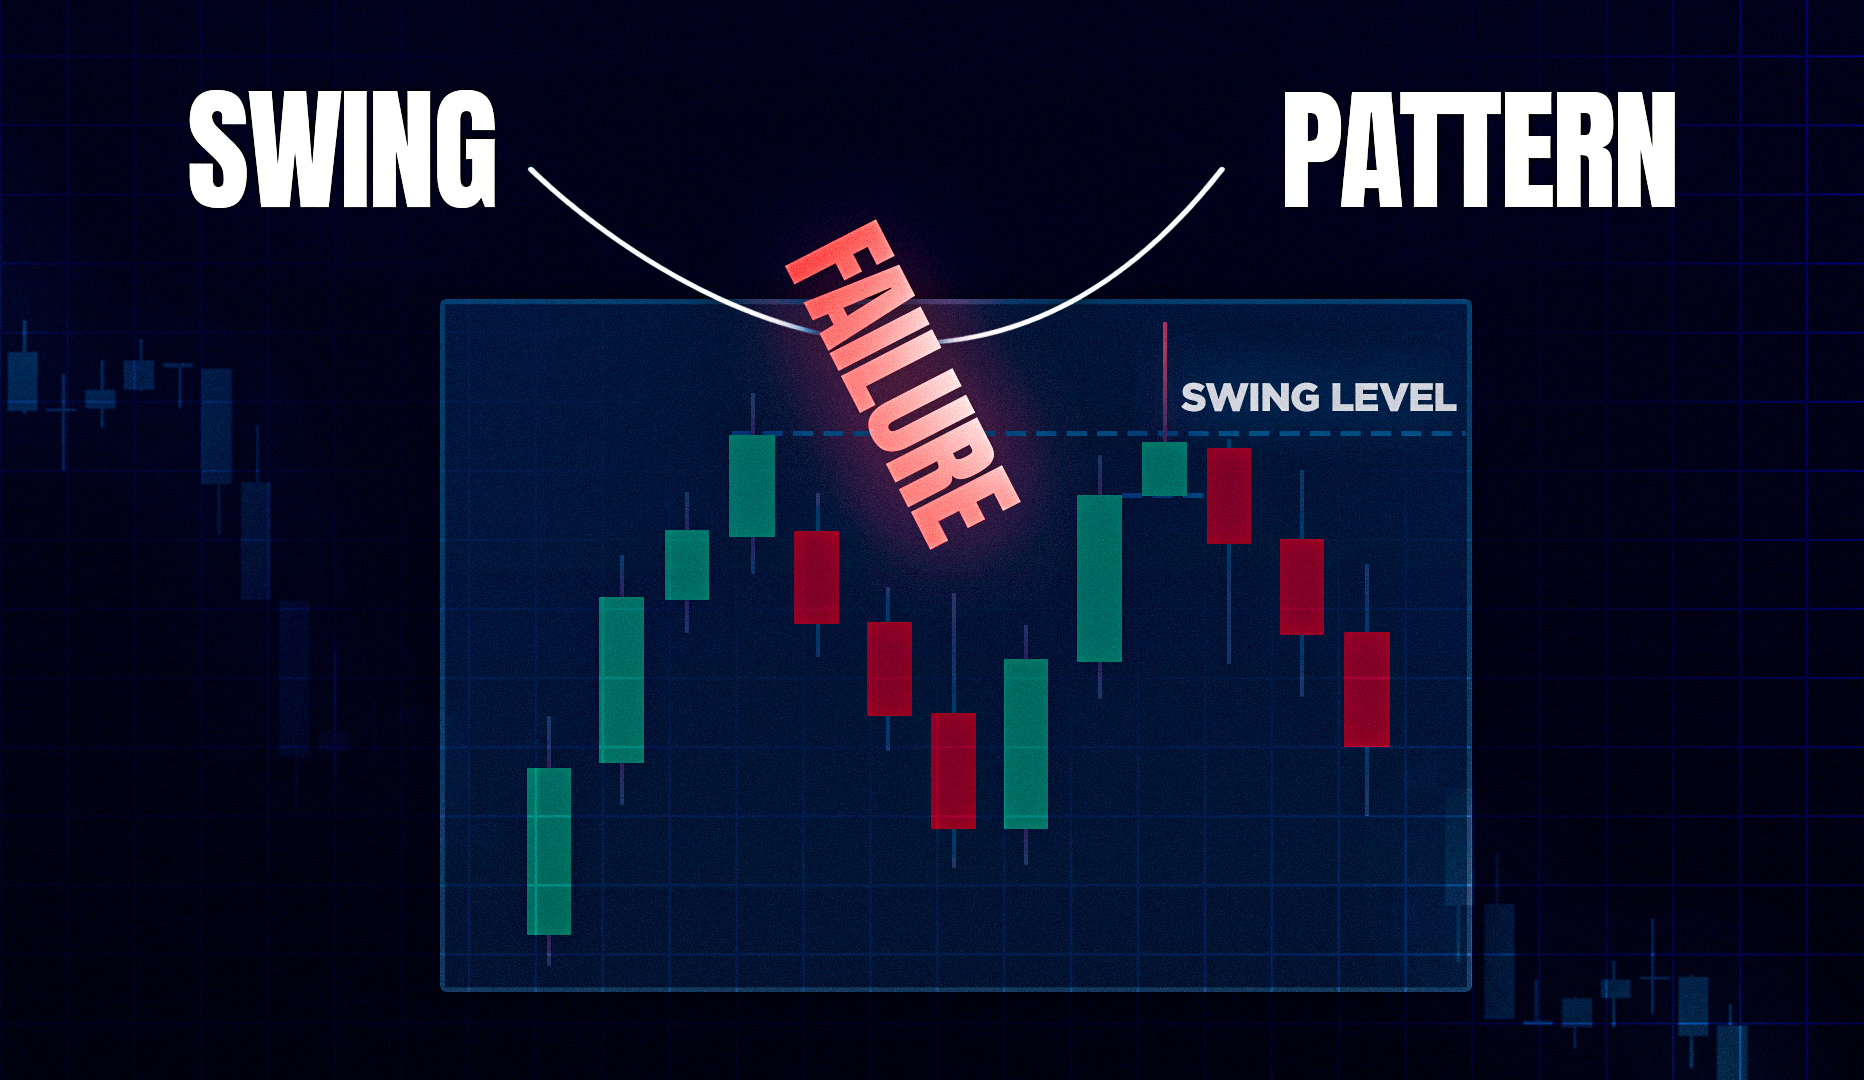
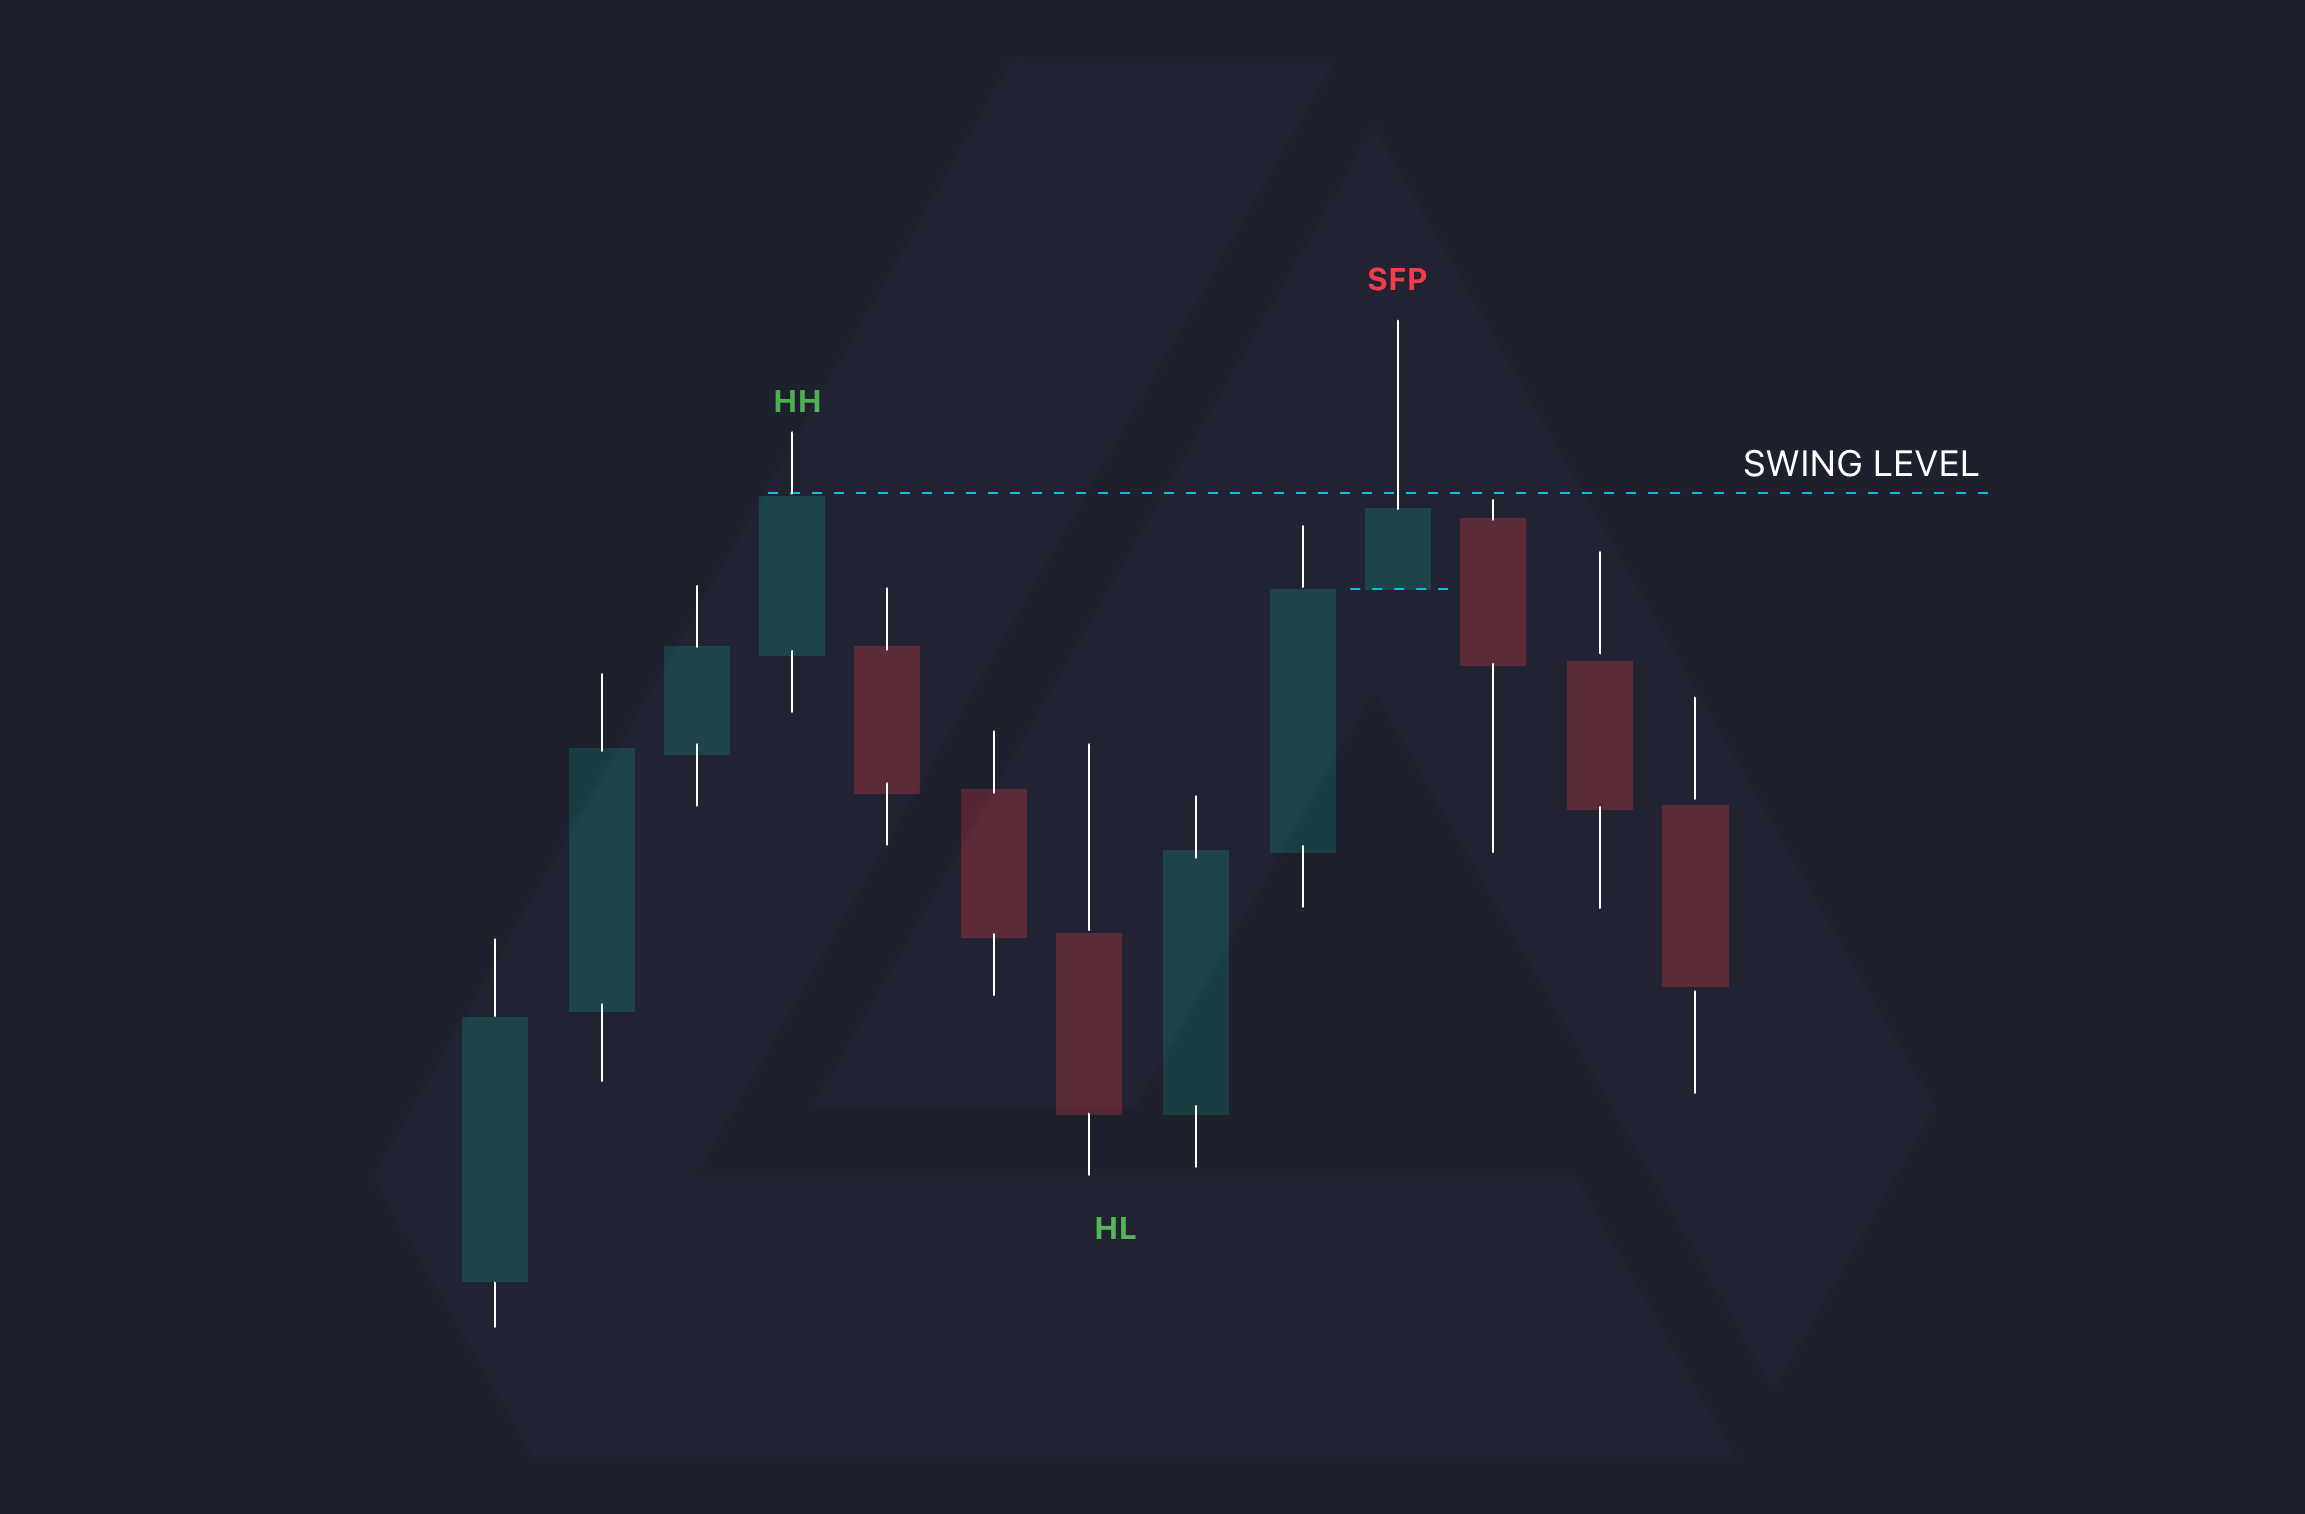
Identifying the Swing Failure Pattern
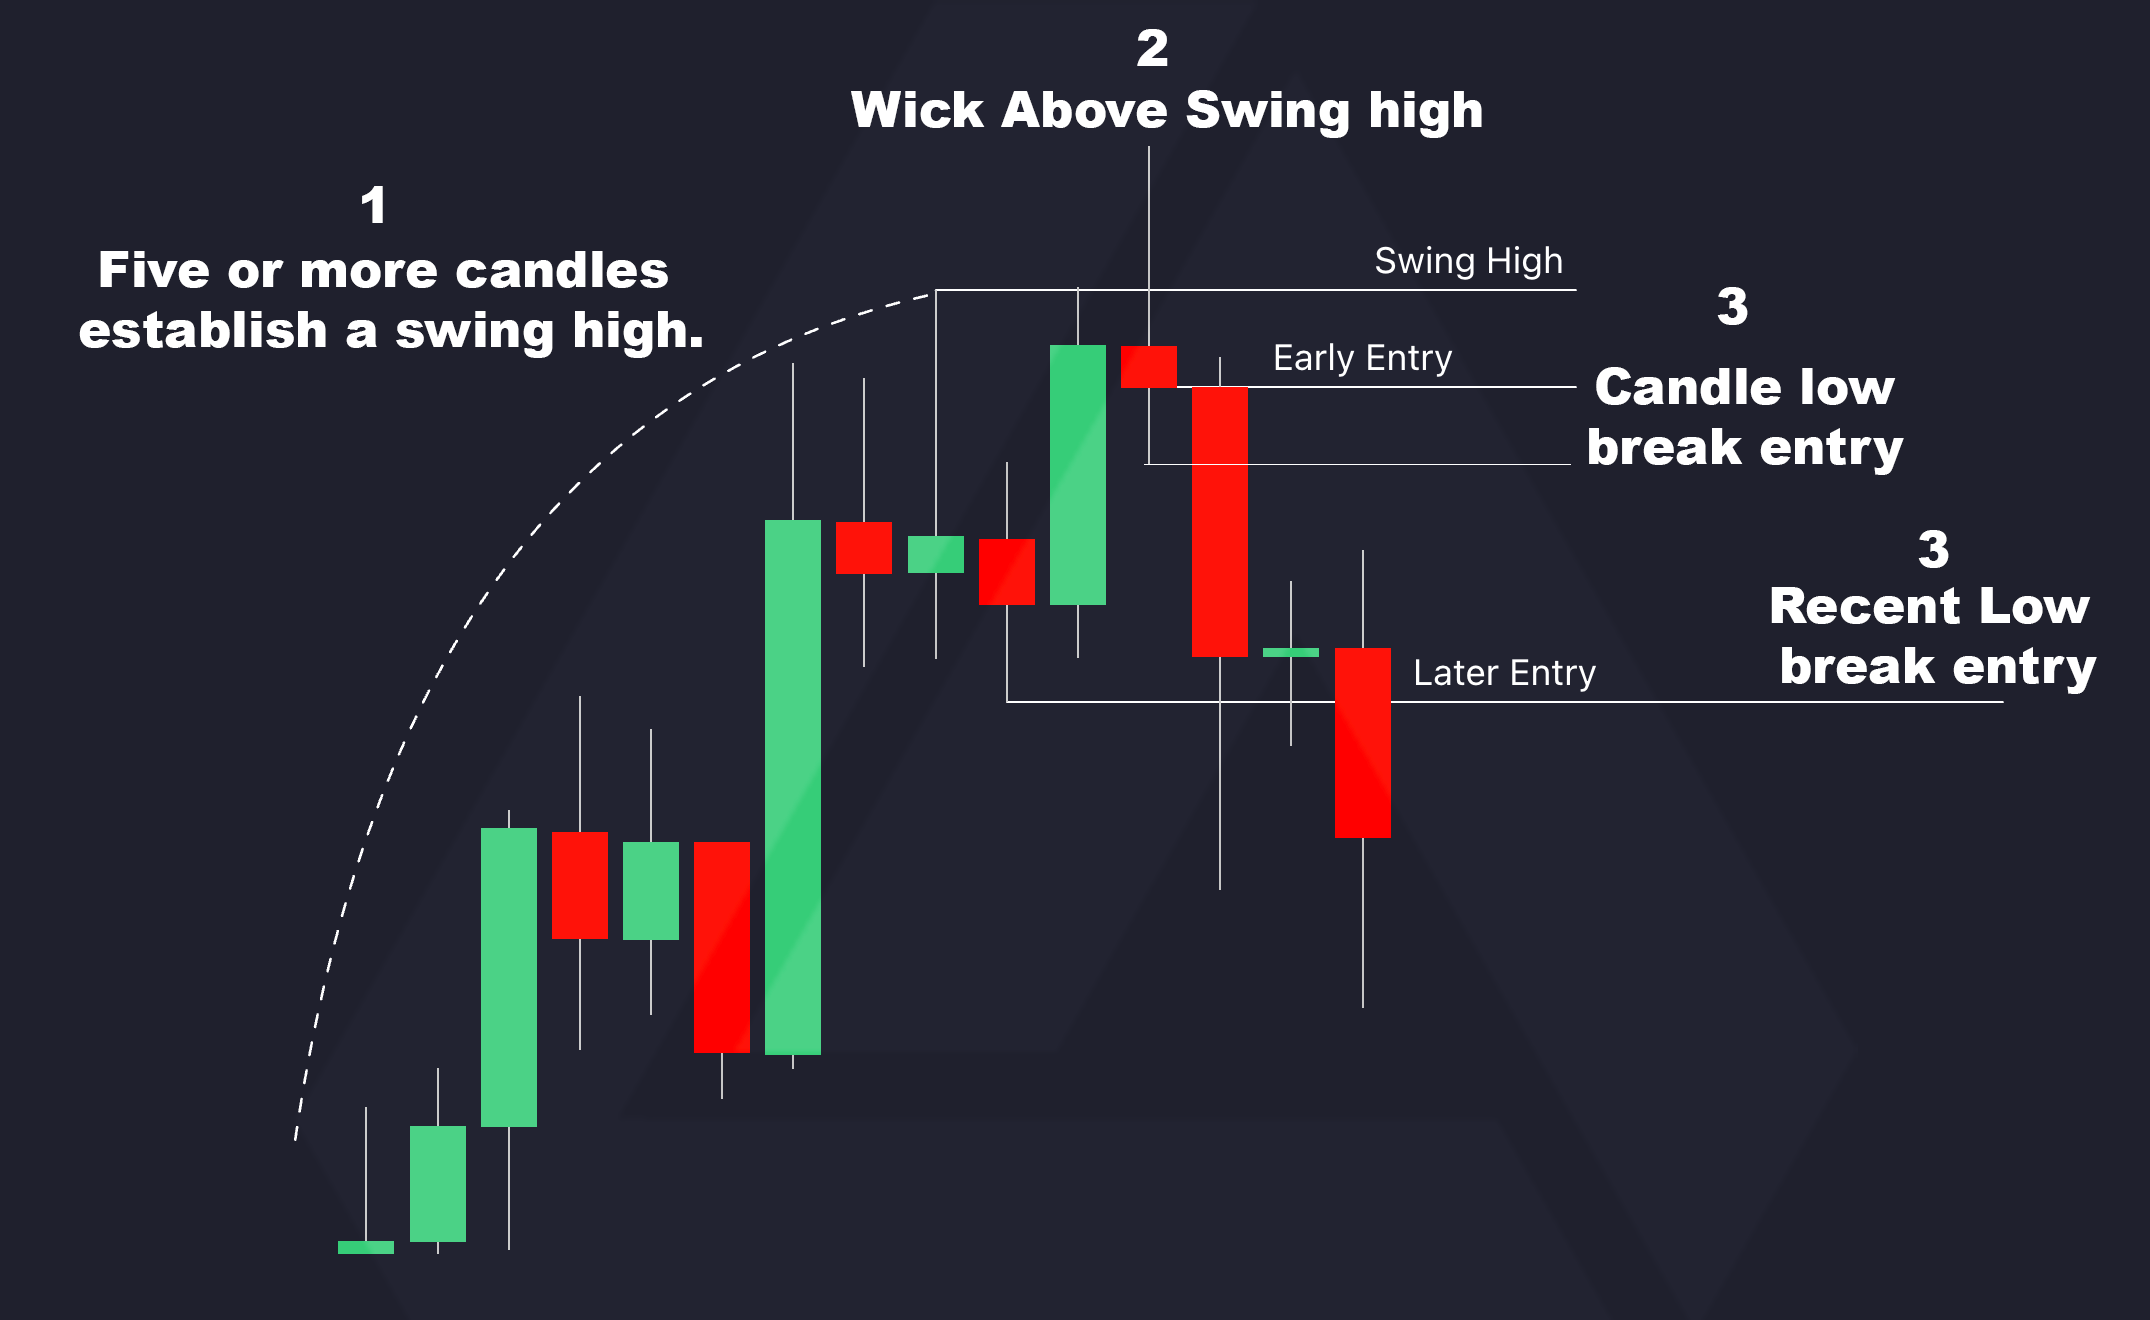
Now, because the origins of the pattern are unclear, there are several variations of this pattern available online. However, the most prominent characteristics are as follows: The swing failure pattern occurs when the market fails to establish a higher high (HH) or lower low (LL) and rejects. When the price rejects above or below the swing level, it needs to also close below that swing level, leaving a wick. It's important that the body of the candle does not close above or below that swing point since that would be categorized as a breakout.
- Swing high/low established.
- Candle wicks above swing high/low (but does not close above/below).
- Entry taken at the break and close above or below the candle that made the wick or level determined by the trader.
- Stop loss placed above the wick.
- Targets determined by trader
Misconception around the Swing Failure Pattern
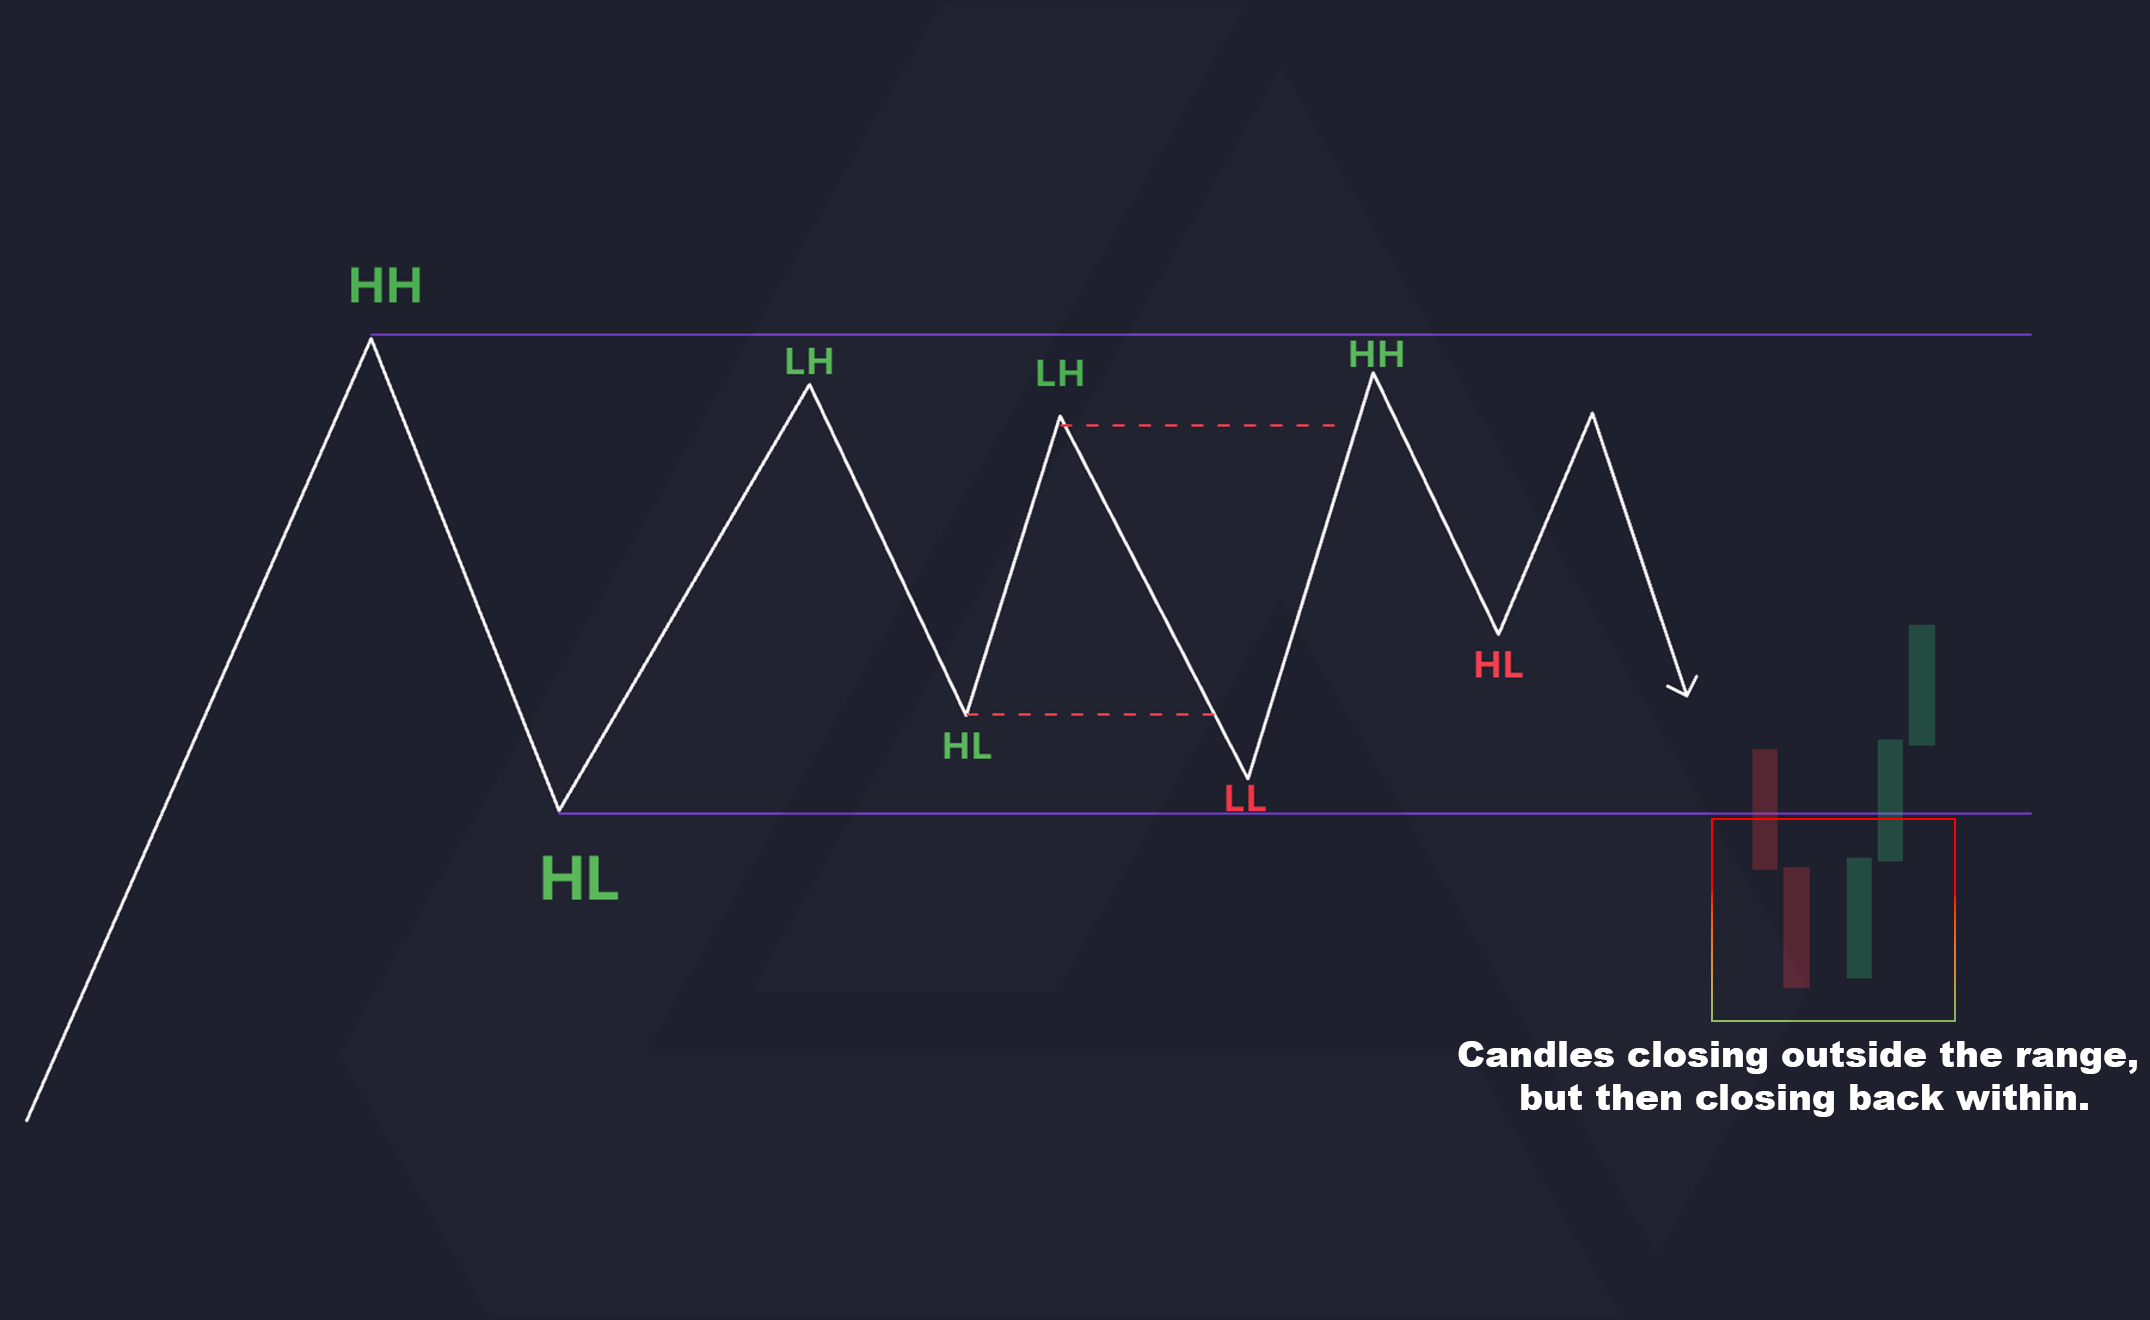
This pattern is often mistaken for a false breakout pattern, but this is not the case. An ideal false breakout is identified when the price is stuck within a consolidation, and a candle closes above or below the range but then closes back within the consolidation.
The important key point here is that a consolidation range needs to be established, and the candle body needs to close above or below the range.
Establishing a consolidation range
One of the most popular ways to determine a range is when the market is failing to make higher highs or lower lows and remains between the higher high and higher low or the lower low and lower high.
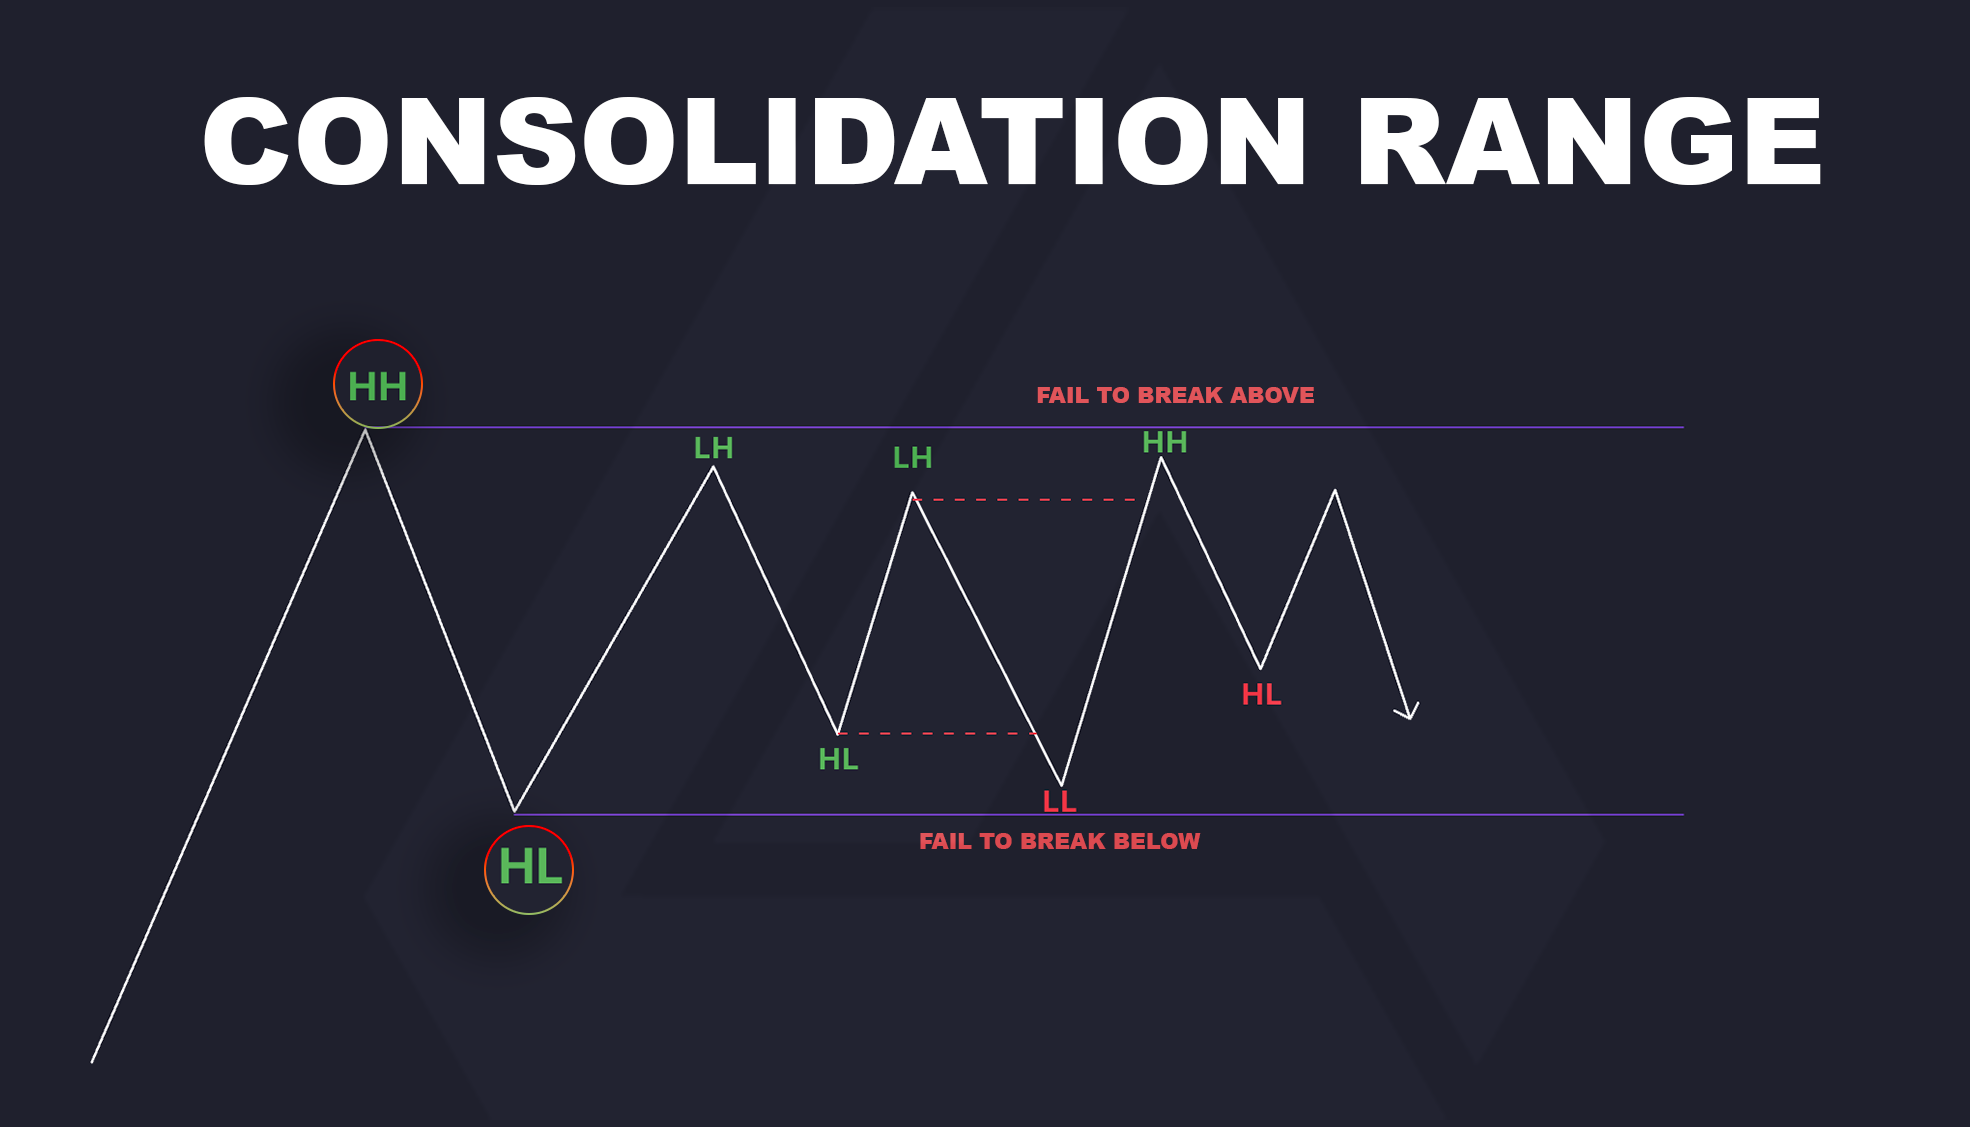
A based breakout from this range will occur when price breaks and close above or break this range and then goes back into the range, creating a false breakout.
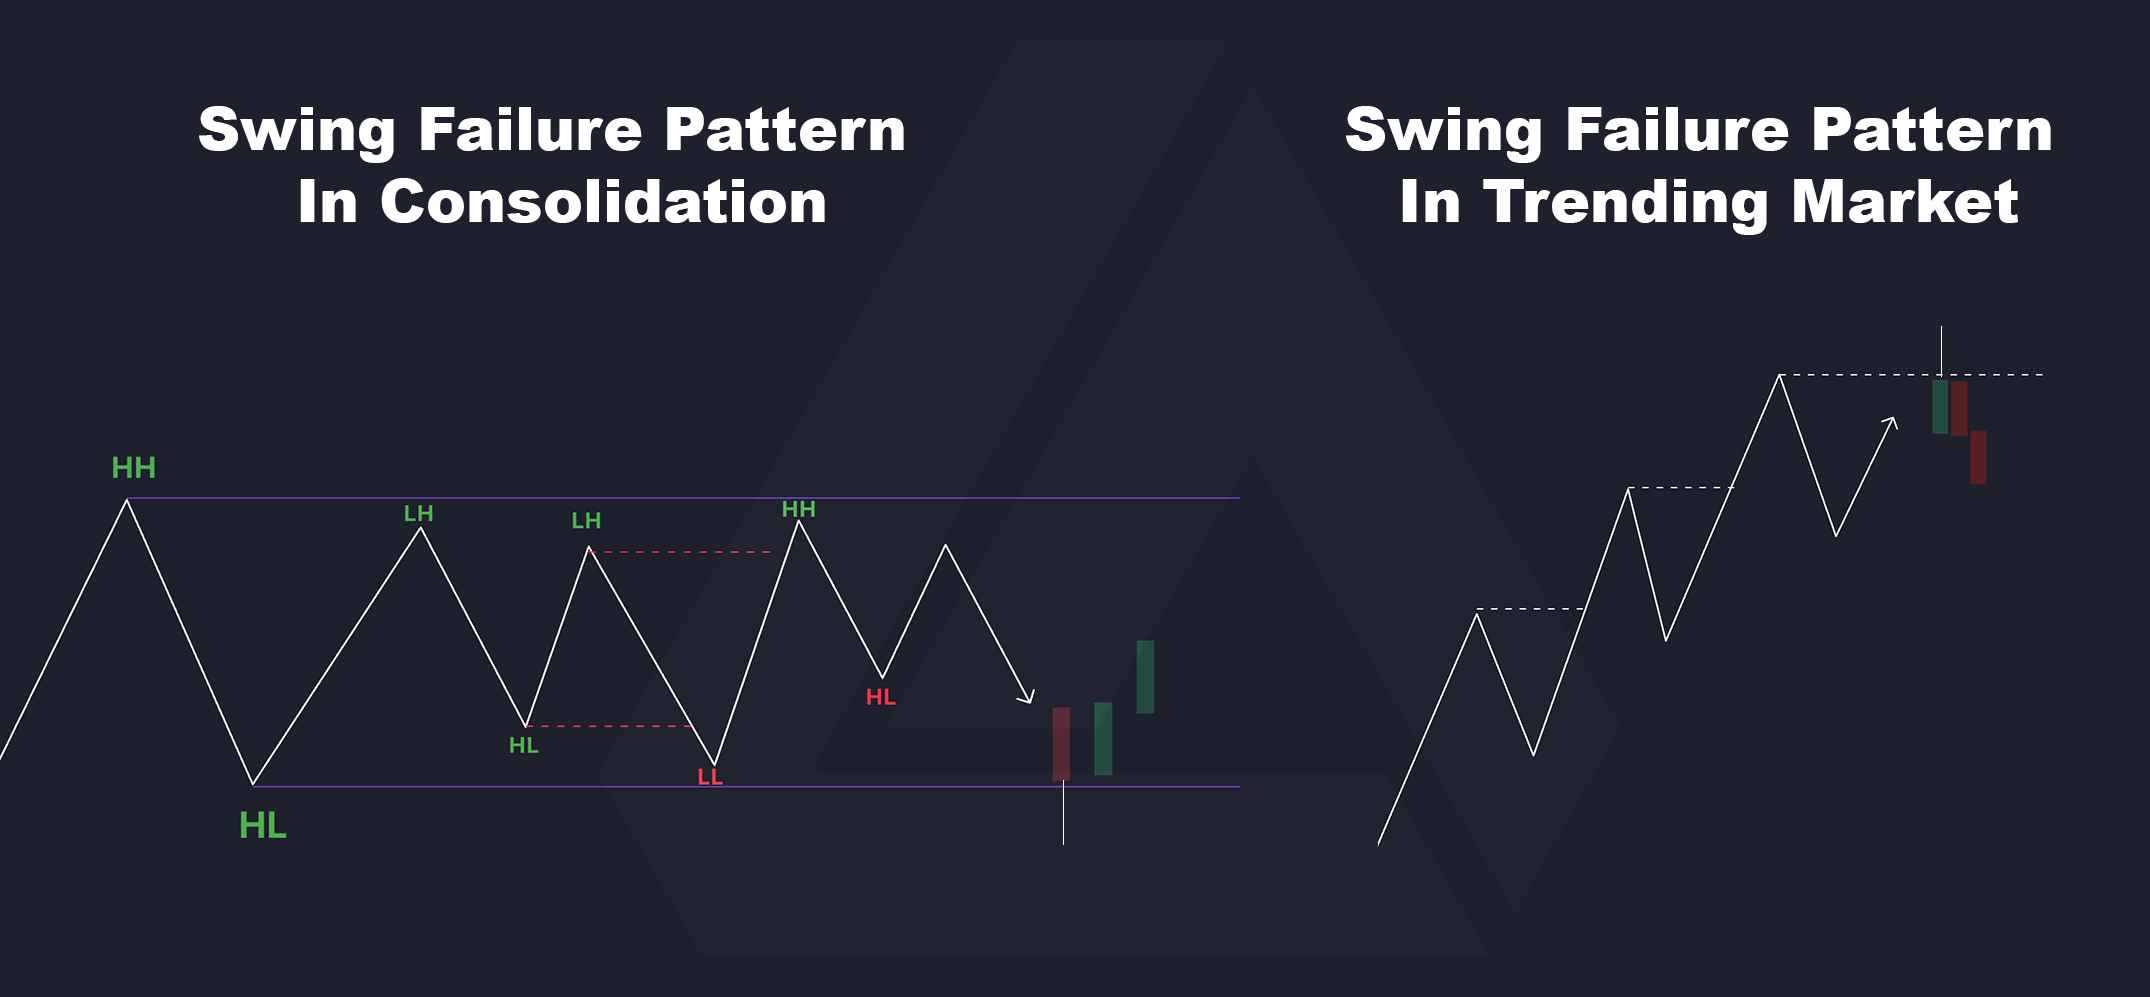
A swing failure pattern can also occur at the upper and lower limits of the consolidation range, but they can also occur within a trending market. So the main difference between a false breakout and a swing failure pattern is that the swing failure pattern can occur within a consolidation range as well as within trending markets, whereas for an ideal false breakout pattern to be identified, the price needs to be within an established consolidation range.
Improving the accuracy of the pattern
The Swing Failure pattern structure resembles the structure of other trading methodologies such as the Wyckoff method and the RSI swing failure pattern, as well as more modern methodologies within the Inner Circle Trader (ICT) trading community. The theory behind many of these patterns and systems is the idea that liquidity is resting above or below these major points within the market, and each pattern or system is another method attempting to capitalize on this liquidity in the hopes of finding market turning points.
This pattern can be very powerful when used alongside centralized markets, where resting orders above or below swing levels can be observed. In decentralized markets, it is a little trickier. The pattern can serve as a way of confirming a pull on liquidity at these levels to indicate market reversals or retracements, which is a very similar concept to the Wyckoff method. Automating this analysis of the volume data can prove very useful to traders.
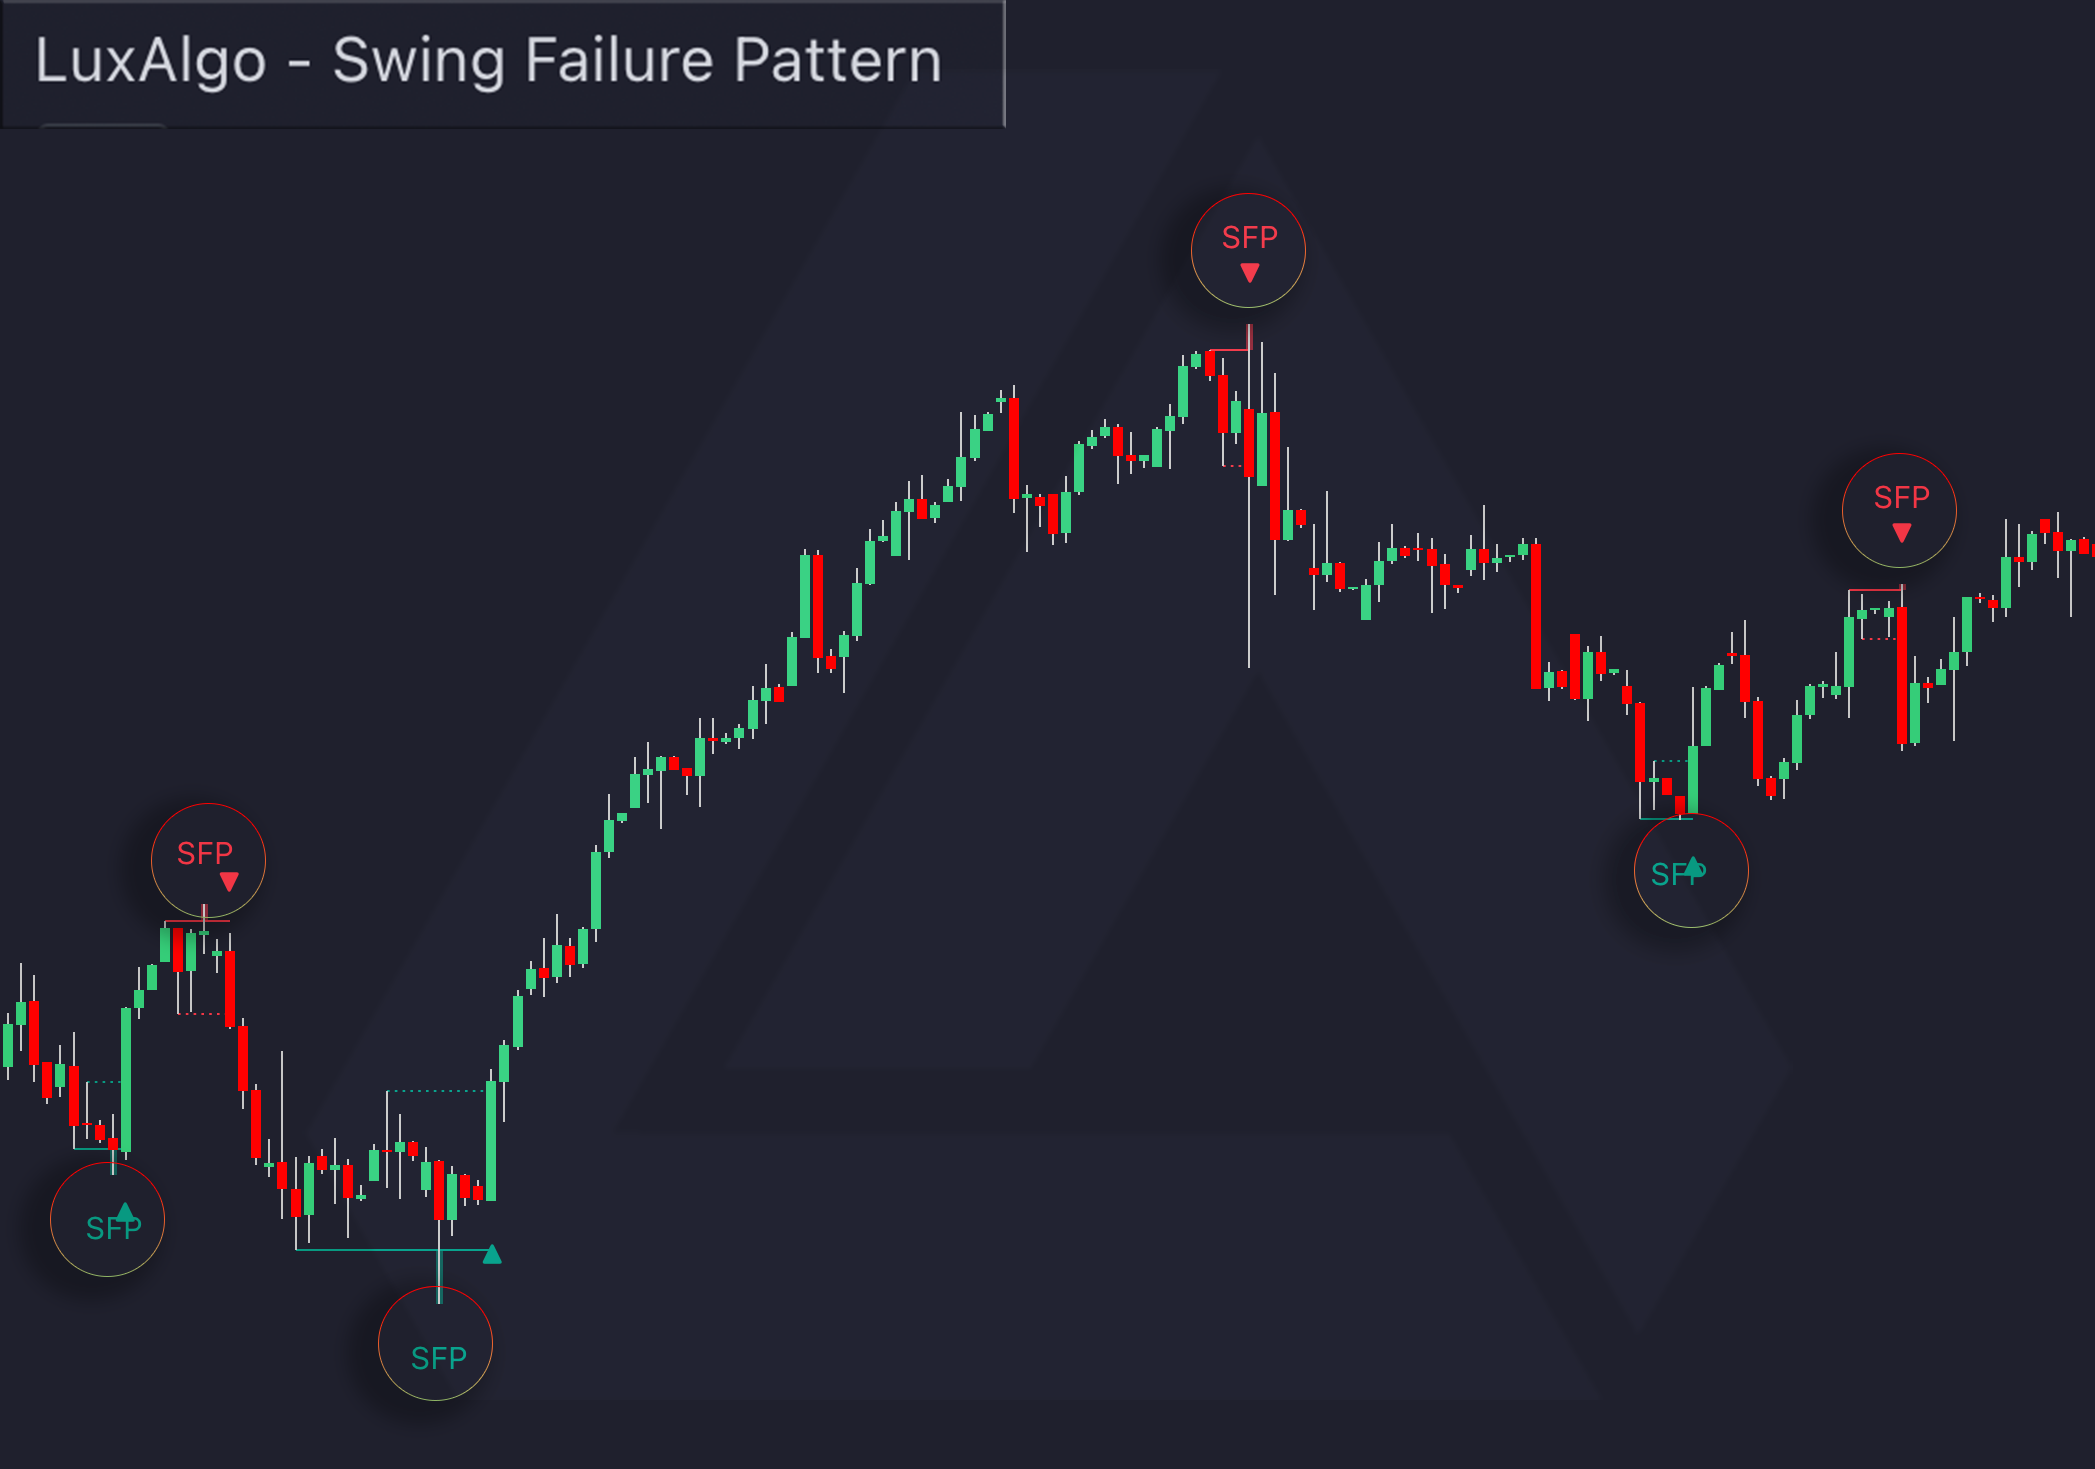
Swing Failure Pattern Indicator (LuxAlgo)
Comparing the volume of the candle outside the swing level versus the volume of the candle under the swing level can provide valuable insights. We developed the Swing Failure Pattern Indicator to automate the entire process of not only detecting the patterns on your chart but also providing volume analysis around the pattern.
This volume analysis that is done on the candle is done using lower timeframe data
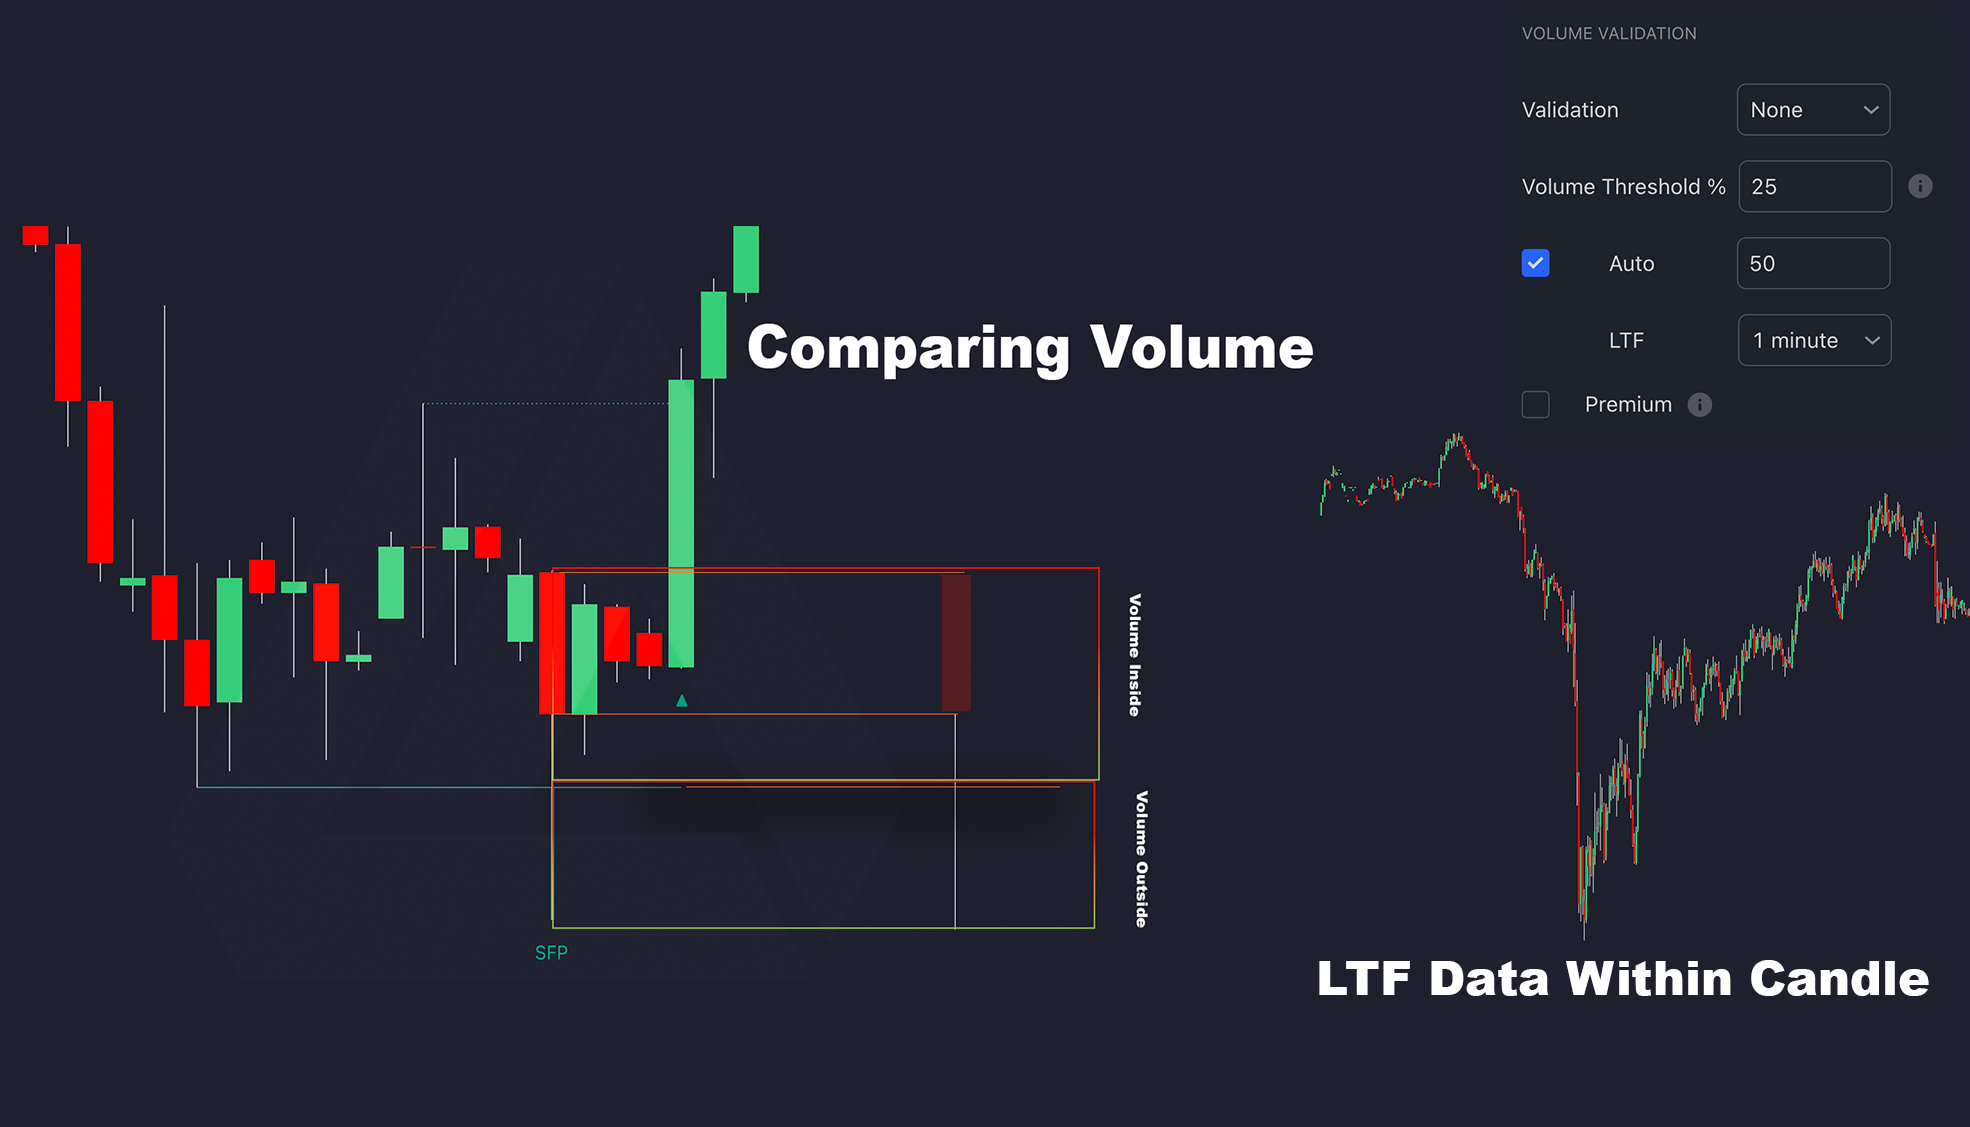
The indicator is fully capable of detecting both bullish and bearish patterns automatically. Volume analysis beyond the Swing Failure Pattern can prove very useful with these liquidity-based patterns. Users should consider tools to use alongside this indicator, such as volume profiles and volume footprint. Below is a video that gives an overview of the indicator, and you can access it for free and learn more about the indicator at the following link. Remember, no indicator should be followed blindly. Stay safe in the markets, and until next time!
References
(1) Technical Analysis of the Financial Markets: A Comprehensive Guide to Trading Methods and Applications by John Murphy - (1999)
(2) The 10 Essentials of Forex Trading by Jared Martinez - (2007)


