
Learn effective intraday trading strategies by utilizing support levels, volume analysis, and momentum indicators for successful breakouts.
Want to trade breakouts effectively? Focus on support levels. These are price zones where buying pressure has historically stopped declines. When prices break below these levels during intraday trading, it can signal profitable opportunities – but only if confirmed by volume and momentum indicators.
Key Takeaways:
- What is a breakout? A decisive price move through support, often signaling a trend shift.
- Why support levels matter: They help define entry points, stop-loss zones, and trend strength.
- Tools to use: Combine volume analysis, RSI, MACD, and exclusive offerings like the LuxAlgo PAC and OSC available on TradingView.
- Risk management: Use stop-losses just above broken support and aim for a 2:1 reward-to-risk ratio.
By combining technical analysis with disciplined strategies, you can improve your intraday breakout trading success.
How to Avoid False Breakouts
Finding Strong Support Levels
Spotting reliable support levels involves combining different analysis methods. These levels are crucial for building effective intraday breakout trading strategies.
Horizontal Support Areas
Look for horizontal support where prices consistently reverse at specific points. Focus on zones that show:
- Multiple price touches with clear rejection patterns.
- Key psychological levels like round numbers (e.g., $100, 4500).
For instance, ES-Mini futures often test round numbers like 4500. On May 14, 2025, this level saw three rejections before breaking down with trading volume 2.5 times the average.
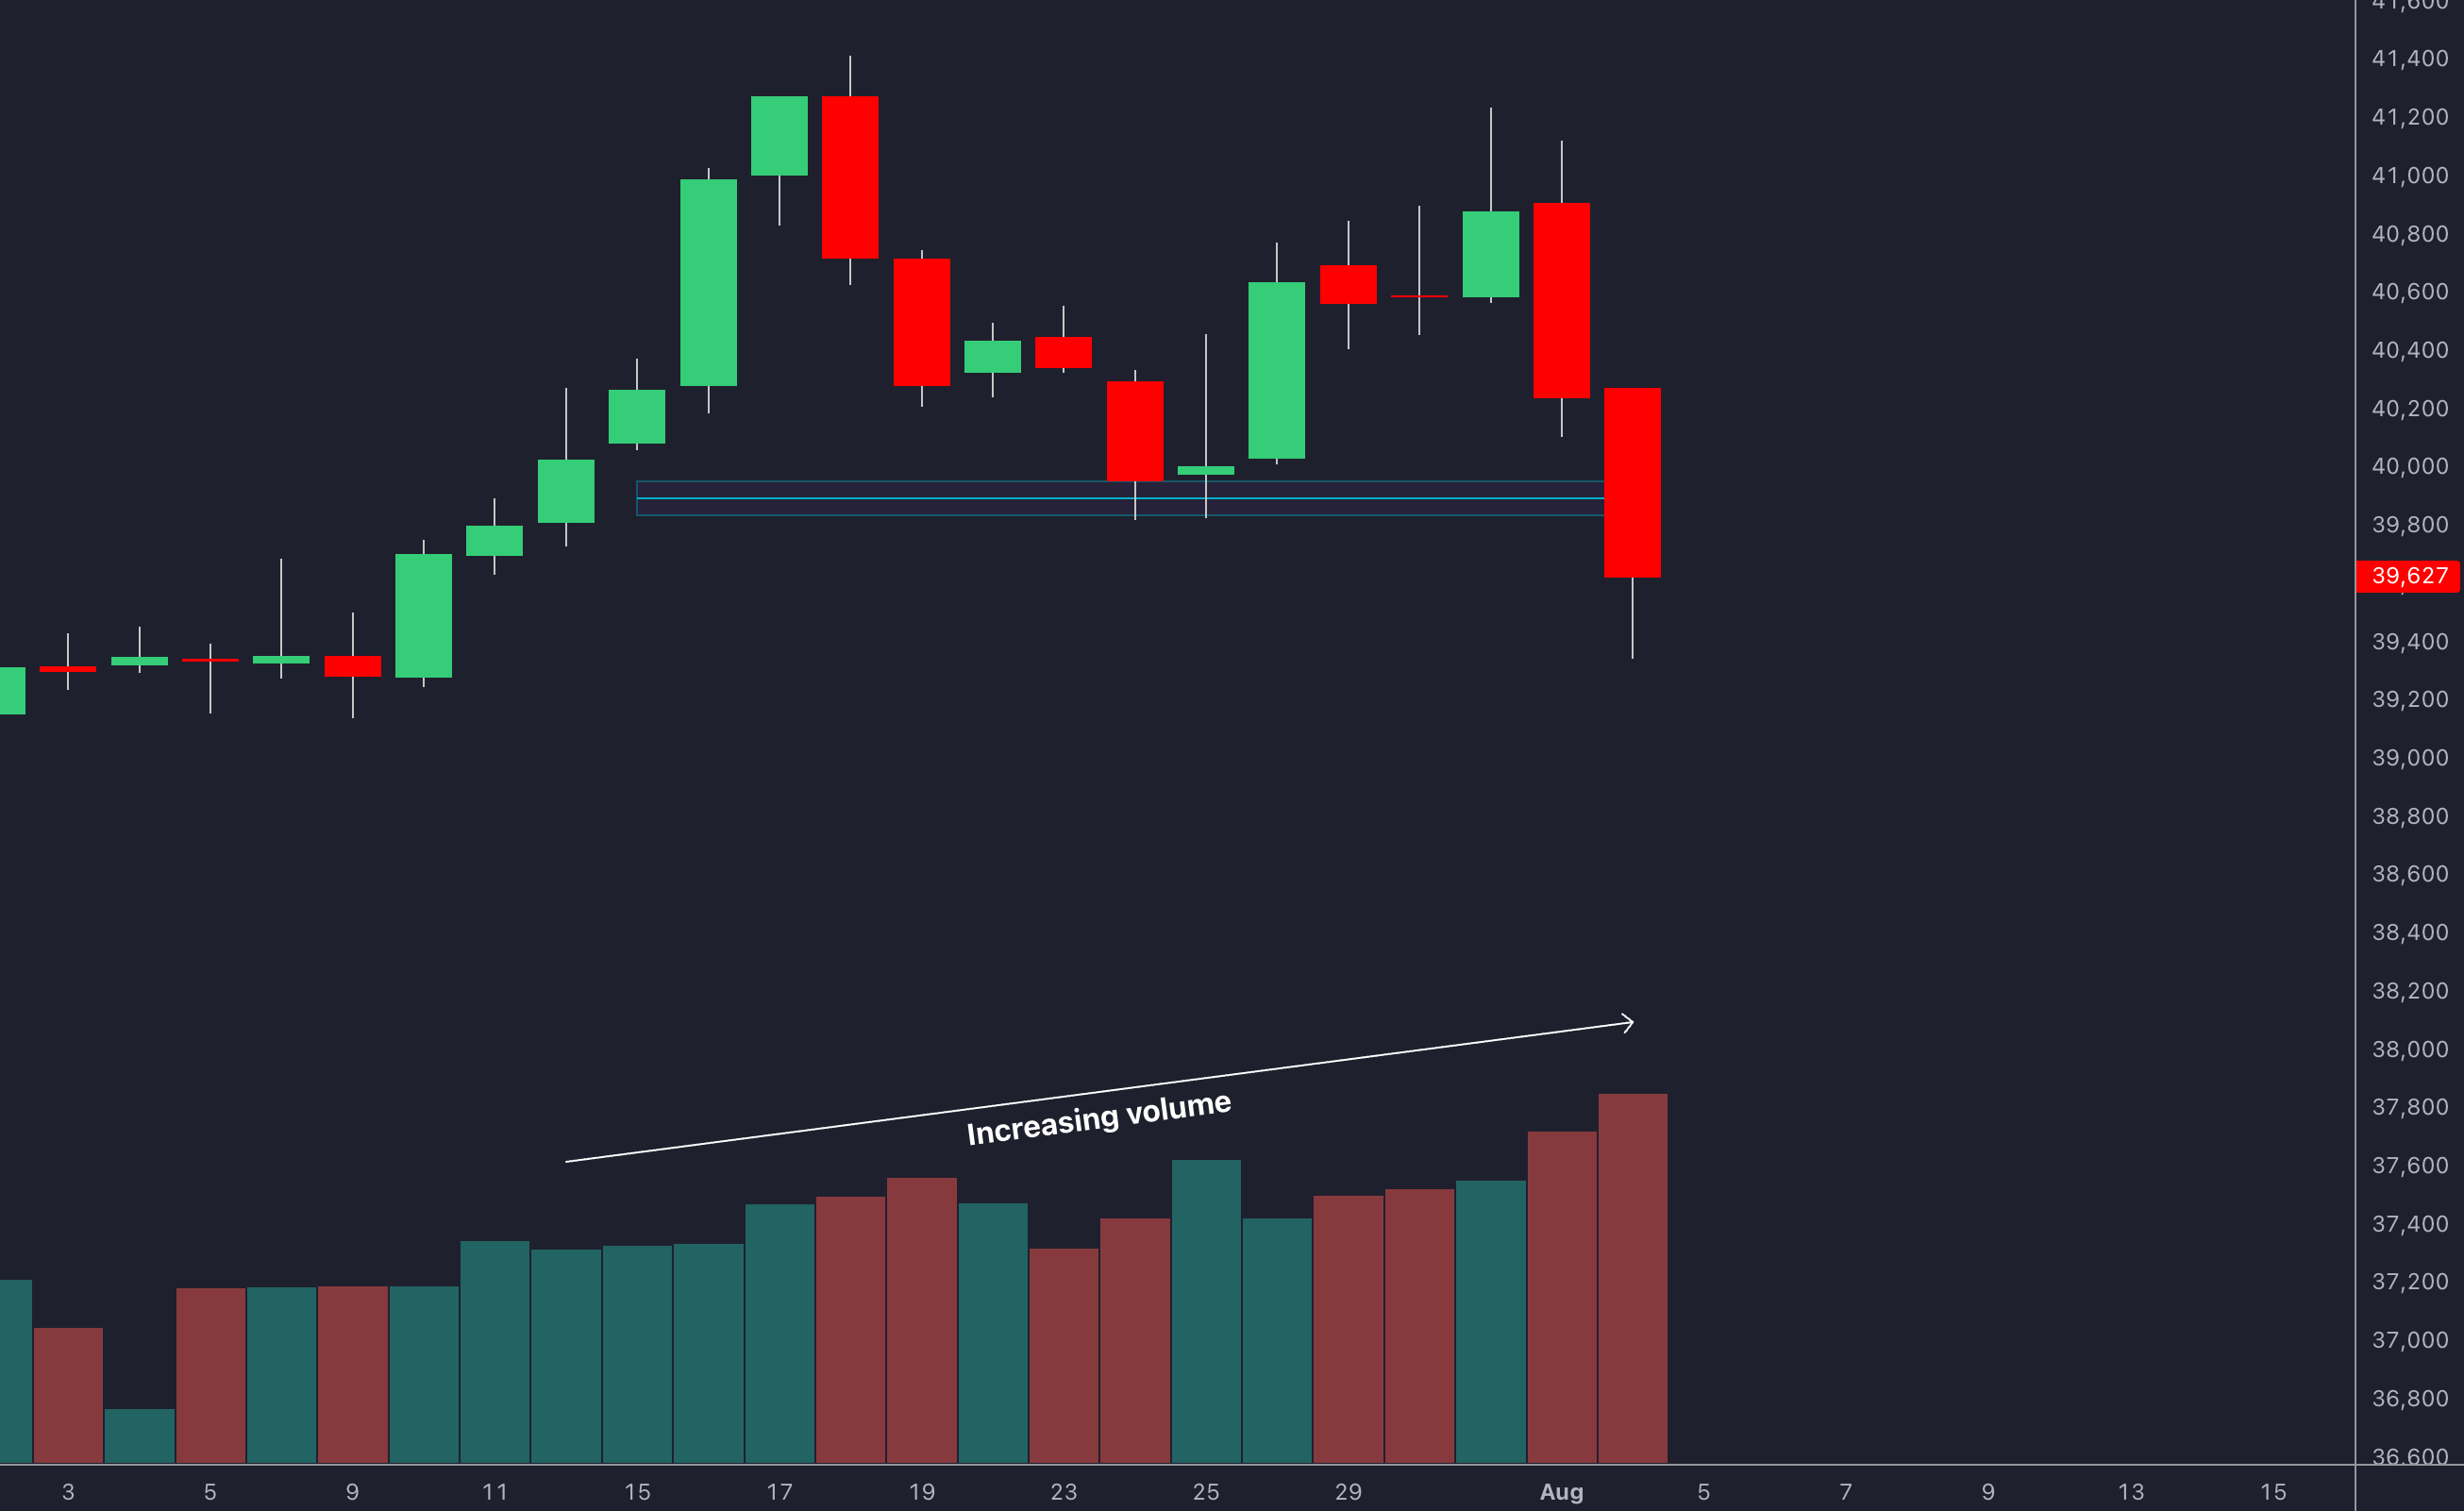
Volume and Liquidity Checks
Certain volume patterns can confirm strong support levels:
- Increased buying volume at the support zone.
- Reduced volume during pullbacks.
- Narrow bid-ask spreads near the level.
- Clusters of high-volume trades.
Support Level Tools
Modern trading platforms offer features that simplify the process of identifying support levels. For example, the LuxAlgo Price Action Concepts (PAC) toolkit automates pattern detection and analyzes market structure, making it easier to find potential support zones.
Key resources for analyzing support levels include:
- Anchored VWAP: Useful in trending markets.
- Volume Profile: Highlights areas of concentrated trading activity.
- PAC Toolkit: Automatically detects overlapping zones of interest.
The most reliable support levels typically occur where three or more methods align. These areas provide the best chances for spotting breakout opportunities, which we’ll delve into next using volume analysis and momentum indicators.
Breakout Signals and Risk Control
Volume and Price Action Signals
Spotting a true breakout requires a close look at volume and price action. For example, when a support level is broken, a real breakout is often accompanied by a volume surge – about 2-3 times higher than the average trading volume [5].
Some key price action patterns to watch for include:
- Engulfing Bearish Candles: Large red candles that fully cover the range of the previous candle.
- Multiple Timeframe Alignment: Breakouts visible across different timeframes, like the 5-minute and hourly charts.
- Failed Retests: Quick attempts to reclaim broken support that get rejected [2].
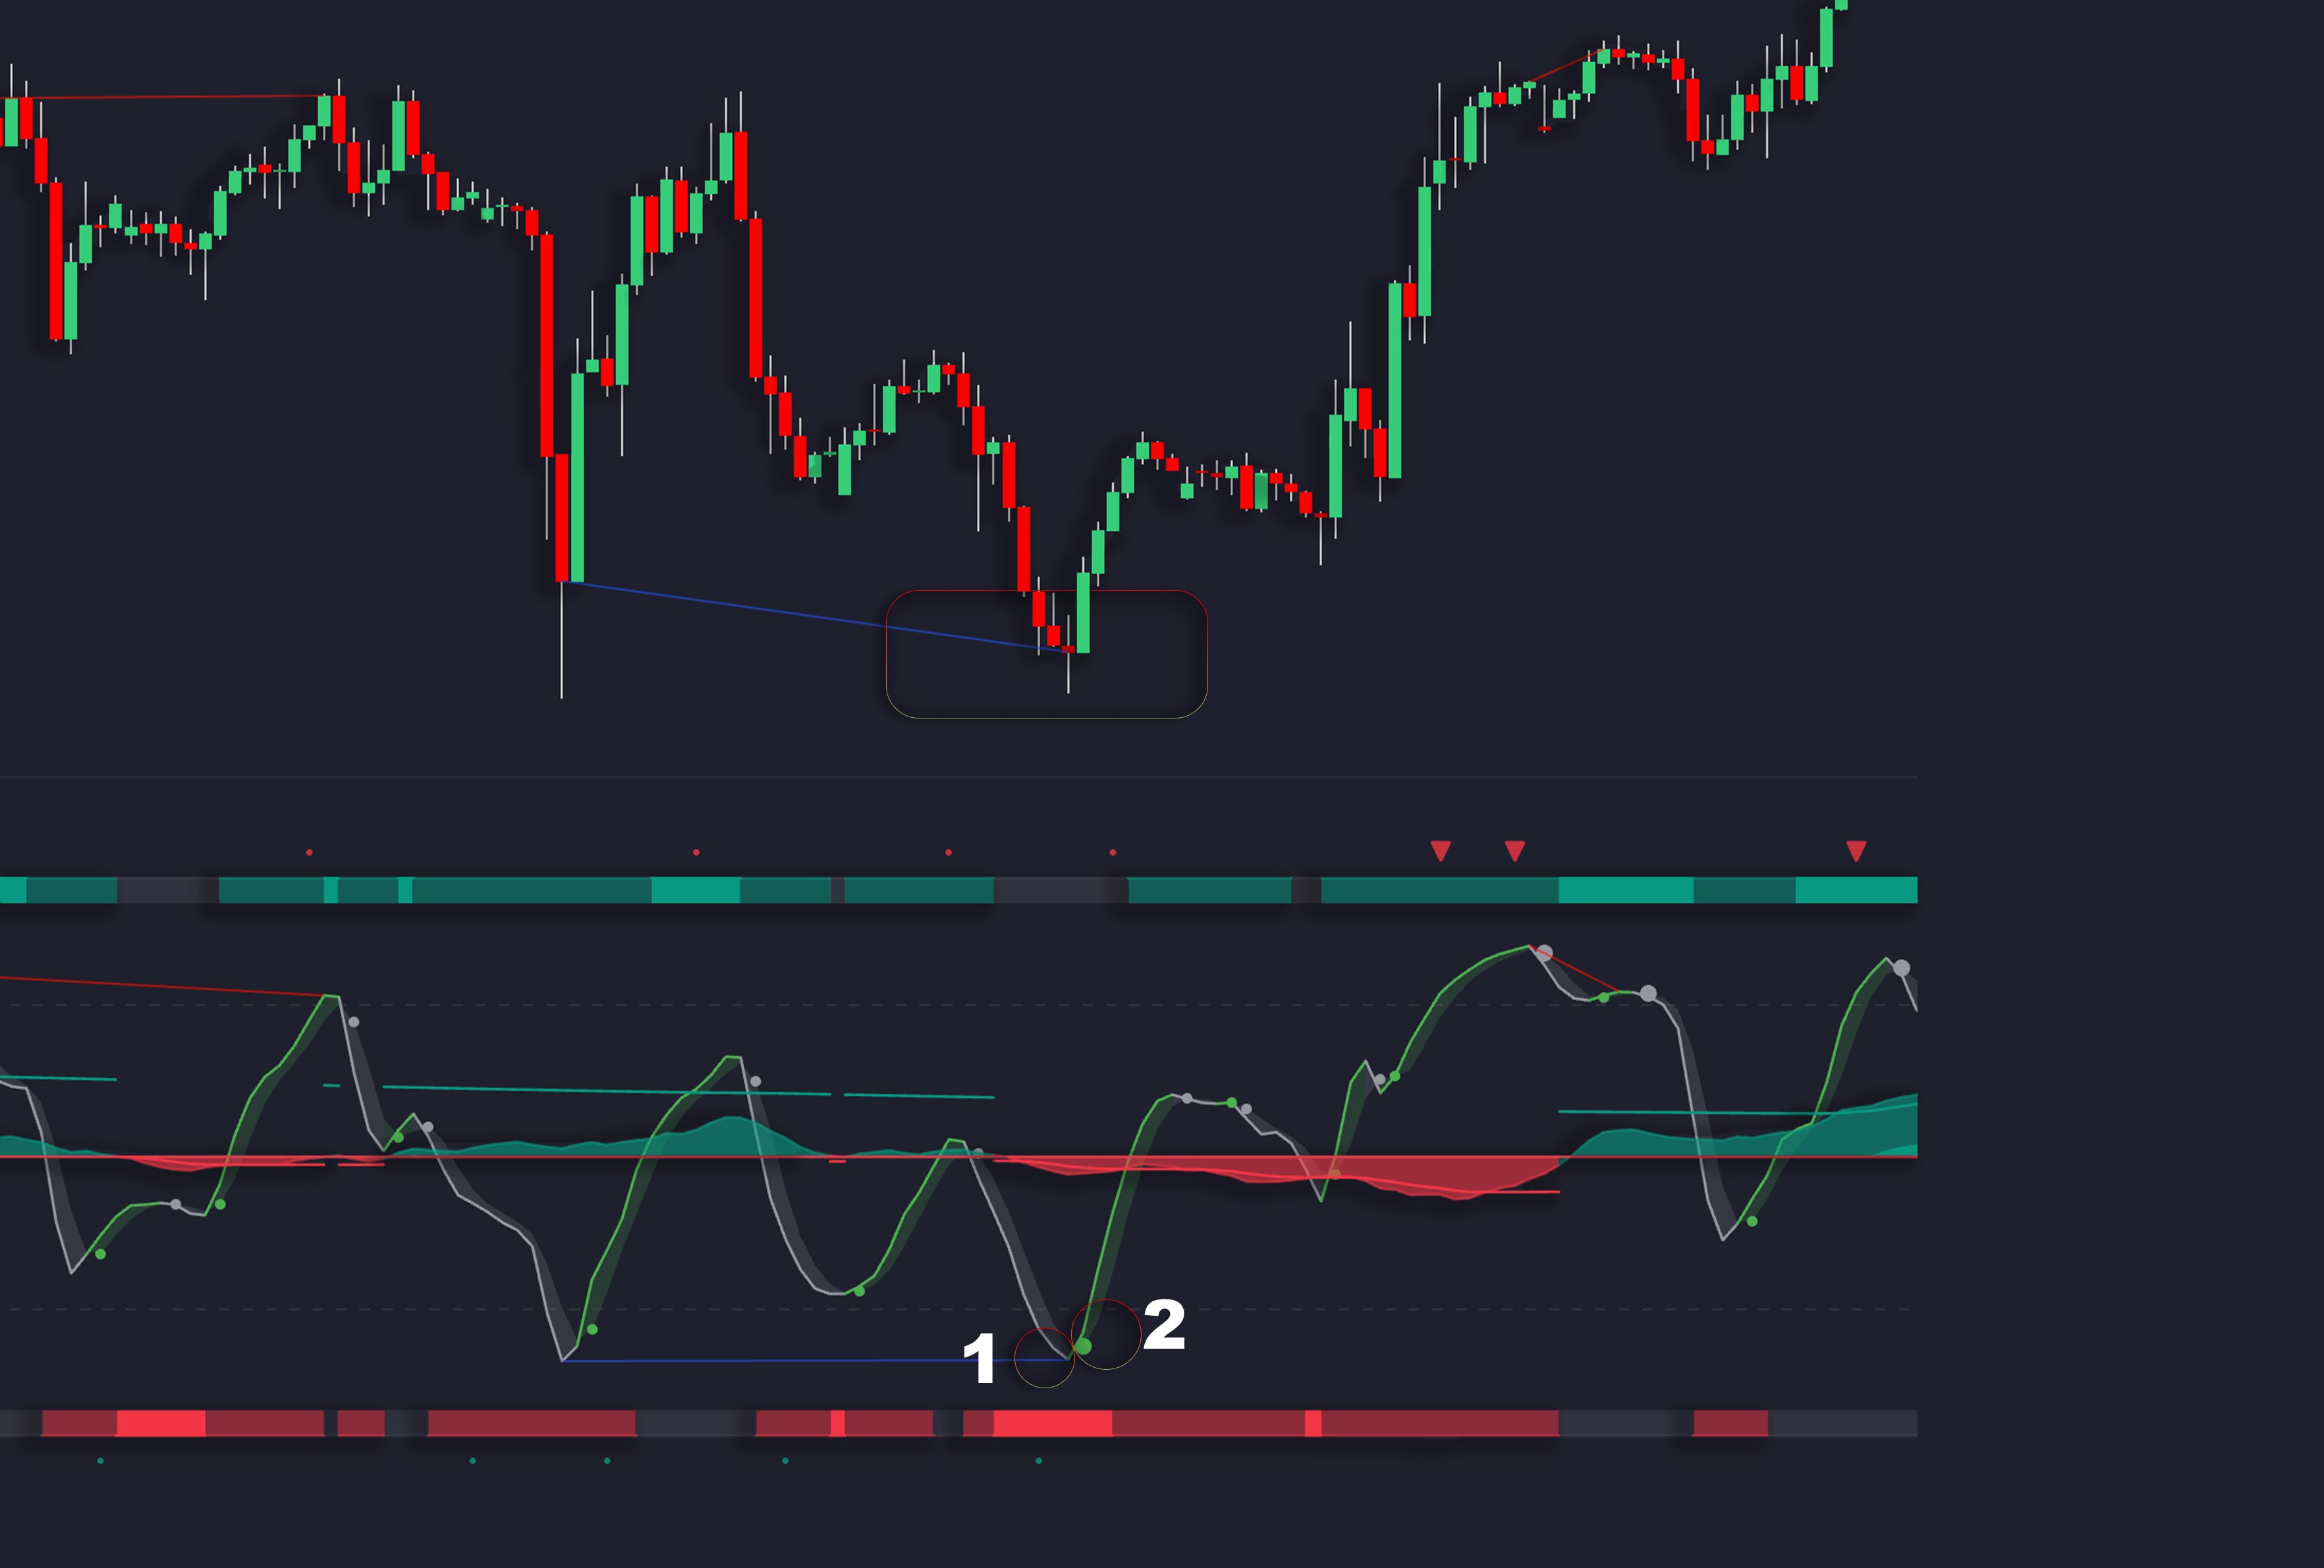
Using Momentum Indicators
Momentum indicators can add another layer of confirmation for breakouts. The most consistent signals include:
- RSI dipping below 30 and trending downward.
- A bearish crossover on the MACD.
- Stochastic %K falling under %D and staying below 20.
LuxAlgo’s Oscillator Matrix (OSC) takes this a step further by identifying divergences across multiple timeframes. This functionality helps traders separate temporary breaks from lasting trends by aligning divergence signals with support level analysis. Its real-time updates make it easier to spot false breakouts [4].
Stop-Loss and Profit Targets
With around 64% of breakouts failing [4], managing risk is non-negotiable. Here’s how to set up your stop-loss and profit targets effectively:
- Stop-Loss Placement: Position stops 1-2% above the broken support level or use 1.5x the ATR (Average True Range) for a more dynamic approach.
- Profit Targets: Aim for at least a 2:1 reward-to-risk ratio. For instance, an initial target could be around $94 to maintain this balance.
LuxAlgo’s volumetric order blocks feature can highlight areas of heavy selling pressure, helping you confirm breakout strength and pinpoint the best exit points [4].
These strategies lay the groundwork for advanced trading techniques, which we’ll dive into next.
Trading Tools for Breakouts
LuxAlgo PAC for Pattern Detection
The Price Action Concepts (PAC) toolkit helps traders quickly identify support zones and breakout patterns. It highlights areas tied to institutional trading activity, making it a valuable resource for breakout trading [5].
PAC offers automated functionality for spotting support zones, detecting breakout patterns in real time, and analyzing volume trends during intraday trading. These insights work well when combined with OSC's momentum analysis for added confirmation.
LuxAlgo OSC Divergence Signals
While PAC focuses on structural patterns, OSC provides momentum-based confirmation with features like:
- Real-time hidden divergence alerts
- Tracking institutional money flow
- Signal alignment across multiple timeframes
OSC’s standout capability is uncovering divergences that aren’t visible on standard price charts, especially during the high-activity London/New York trading overlap. This makes it easier for traders to identify potential reversals in fast-moving markets [2].
LuxAlgo AI Strategy Testing

Once patterns are identified and signals confirmed, traders can fine-tune their strategies with the AI Backtesting Assistant. This platform allows users to:
- Test combinations of indicators
- Analyze volume thresholds
- Assess timeframe performance for intraday trading
The optimization engine helps traders sharpen their breakout strategies by focusing on approaches backed by statistical evidence, tailored for intraday trading instruments [3].
Conclusion
By using the strategies and features outlined, traders can identify and capitalize on support-level breakouts with higher precision and confidence.
Support Breakout Strategy Results
An analysis of 5,000 day trades found that support-level breakout strategies have a 62% success rate when incorporating multi-timeframe analysis and confirming volume signals [1]. Traders who stick to disciplined approaches often achieve risk-reward ratios of 1:2.5 or better by focusing on volume-backed breakouts and zones identified through PAC [4].
Tools That Make a Difference
LuxAlgo’s integrated solutions bring an extra edge to support breakout trading. The Oscillator Matrix (OSC) confirms momentum shifts, while the AI Backtesting Assistant allows traders to test strategies using historical data before the market opens. Together with PAC’s structural insights and OSC’s momentum indicators, these offerings form a well-rounded system for breakout trading.
Steps to Get Started
To start applying a support-level breakout strategy:
- Use LuxAlgo PAC in paper trading mode to practice spotting patterns and aligning multiple timeframes.
- Utilize LuxAlgo’s volatility-based stop calculator to keep trade risk within 1-2% [1].
- Ensure volume confirmation before entering breakout trades.
- Track performance with LuxAlgo’s backtesting reports to refine your approach.
Success in intraday trading comes down to a mix of technical analysis and strict risk management. Traders who combine LuxAlgo’s advanced features with a disciplined mindset often see more consistent results.
FAQs
Here are answers to some common questions about implementing support and resistance breakout strategies:
What is the best indicator for a breakout strategy?
On-Balance Volume (OBV) is often regarded as a top choice for breakout strategies. It tracks cumulative volume changes, helping to predict major market moves before prices shift [4]. To strengthen your analysis, pair OBV with momentum tools like MACD and RSI to confirm the breakout's validity.
What is the breakout trading strategy for intraday?
Intraday breakout trading focuses on entering trades when the price moves beyond key support or resistance levels, trendlines, or chart patterns. Successful traders typically wait for the price candle to close beyond the level and look for increased trading volume as confirmation before making a move.
How to find breakout stocks for intraday trading?
To spot breakout opportunities in stocks, look for these key factors:
- Technical patterns forming near critical levels
- Unusual volume spikes, ideally 50% or more above the average
- Stocks in sectors aligned with broader market trends
Which indicator is best for breakout trading?
A combination of indicators often provides the most reliable breakout signals. Some of the most effective include:
- OBV: Confirms volume-driven moves
- MACD: Verifies momentum and trend direction
- RSI: Assesses the breakout's strength and sustainability
- Moving Averages: Helps identify dynamic support and resistance levels
How to trade support and resistance breakouts?
For trading breakouts effectively, follow these steps:
- Look for volume surges to confirm the breakout.
- Ensure the breakout aligns with the current market trend.
- Consider entering after a retest of the breakout level.
- Place stop-loss orders just below the breakout zone.
- Use ATR (Average True Range) to set realistic profit targets.