Learn how to identify and trade the inverted cup and handle pattern, a key indicator of market declines, with practical strategies and insights.
The inverted cup and handle pattern is a bearish chart pattern that helps traders identify potential market declines. It consists of two main parts: an upside-down "U"-shaped cup and a short upward retracement (the handle). This pattern signals a possible trend reversal from bullish to bearish, often appearing after strong uptrends when momentum weakens.
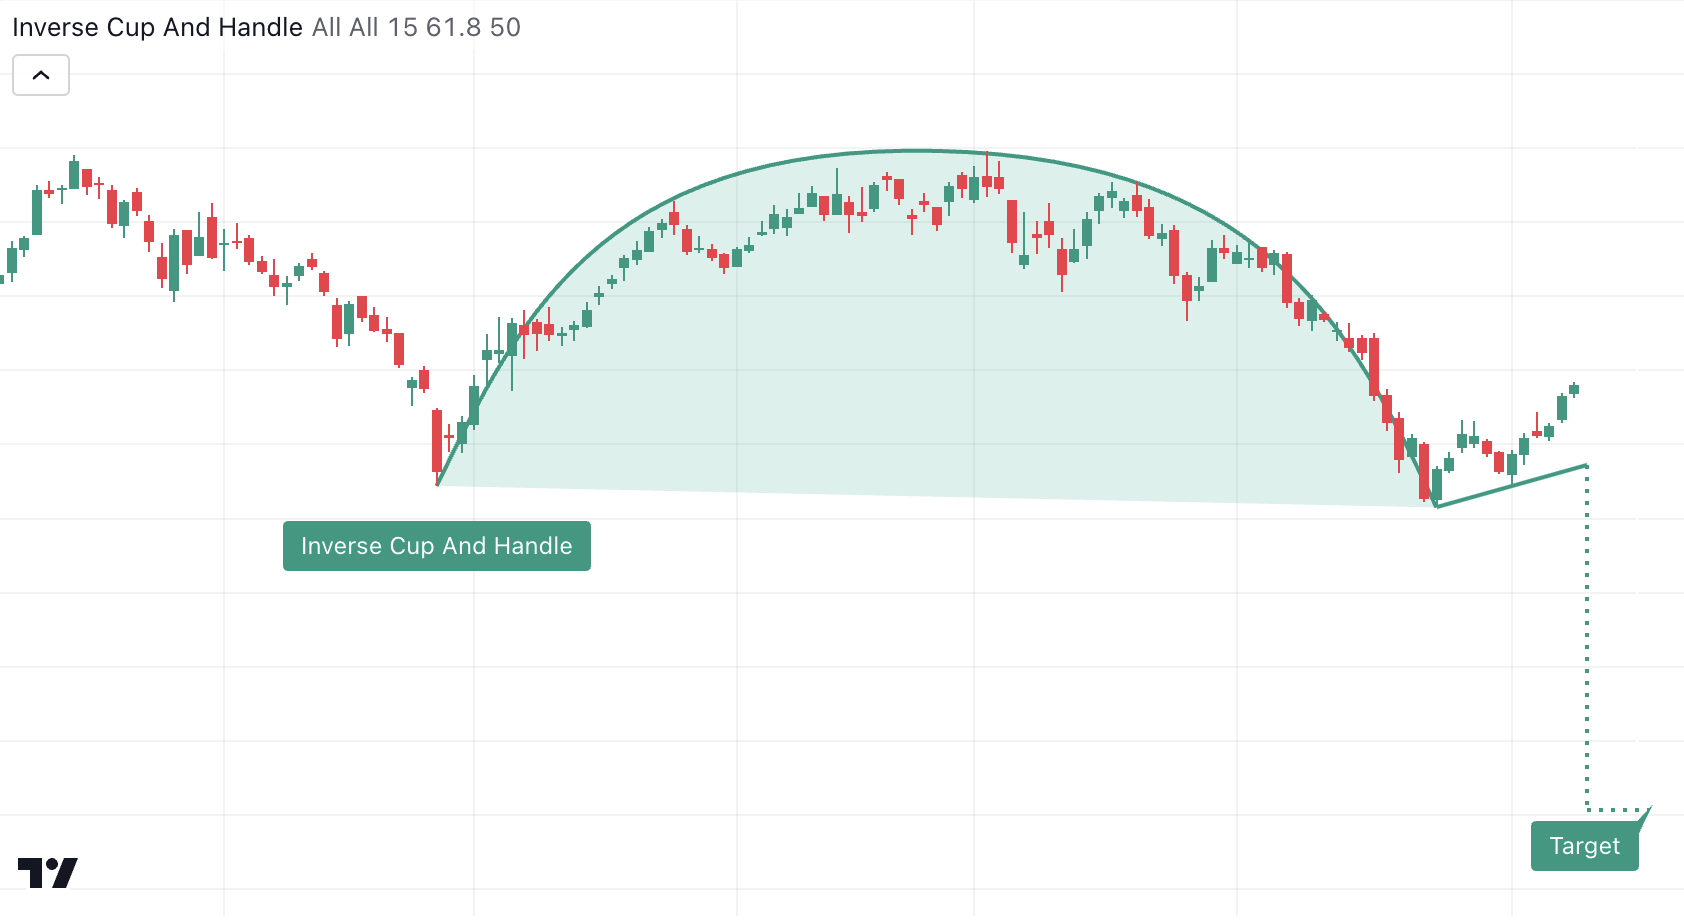
- Shape: Inverted "U" (cup) followed by a small upward retracement (handle).
- Purpose: Detect bearish reversals in price trends.
- Volume: Declines during the cup phase, spikes at the breakdown.
- Entry Point: When price breaks below the handle's support level with high volume.
- Stop Loss: Placed above the handle's high to manage risk.
- Profit Target: Based on the cup's height projected downward from the breakdown.
This pattern is most effective on daily or higher timeframes and works best when combined with volume analysis or AI-powered confirmation available on TradingView. Proper risk management and disciplined trading are essential for success.
Components of the Inverted Cup and Handle Pattern
Understanding the elements of this pattern is key to leveraging it in trading strategies and managing risks effectively. The inverted cup and handle pattern includes specific phases that signal potential bearish market movements.
The Inverted Cup Phase
The inverted cup is the main feature of this pattern. Its rounded top reflects a gradual change in market sentiment. The depth of the cup is critical—it should represent a large portion of the prior uptrend to be considered valid [2][4].
The Handle Phase
The handle phase is shorter than the cup and typically retraces less than half of the cup's height. This phase serves as a final check of any lingering bullish sentiment [2][3]. During this stage, trading volume often drops, indicating reduced buying interest.
Key Characteristics to Watch For
Here are the traits that define a reliable inverted cup and handle pattern:
| Characteristic | Description | Importance |
|---|---|---|
| Cup Formation | Smooth, rounded cup without sharp peaks | Reflects natural market behavior, increasing reliability |
| Volume Profile | Volume decreases during the cup, spikes at breakdown | Confirms the pattern's strength and validity |
| Handle Duration | Shorter than the cup phase | Indicates consolidation before a potential breakdown |
| Pattern Size | Larger patterns lasting months signal stronger reversals | Longer patterns often produce more reliable signals [4] |
These features reflect a shift in market psychology, where bullish momentum fades and bearish trends take over. Advanced technical indicators can help confirm the pattern by analyzing price movements and volume changes.
Trading Strategies with the Inverted Cup and Handle Pattern
Trading the inverted cup and handle pattern involves a structured approach that emphasizes precise entry points, effective risk management, and clear profit targets.
Identifying Entry Points
The best entry point happens when the price breaks below the handle's support level. This break should be obvious and supported by high trading volume.
To confirm an entry signal:
- Wait for the handle to fully develop and monitor for a decisive break below its support level.
- Verify the breakdown with above-average trading volume [2][3].
Indicators such as price action overlays and volume analysis available on TradingView can assist in spotting these breakout points by filtering out false signals using comprehensive technical analysis.
Setting Stop Losses
To protect against losses, place your stop loss just above the handle's highest point. This helps guard against unexpected upward reversals [3].
| Stop Loss Component | Placement Strategy | Reasoning |
|---|---|---|
| Initial Position | Above handle's high | Protects against pattern failure |
| Risk Percentage | 2-3% of trading capital | Keeps risk levels manageable |
| Position Sizing | Based on stop distance | Ensures consistent risk per trade |
Calculating Profit Targets
Profit targets can be calculated by measuring the height of the cup and projecting this distance downward from the breakout point [3]. This method provides a systematic way to estimate potential gains.
- Measure the cup's height and apply it below the handle's breakdown point.
- Consider taking partial profits at key levels during the projected move.
By understanding how to manage entries, stop losses, and profit targets, traders can focus on sharpening their analysis techniques to achieve better outcomes.
"Traders should prioritize clear confirmation signals, volume analysis, and disciplined risk management when trading this pattern."
Tips for Analyzing the Inverted Cup and Handle Pattern
Trading successfully with the inverted cup and handle pattern requires careful observation and solid analysis. Here’s how to fine-tune your approach for better trading outcomes.
Choosing Timeframes
Daily and higher timeframes tend to provide clearer signals by reducing market noise. For instance, daily charts are great for spotting reliable patterns, while 4-hour charts can help identify patterns earlier. However, any findings on shorter timeframes should be confirmed with higher timeframes to avoid mistakes [2][4].
After selecting the right timeframe, it’s essential to verify the pattern to ensure accuracy and avoid costly missteps.
Preventing False Breakouts
False breakouts can lead to poor trades, so it’s important to confirm the pattern before acting. Pay attention to these volume trends:
- Declining volume during the cup phase.
- Low volume during the handle phase.
- A sharp volume increase at the breakdown point.
For added confidence, look for a breakdown with at least 50% more volume than the five-session average [2][4].
Regular Cup and Handle Pattern
The regular cup and handle pattern is a bullish formation that contrasts with its inverted counterpart. It is characterized by a rounded bottom—the cup—followed by a small consolidation period—the handle—before a breakout to the upside. This pattern suggests that after a period of accumulation, buyers are preparing to push the price higher.
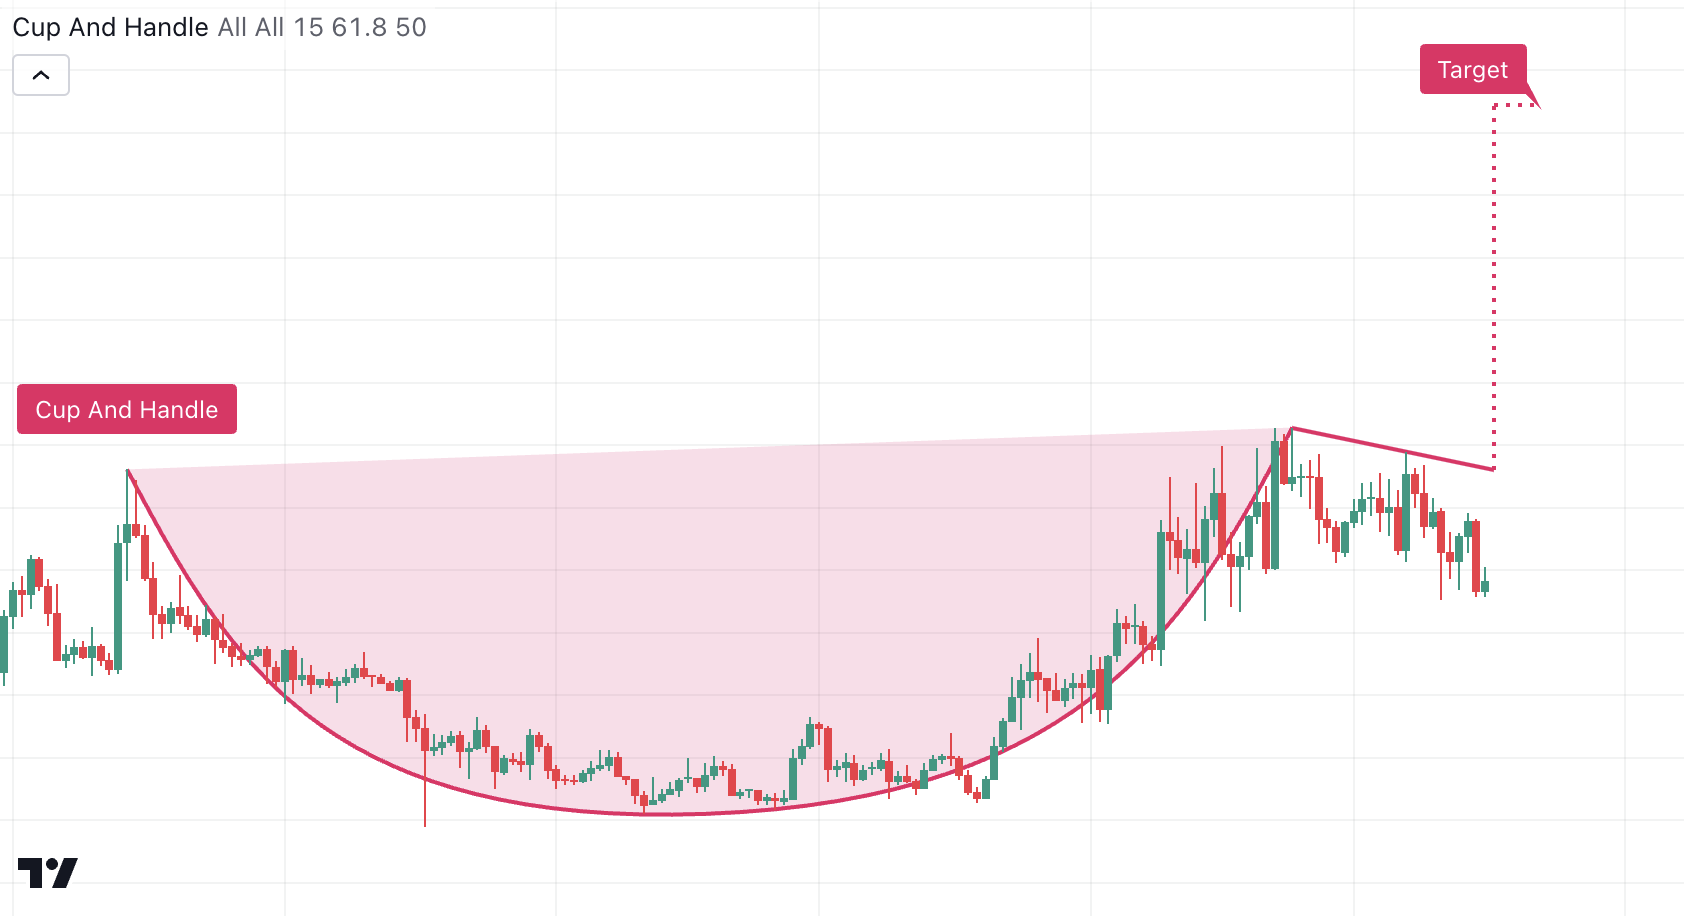
Traders often use the regular cup and handle pattern to identify bullish opportunities, especially on higher timeframes where the cup formation indicates a long-term accumulation phase. When combined with volume analysis and other technical indicators, this pattern can provide a reliable signal for entering long positions.
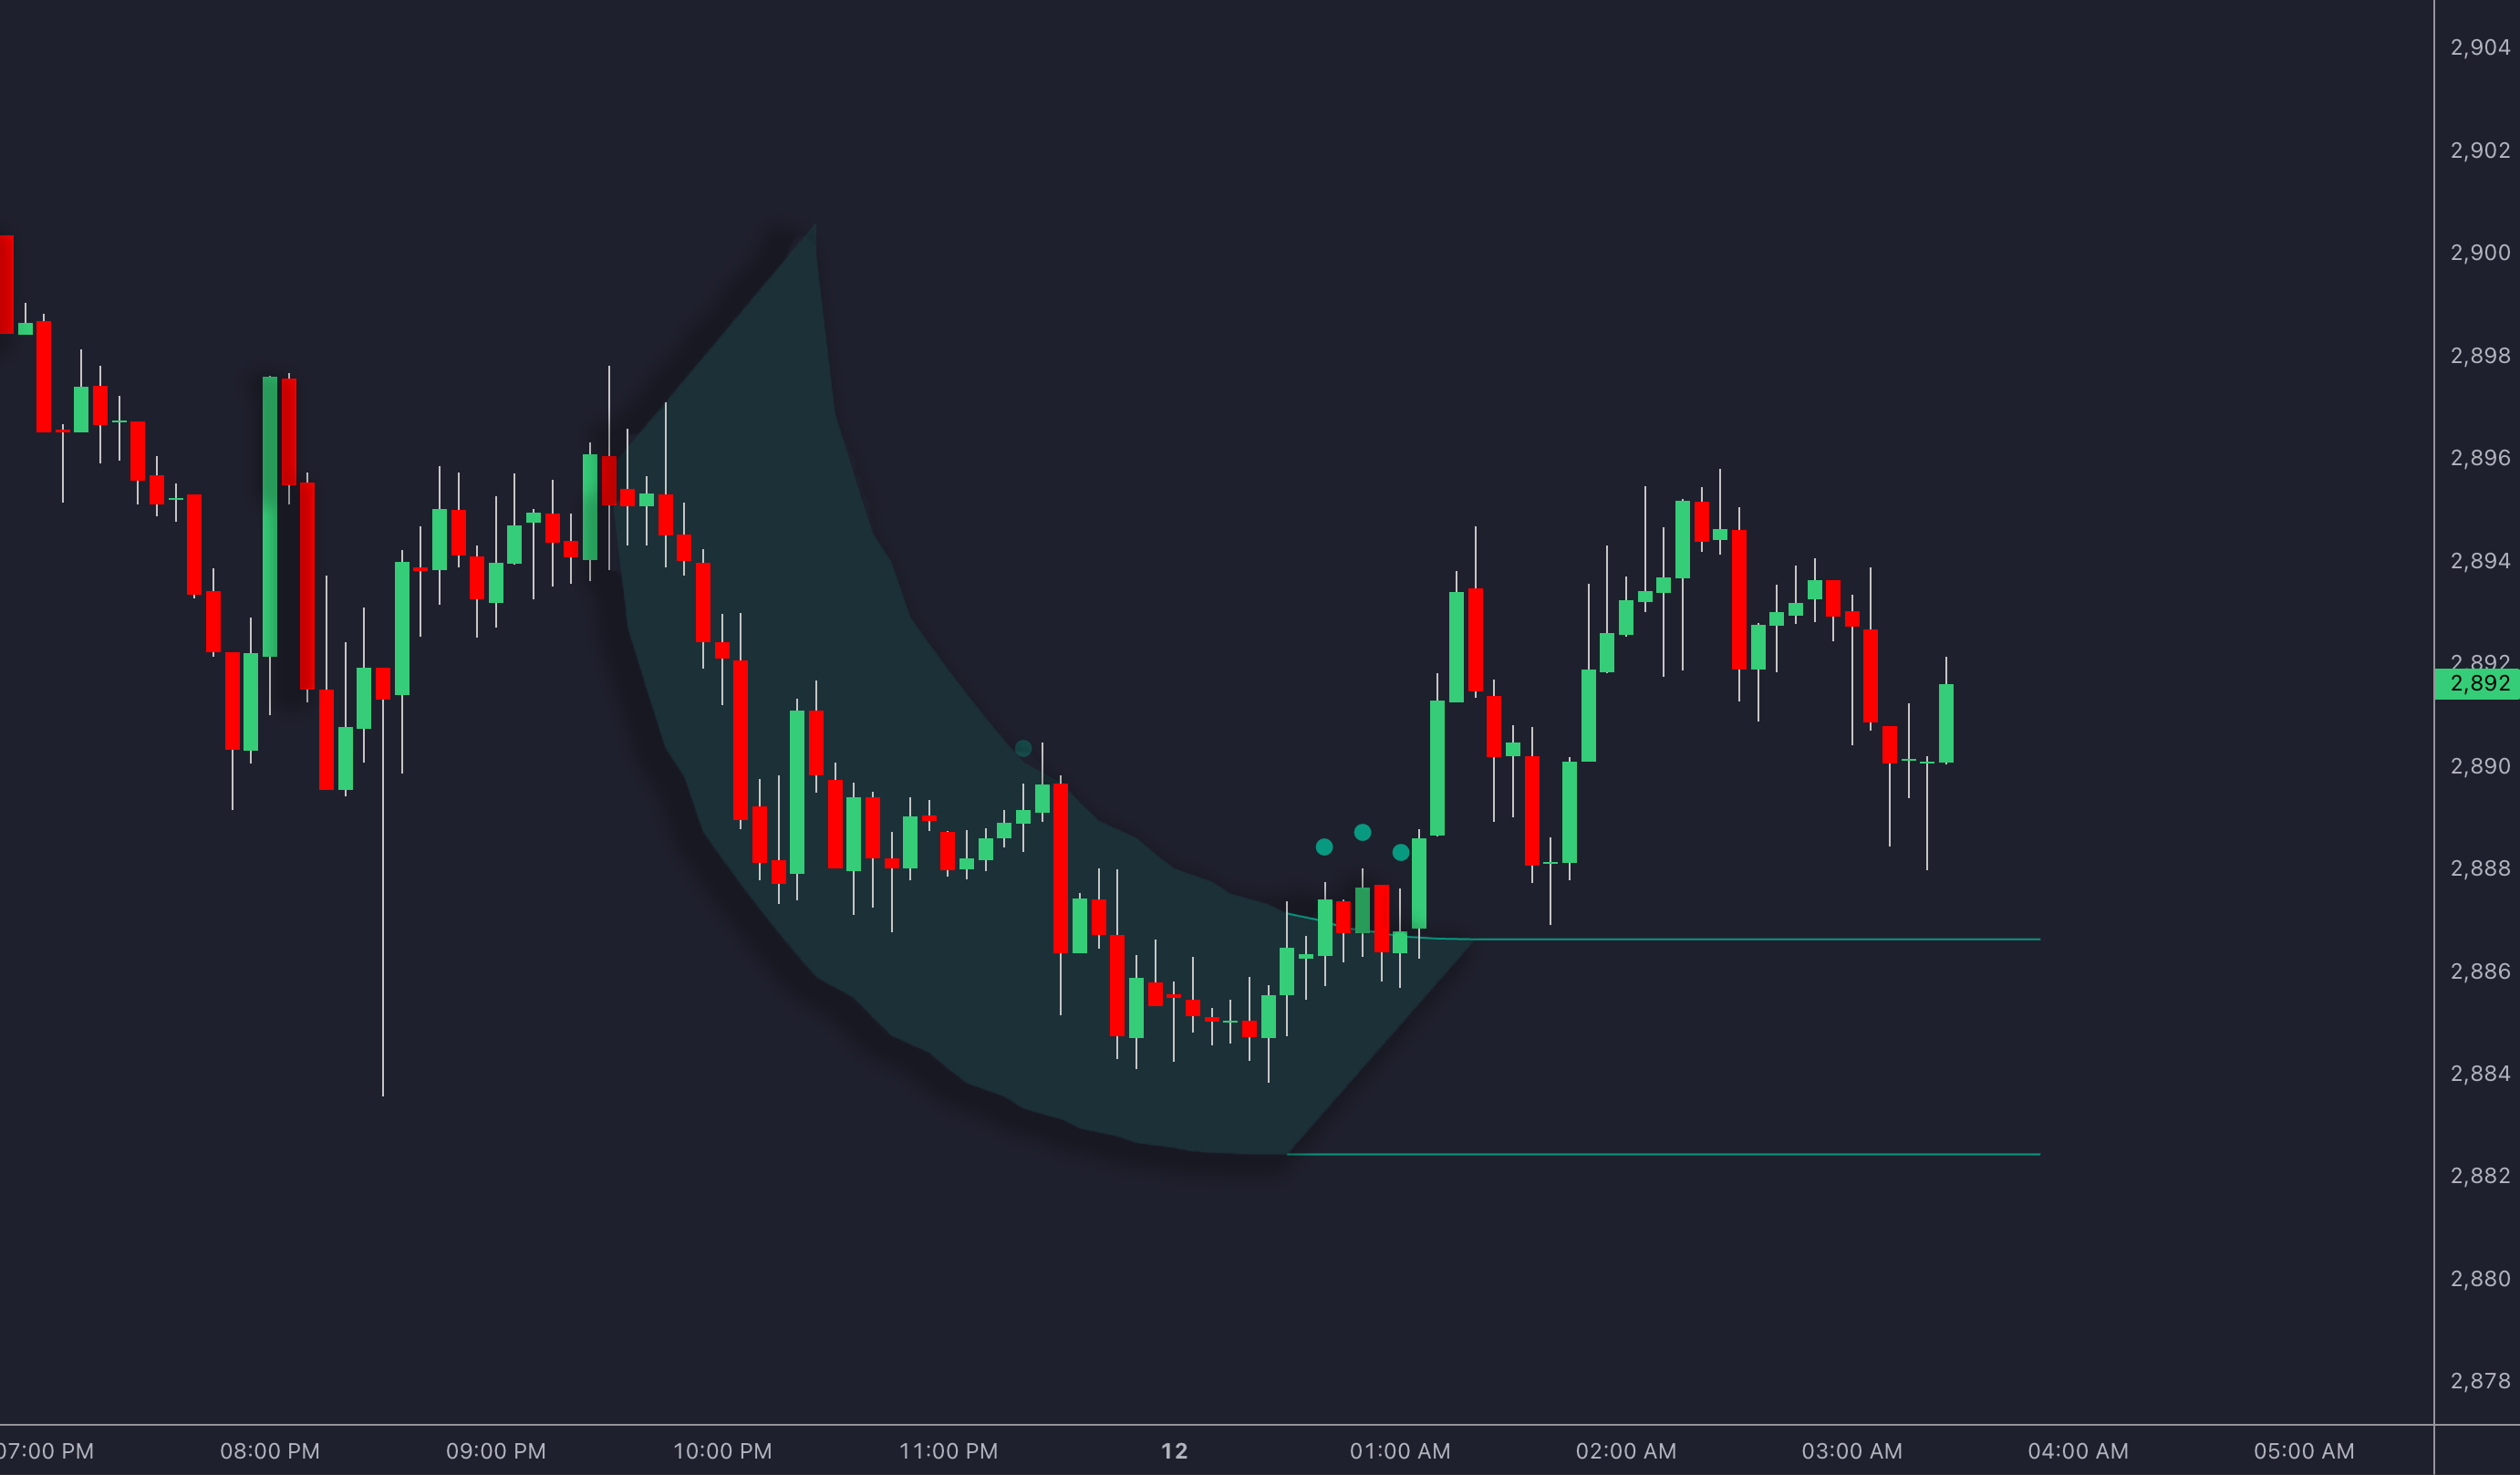
The Half Cup Pattern
In addition to the traditional inverted cup and handle pattern, there is also a half cup pattern featured in the LuxAlgo Library. The half cup pattern represents a variation where only half of the cup formation is present, often signaling a more subtle reversal or an early indication of a trend change. This pattern can offer traders an alternative approach to recognizing market sentiment when combined with other technical indicators and volume analysis.
Conclusion
Key Takeaways
The inverted cup and handle pattern is a useful method for spotting bearish market reversals. It consists of two parts: the inverted cup and the handle. Patterns that form over longer timeframes, such as several months, tend to provide more dependable signals [4]. To trade this pattern effectively, traders need to focus on recognizing it accurately, confirming it with volume analysis, and executing trades with discipline.
Volume plays a critical role in using this pattern. Look for decreasing volume during the cup phase, followed by a noticeable volume increase when the breakdown occurs [2]. This combination strengthens the pattern's reliability.
Practical Tips
When used alongside other technical indicators, the cup and handle patterns become essential methods for navigating market conditions. Here's how to approach trading these patterns:
- Confirm breakdowns or breakouts by checking for volume spikes on higher timeframes.
- Set stop losses just above the handle's resistance (for inverted) or below the handle (for regular) to manage risk.
- Project profit targets by measuring the height of the cup and applying it in the direction of the breakout.
- Validate patterns using a systematic approach with multiple indicators.
Advanced technical indicators and AI-powered backtesting platforms can assist in identifying patterns, but successful trading always comes down to disciplined risk management and patience. Take your time to confirm patterns with different indicators and timeframes before making any moves.
FAQs
What does a reverse cup and handle mean?
An inverted cup and handle is a bearish chart pattern that signals potential price drops. It consists of an upside-down U-shaped "cup" followed by a short upward retracement, or "handle," which indicates weakening momentum.
This pattern is often used to anticipate continued downward trends. When paired with other technical indicators, it can offer trading signals with a success rate typically around 60-70% [3].
Is an inverted cup and handle bullish?
No, the inverted cup and handle is a bearish indicator, pointing to possible market declines as sellers gain control. Traders often rely on this pattern to spot opportunities during downtrends.
Some key points include:
- A price drop is likely after the pattern breaks below its neckline.
- The decline often mirrors the depth of the cup [2].
For example, if the depth of the cup is $10, the expected price drop after the handle breaks could also be around $10. Profit targets are commonly set at 10-20% of the cup's depth [4].
"Experts recommend that traders use the cup and handle patterns in conjunction with other technical and fundamental analysis to increase the accuracy of their trades. They also emphasize the importance of risk management and setting stop losses to limit potential losses."
Advanced indicators and AI-powered backtesting platforms can help confirm these patterns, providing additional confidence in trading decisions.