Learn how Japanese candlesticks reveal market trends and sentiment, providing critical insights for informed trading decisions.
Japanese candlesticks are a powerful element in trading, offering insights into market psychology and price movements. Here's what you need to know:
- What They Are: A charting method that visually represents price action using candlesticks, each showing open, high, low, and close prices.
- Why They Matter: Traders use them to identify trends, reversals, and market sentiment.
- Key Patterns:
- 1-Candle: Doji (market uncertainty), Gravestone Doji (bearish reversal), Dragonfly Doji (bullish reversal).
- 2-Candle: Bullish Engulfing (uptrend signal), Bearish Engulfing (downtrend signal).
- 3-Candle: Morning Star (bullish reversal), Evening Star (bearish reversal).
- How to Use Them: Combine with indicators like RSI, MACD, and volume analysis for better accuracy.
- Risk Management: Always set stop-loss levels based on candlestick shadows.
Quick Overview
| Feature | Description |
|---|---|
| Components | Body, wicks, color coding (bullish/bearish) |
| Patterns | Single, two, and three-candle formations |
| Indicators | RSI, MACD, VWAP, EMAs |
| Strategies | Trend analysis, multiple timeframes |
| Risk Control | Stop-loss below/above pattern shadows |
Candlestick charts simplify market analysis and are a must-know for traders aiming to make informed decisions.
How to Read Candlestick Charts
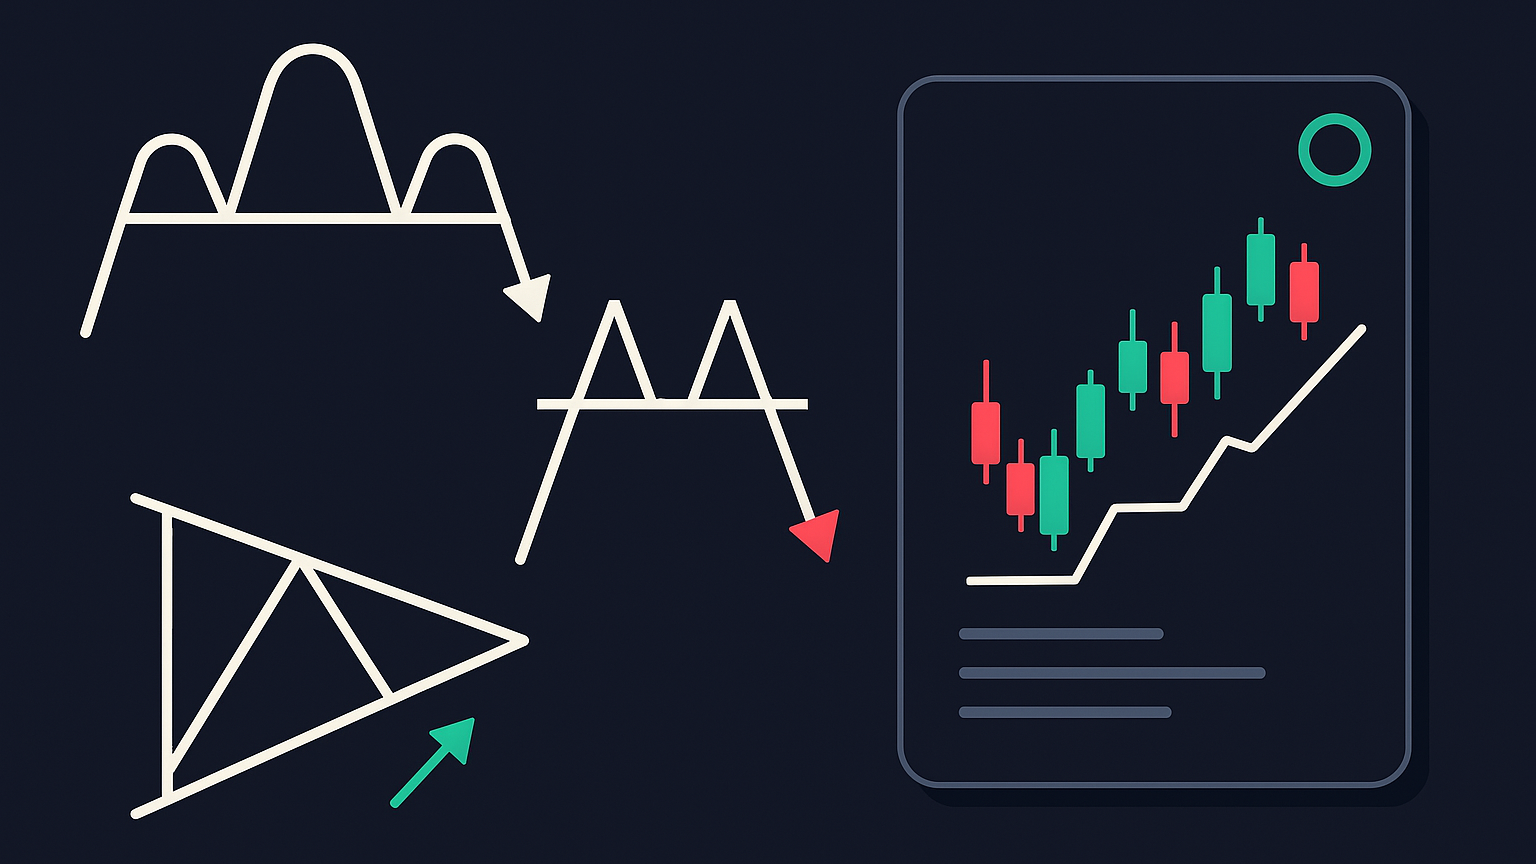
Common Candlestick Patterns
Candlestick patterns, ranging from single to multi-candle formations, provide insights into market behavior and potential price movements. These patterns help traders interpret market psychology and make informed decisions. Below, we break down single, two, and three-candle patterns, laying the groundwork for more advanced trading strategies.
1-Candle Patterns
One-candle patterns are straightforward but powerful. A classic example is the Doji, which forms when the opening and closing prices are nearly the same. The word "doji" comes from Japanese, meaning "the same thing", reflecting this price balance.
Here are the three main types of Doji patterns:
| Pattern Type | Description | Signal |
|---|---|---|
| Gravestone Doji | Long upper shadow only | Possible bearish reversal |
| Dragonfly Doji | Long lower shadow only | Possible bullish reversal |
| Long-legged Doji | Shadows on both sides | Market uncertainty |
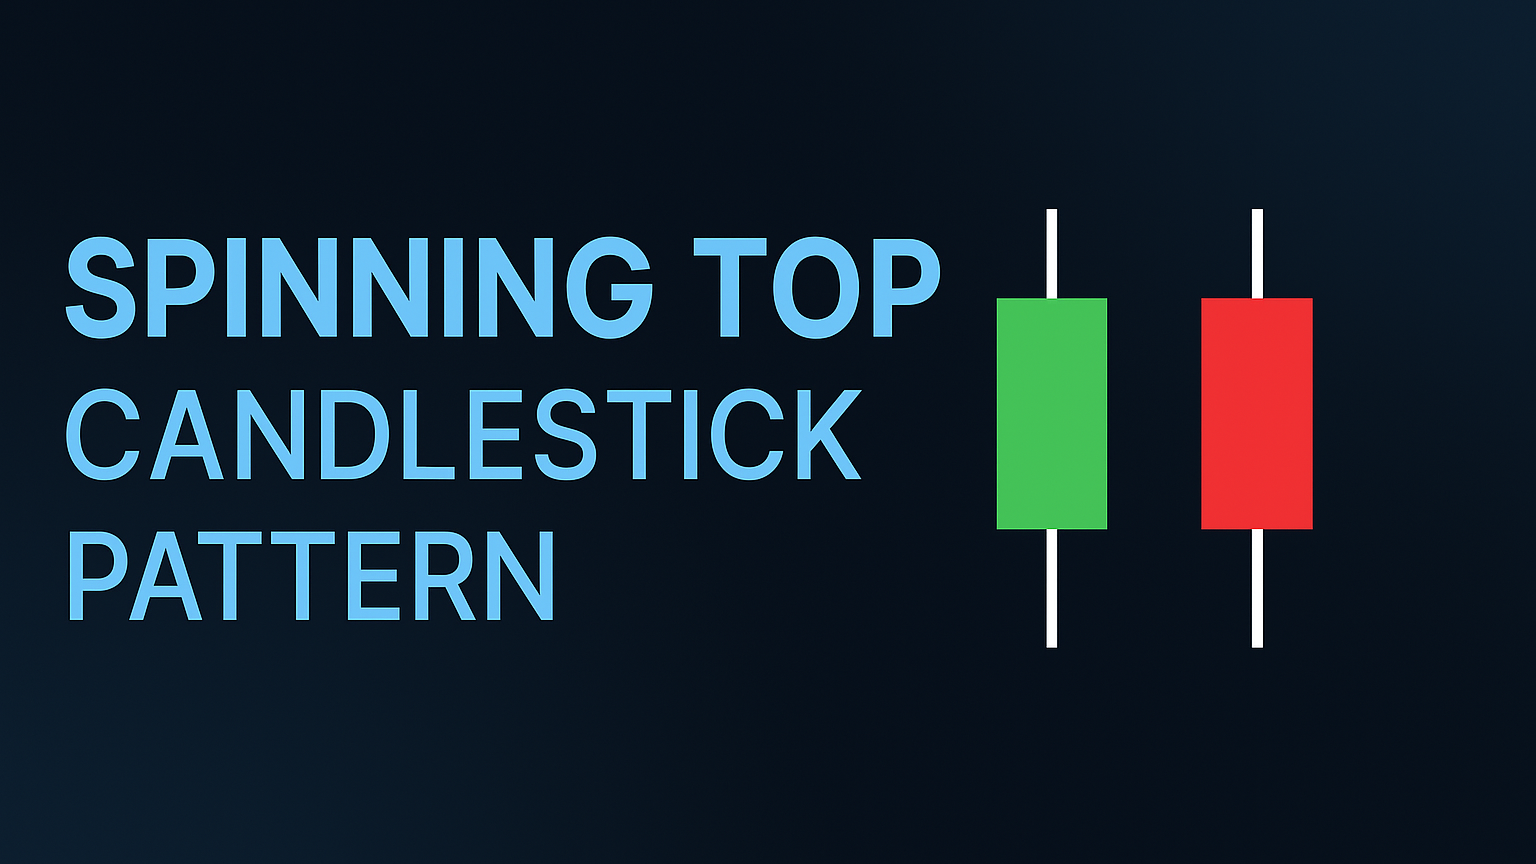
To confirm the signals from a Doji, use additional tools like RSI or MACD. If the candlestick's body is greater than 5% of its total range, it is categorized as a spinning top instead of a Doji.
2-Candle Patterns
Two-candle patterns provide more context by showing how price action evolves over consecutive sessions. Take the Bullish Engulfing pattern, for instance. This occurs during a downtrend when a small bearish candle is followed by a larger bullish one, signaling a potential reversal. Studies show this pattern has a 63% success rate for reversals.
On the flip side, the Bearish Engulfing pattern happens during an uptrend. A small bullish candle is overtaken by a larger bearish one, often forecasting downward movement with up to 79% accuracy.
3-Candle Patterns
Three-candle patterns often confirm trend reversals. For example, the Morning Star suggests a bullish reversal after a downtrend. To strengthen its reliability, look for volume increases and use technical indicators. Traders often set stop losses below the Morning Star's low and aim for profit targets near resistance levels.
Its bearish counterpart, the Evening Star, appears at the top of an uptrend. It hints at a potential reversal, but confirmation from subsequent price action is essential.
These patterns, when combined with other tools, can help traders better navigate market trends and make calculated decisions.
Advanced Candlestick Methods
Trend Analysis
Candlestick patterns are most effective when analyzed alongside market trends. Recognizing the current trend before acting on a pattern can significantly improve the accuracy of trading signals.
Here’s how you can incorporate trend analysis into candlestick trading:
| Aspect | Purpose | Application |
|---|---|---|
| Pattern Location | Confirms the trend | Check if the pattern forms at support or resistance levels |
| Volume Analysis | Validates signals | Ensure volume supports the candlestick pattern |
| Trend Direction | Provides context | Confirm the pattern aligns with the broader trend |
"Always analyse the current trend: a Japanese candlestick pattern means absolutely nothing if it is not related to the current trend." - CentralCharts
Once you’ve established the trend, adding technical indicators can help refine your trading decisions.
Indicator Combinations
Pairing candlestick patterns with technical indicators can validate signals and improve entry timing. Here are some of the most effective combinations:
- VWAP and Candlesticks: VWAP (Volume Weighted Average Price) highlights fair value and potential reversal points. For instance, a Doji near the VWAP after a strong trend could indicate a reversal.
- Moving Averages and Volume: Exponential Moving Averages (EMAs) help confirm trend direction, while volume bars strengthen the reliability of patterns, especially during reversals.
- Momentum Indicators: Tools like RSI (Relative Strength Index) and MACD (Moving Average Convergence Divergence) add another layer of confirmation. For example, a bullish candlestick pattern appearing with RSI in oversold territory increases the chances of a successful trade.
"Candlestick charts communicate so much that even if you don't have these other indicators, you're going to learn a lot just from the candlestick shapes." - Ross Cameron, Warrior Trading
Multiple Timeframe Analysis
To reduce false signals, examine charts across different timeframes. A great example is Bath and Body Works (BBWI) in late November 2023. A weekly 12-week SMA crossover, confirmed by a daily 10-day SMA and a 4-hour KST indicator, resulted in a 27% trade gain.
For a thorough analysis, focus on these three timeframes:
- Primary Timeframe: Weekly charts to identify the overall trend.
- Intermediate Timeframe: Daily charts to spot trading signals and confirm patterns.
- Short-term Timeframe: 4-hour or hourly charts for precise entry and exit points.
Trading with Candlestick Patterns
Mastering candlestick patterns goes beyond recognizing them – it’s about timing your trades and managing your risks effectively.
Entry and Exit Timing
Timing is everything when trading candlestick patterns. To make the most of these signals, combine them with broader market analysis and technical indicators.
| Pattern Type | Entry Signal | Exit Consideration |
|---|---|---|
| Bullish Reversal | Confirm with a follow-up candle after the pattern | Take profit near resistance levels |
| Bearish Reversal | Enter after confirming with volume | Exit once support levels are broken |
| Continuation | Follow the trend direction | Use recent highs or lows to adjust stops |
Risk management is just as important as timing your trades. Without it, even the best signals can lead to losses.
"Each candlestick is a simple, yet powerful tool to understand what's happening in the market" - Steve Nison
Risk Control Methods
Managing risk effectively is key to staying in the game. When trading with candlestick patterns, try these approaches:
- For bullish patterns, set your stop-loss just below the lowest shadow of the pattern. Adjust your position size to align with your risk tolerance.
- For bearish patterns, place stop-losses above the highest shadow. Keep an eye on volume for confirmation and adjust your position size based on market volatility.
"The game of speculation is the most uniformly fascinating game in the world. But it is not a game for the stupid, the mentally lazy, the person of inferior emotional balance, or the get-rich-quick adventurer." - Jesse Livermore
Building a Candlestick Trading Plan
Create a candlestick trading plan by focusing on consistent pattern recognition and disciplined execution.
Trading Rules and System
To trade effectively using candlestick patterns, you need a clear and structured system. This involves defining rules to identify patterns and act on trading opportunities.
| Component | Implementation | Validation Method |
|---|---|---|
| Pattern Selection | Focus on a few high-probability candlestick patterns | Analyze historical success rates |
| Market Context | Combine signals with support and resistance levels | Look for technical confluence |
| Risk Parameters | Set position sizes and stop-loss levels | Assess risk-reward ratios |
| Confirmation Signals | Use volume and other technical indicators | Perform multiple timeframe analysis |
For instance, back in December 2014, a bullish engulfing pattern in the February 2015 gold contract led to a $100 rally. The low of the candle's shadow remained intact throughout the move.
Trading Psychology
Having rules is important, but managing emotions is just as critical. Emotional control helps mitigate risks and ensures disciplined trading. To keep emotions in check:
- Set Risk Limits: Decide the maximum loss you're willing to accept per trade.
- Stick to Your Rules: Follow your entry and exit criteria without deviation.
- Avoid Overtrading: Be patient and wait for setups that meet all your criteria.
- Track Your Trades: Maintain a trading journal to analyze and refine your approach.
Testing and Refinement
Before committing real money, thoroughly test your candlestick strategy. For example, in 2015, crude oil futures showed a spinning top pattern paired with RSI readings, signaling an exit point that could yield about $10 per contract.
Testing involves two key steps:
-
Define and Validate Parameters
Clearly outline your pattern criteria, integrate technical indicators, and document your entry/exit rules. Use historical data to evaluate returns and risk-reward ratios across different market conditions. -
Forward Test
After backtesting, try paper trading your strategy in live market conditions. This helps uncover any practical issues with execution.
Summary
Japanese candlestick analysis plays a key role in technical trading, offering insights into market psychology through visual patterns. These patterns help traders evaluate market conditions and make decisions based on well-known formations.
To trade effectively using candlesticks, it's essential to combine pattern recognition with other technical tools. Here's a quick breakdown of the core elements:
| Component | Purpose | Application |
|---|---|---|
| Pattern Recognition | Understand trends | Spot potential reversals or continuations |
| Technical Integration | Confirm signals | Pair with indicators, trend lines, and volume |
| Risk Management | Control risk | Set stop-loss levels using patterns |
| Market Context | Analyze conditions | Factor in market environment and timeframes |
Traders today continue to use these patterns, tailoring them to modern tools and trading platforms. While candlestick patterns are not foolproof, they offer probability-based insights that guide decision-making. Stay disciplined and keep improving your ability to recognize patterns for better results.