Learn how to effectively use MACD divergence on TradingView to spot trend reversals and enhance your trading strategies.
MACD divergence is a powerful method for spotting trend reversals in trading. This article explains how to use TradingView to identify bullish and bearish divergences, set up custom screeners, and enhance your analysis with advanced backtesting integrations. Here's what you'll learn:
-
What is MACD Divergence?
- Bullish: Prices hit lower lows, MACD forms higher lows.
- Bearish: Prices hit higher highs, MACD shows lower highs.
-
Why TradingView?
- Advanced charting , built-in screeners, and community tools make it easier to analyze MACD divergence.
-
How to Set Up MACD
- Add the MACD indicator, adjust settings (e.g., Fast: 12, Slow: 26, Signal: 9), and customize visuals for clarity.
-
Common Mistakes
- Avoid ignoring larger trends, mixing timeframes, or relying on MACD alone – confirm signals with RSI or volume.
-
Creating Custom Screeners
- Use TradingView's screener to filter assets for divergence patterns, add volume and trend filters, and fine-tune parameters.
-
Integrating MACD with Backtesting Toolkits
- Learn how to incorporate MACD divergence analysis into backtesting setups to find the most effective strategy parameters.
Quick Tip: Pair MACD divergence with RSI and volume to improve signal reliability by up to 20%.
Read on for step-by-step instructions, risk management tips, and advanced tools to refine your trading strategy.
Setting Up the MACD Indicator on TradingView
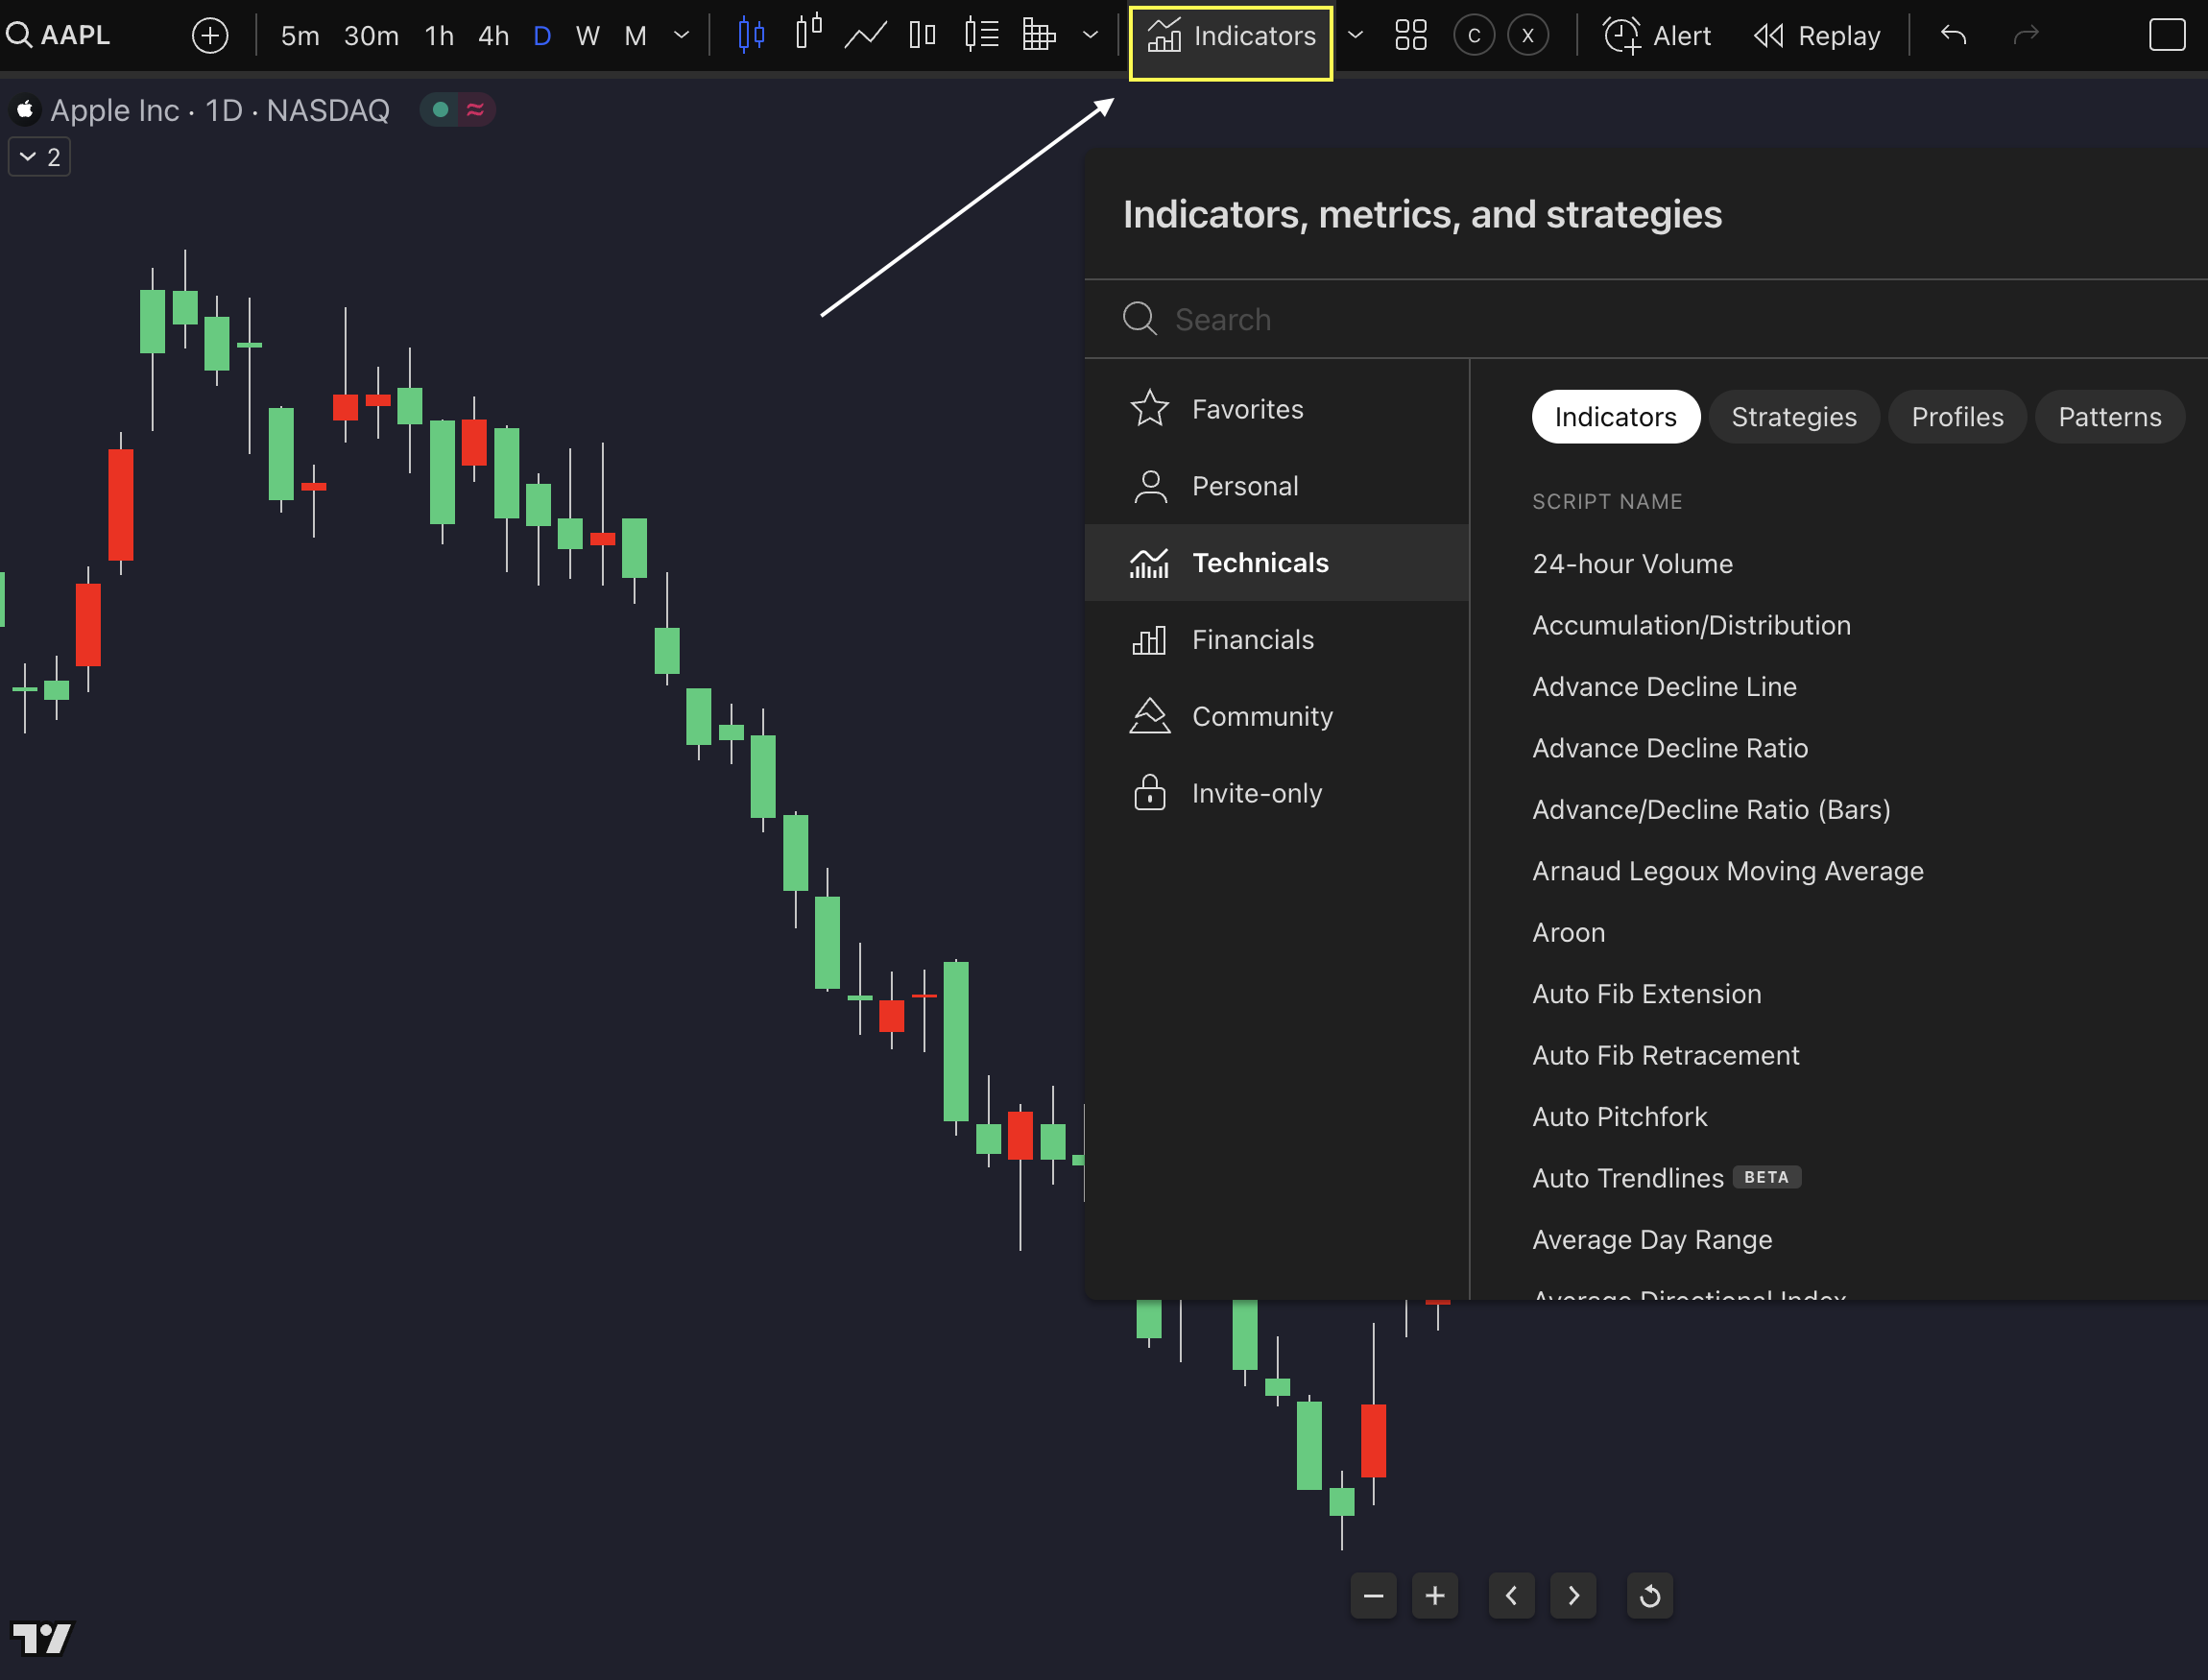
Adding the MACD Indicator
To add the MACD indicator to your TradingView chart, follow these steps:
- Click the 'Indicators' button or press
/on your keyboard. - In the search bar, type 'MACD'.
- Select and add 'Moving Average Convergence Divergence'.
Once added, position the MACD panel directly below your price chart. This setup makes it easier to compare the indicator with price movements visually [1].
Adjusting MACD Settings
The default settings work well for many trading strategies:
| Parameter | Default Value |
|---|---|
| Fast Length | 12 periods |
| Slow Length | 26 periods |
| Signal Line | 9 periods |
| Source | Close price |
To tweak these settings, click on the MACD indicator name on your chart and choose "Settings." Under the "Inputs" tab, you can adjust the values to fit your trading style. For example:
- Shorter periods (like 8, 17, 9) make the indicator respond faster to price changes.
- Longer periods provide smoother signals, reducing the chance of false alerts.
In the 'Style' tab, you can customize the appearance for better readability:
- Use distinct colors for the MACD and signal lines to tell them apart easily.
- Set the histogram opacity to around 50% to minimize distractions.
- Increase the line thickness for better visibility, especially on smaller timeframes [2] [3].
With your MACD now set up, you're ready to dive into identifying divergence patterns. The next section will cover key patterns and common mistakes to watch out for.
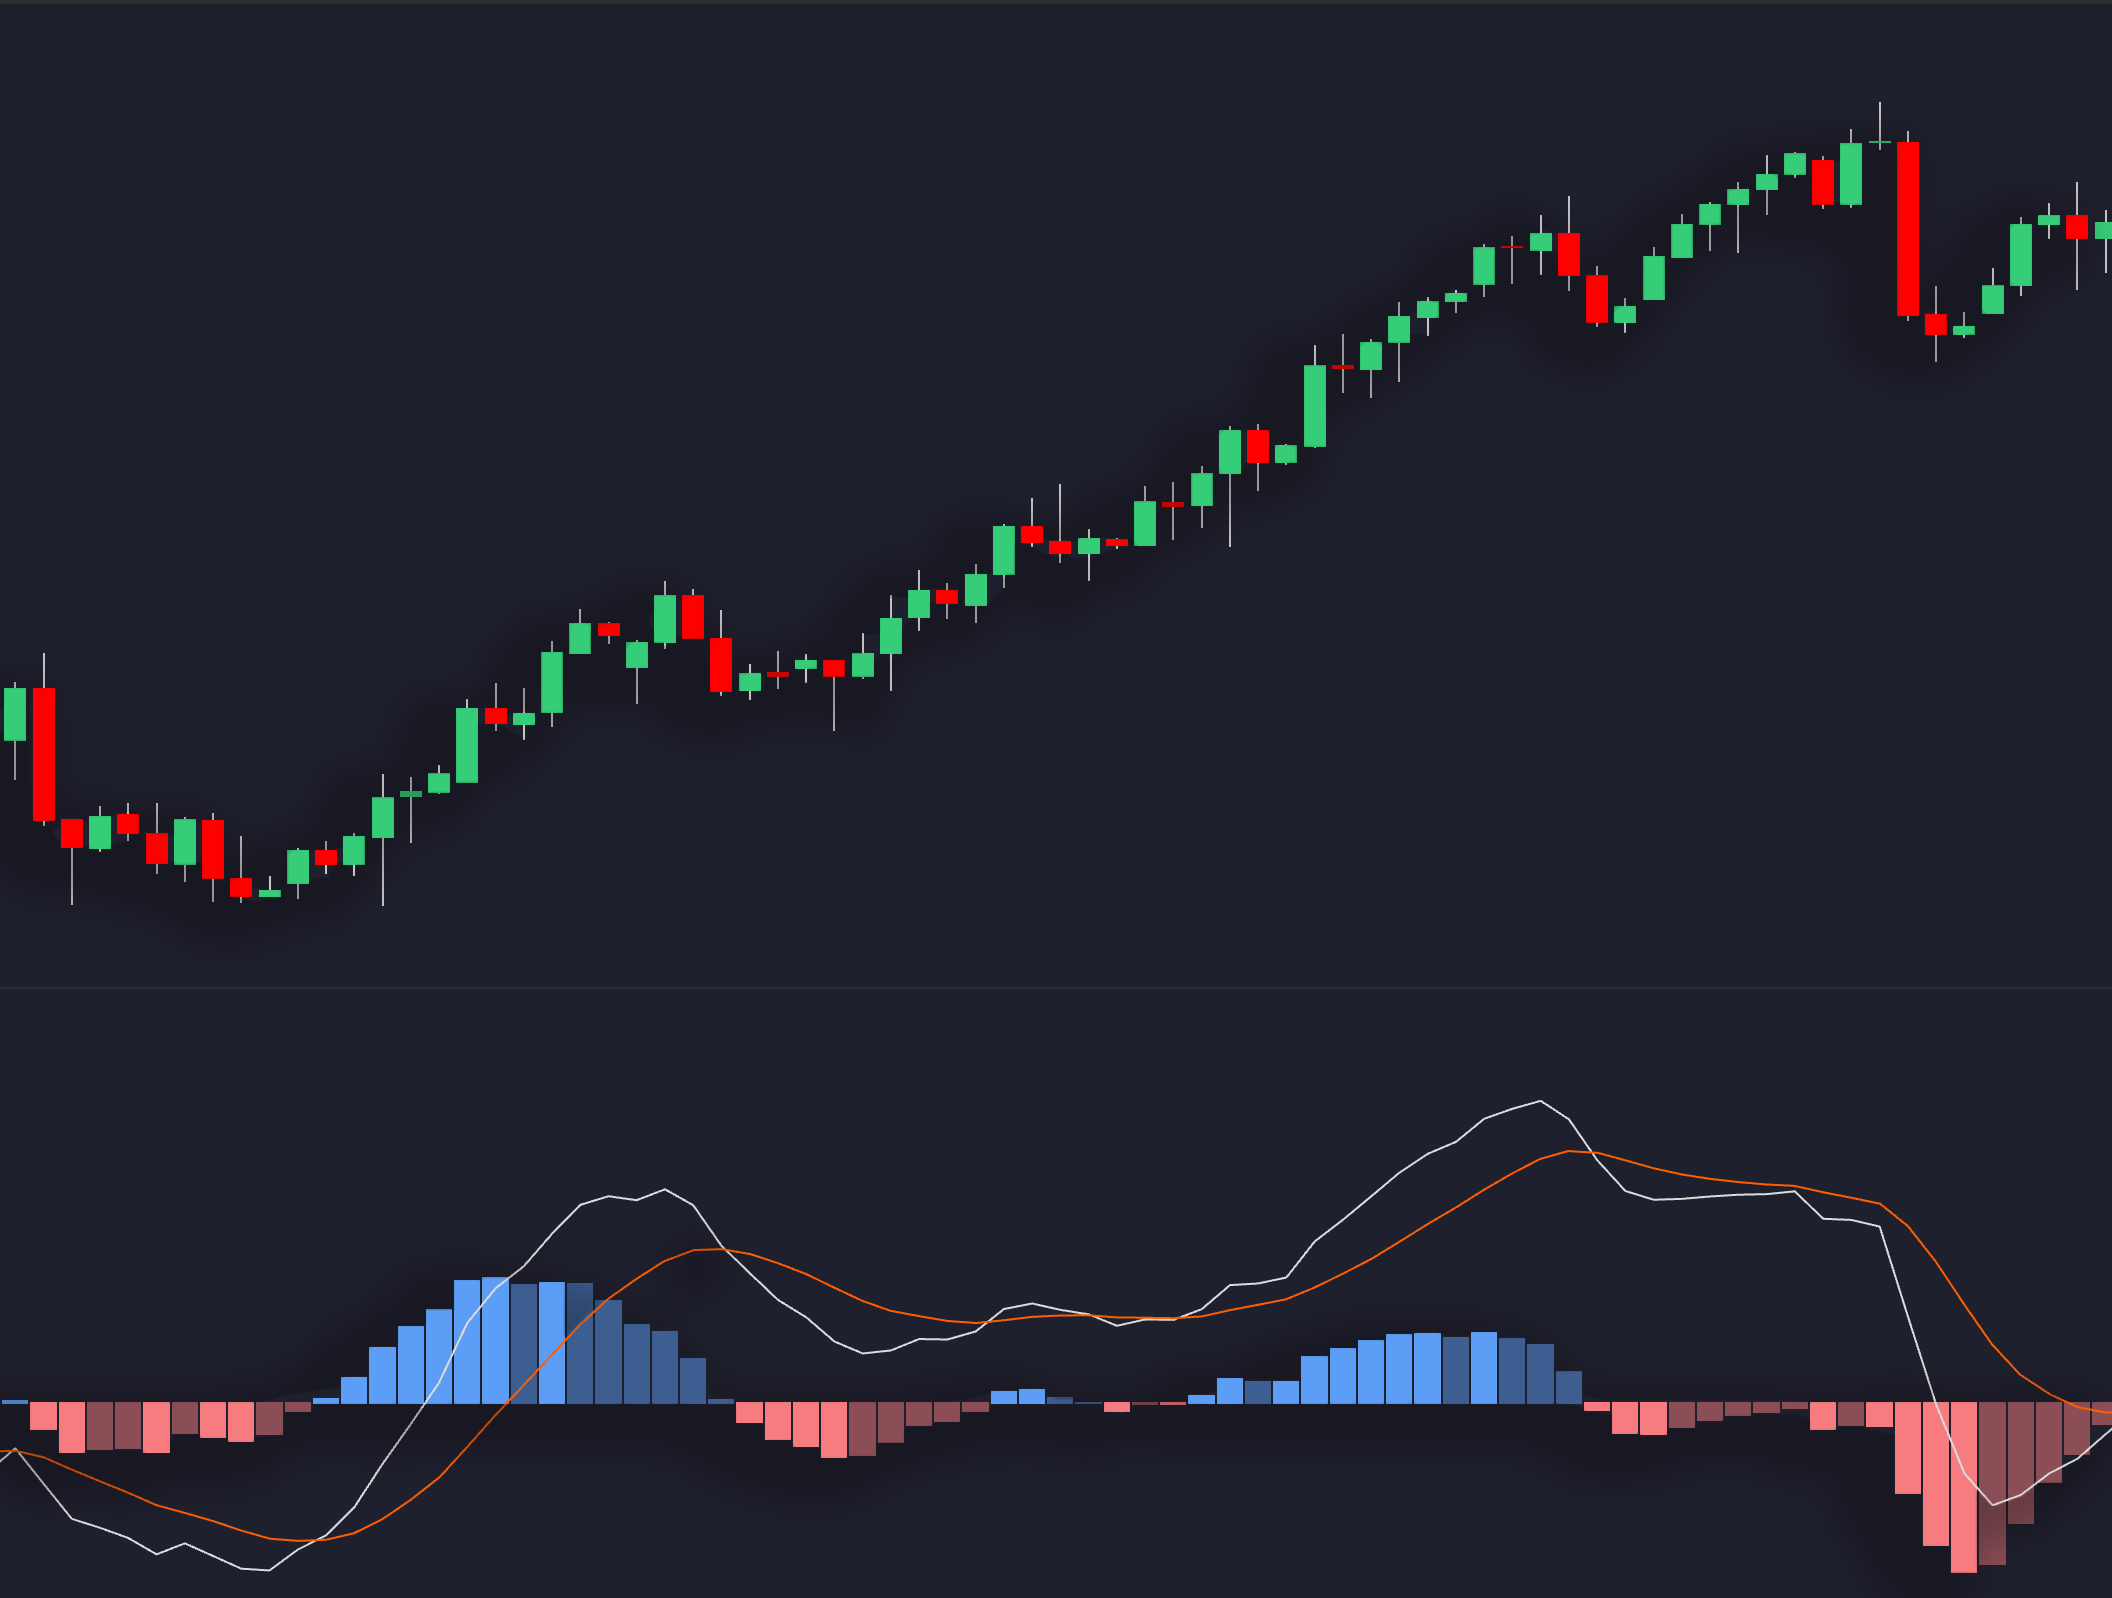
Identifying MACD Divergence Patterns
Spotting Bullish and Bearish Divergences
Once your MACD is set up as described earlier, TradingView's chart tools become your go-to for identifying divergence patterns. The trendline tool (shortcut 'T') is especially handy for this process. Here's how to use it effectively:
- Draw trendlines connecting the highs or lows of price swings.
- Replicate these trendlines on the MACD panel for comparison.
- Check if the slopes of the price trendlines differ from those on the MACD.
- Use the horizontal line tool (H) to mark potential reversal zones for added clarity.
Common Mistakes in Divergence Analysis
To sharpen your skills in spotting divergences, it’s crucial to avoid these frequent errors:
1. Ignoring the Bigger Picture
Always factor in the overall market trend. Divergences on daily or weekly charts carry more weight than those on smaller timeframes. Use TradingView's timeframe comparison tool (ALT+2) to assess the significance of signals.
2. Mixing Up Timeframes
TradingView’s multi-chart layout allows you to analyze multiple timeframes side by side. This approach helps confirm signals across different periods and reduces the chances of misinterpreting false positives.
3. Falling for False Signals
Don’t rely solely on MACD. Cross-check with other indicators like RSI or volume. TradingView’s volume overlay (CTRL+SHIFT+V) can provide an extra layer of confirmation.
4. Acting Too Early
Wait for candlestick closes beyond key levels before taking action. Use TradingView’s horizontal line tool (H) to mark these levels and avoid jumping in prematurely.
These steps will help you refine your divergence analysis and lay the groundwork for building automated screeners in the next section.
Creating a MACD Divergence Screener on TradingView
Using TradingView's Screener
To get started, open TradingView's screener from the main navigation menu. Choose your preferred asset class – whether it's stocks, crypto, or forex. Then, under the 'Indicators' section, add MACD filters. Use the advanced filtering tools here to pinpoint divergence patterns effectively.
Once you've selected your asset class, focus on crafting detailed divergence filters that suit your specific needs.
Setting Up Divergence Filters
Set up filters that compare price highs or lows with MACD movements. For bullish divergences, configure the screener to identify situations where the MACD shows higher lows while the price action reveals lower lows. For bearish divergences, reverse these conditions – MACD should display lower highs while the price forms higher highs.
Timeframe Alignment
Make sure the screener's timeframe matches your trading style. For swing trading, use a daily timeframe. For day trading, a 4-hour chart would be more appropriate.
Fine-Tuning Screener Settings
Enhance your screener's accuracy by layering additional confirmation methods:
- Volume Confirmation: Apply a volume filter to ensure meaningful market activity during divergence setups. For example, you can set a minimum volume threshold of 1.5 times the 20-period average volume. This helps you focus on trades with strong participation.
- Trend Context: Add trend filters using moving averages. For bullish divergences, consider requiring the 50-period EMA to be above the 200-period EMA to confirm an overall upward trend.
Signal Strength Parameters
Fine-tune the screener with these specific parameters:
| Parameter | Value | Purpose |
|---|---|---|
| Minimum Price Move | 2% | Excludes small, insignificant moves |
| MACD Line Difference | 0.1 | Highlights meaningful divergences |
| Lookback Period | 14 bars | Ensures relevant historical data |
Integrating MACD Analysis with Backtesting Toolkits
Although there isn’t a dedicated MACD screen in the available toolkits, you can integrate MACD divergence analysis into your backtesting setup. By combining MACD signals with backtesting capabilities, you can evaluate and optimize your trading strategies effectively.
This integration allows you to test different MACD settings and trading parameters to determine what works best for your strategy.
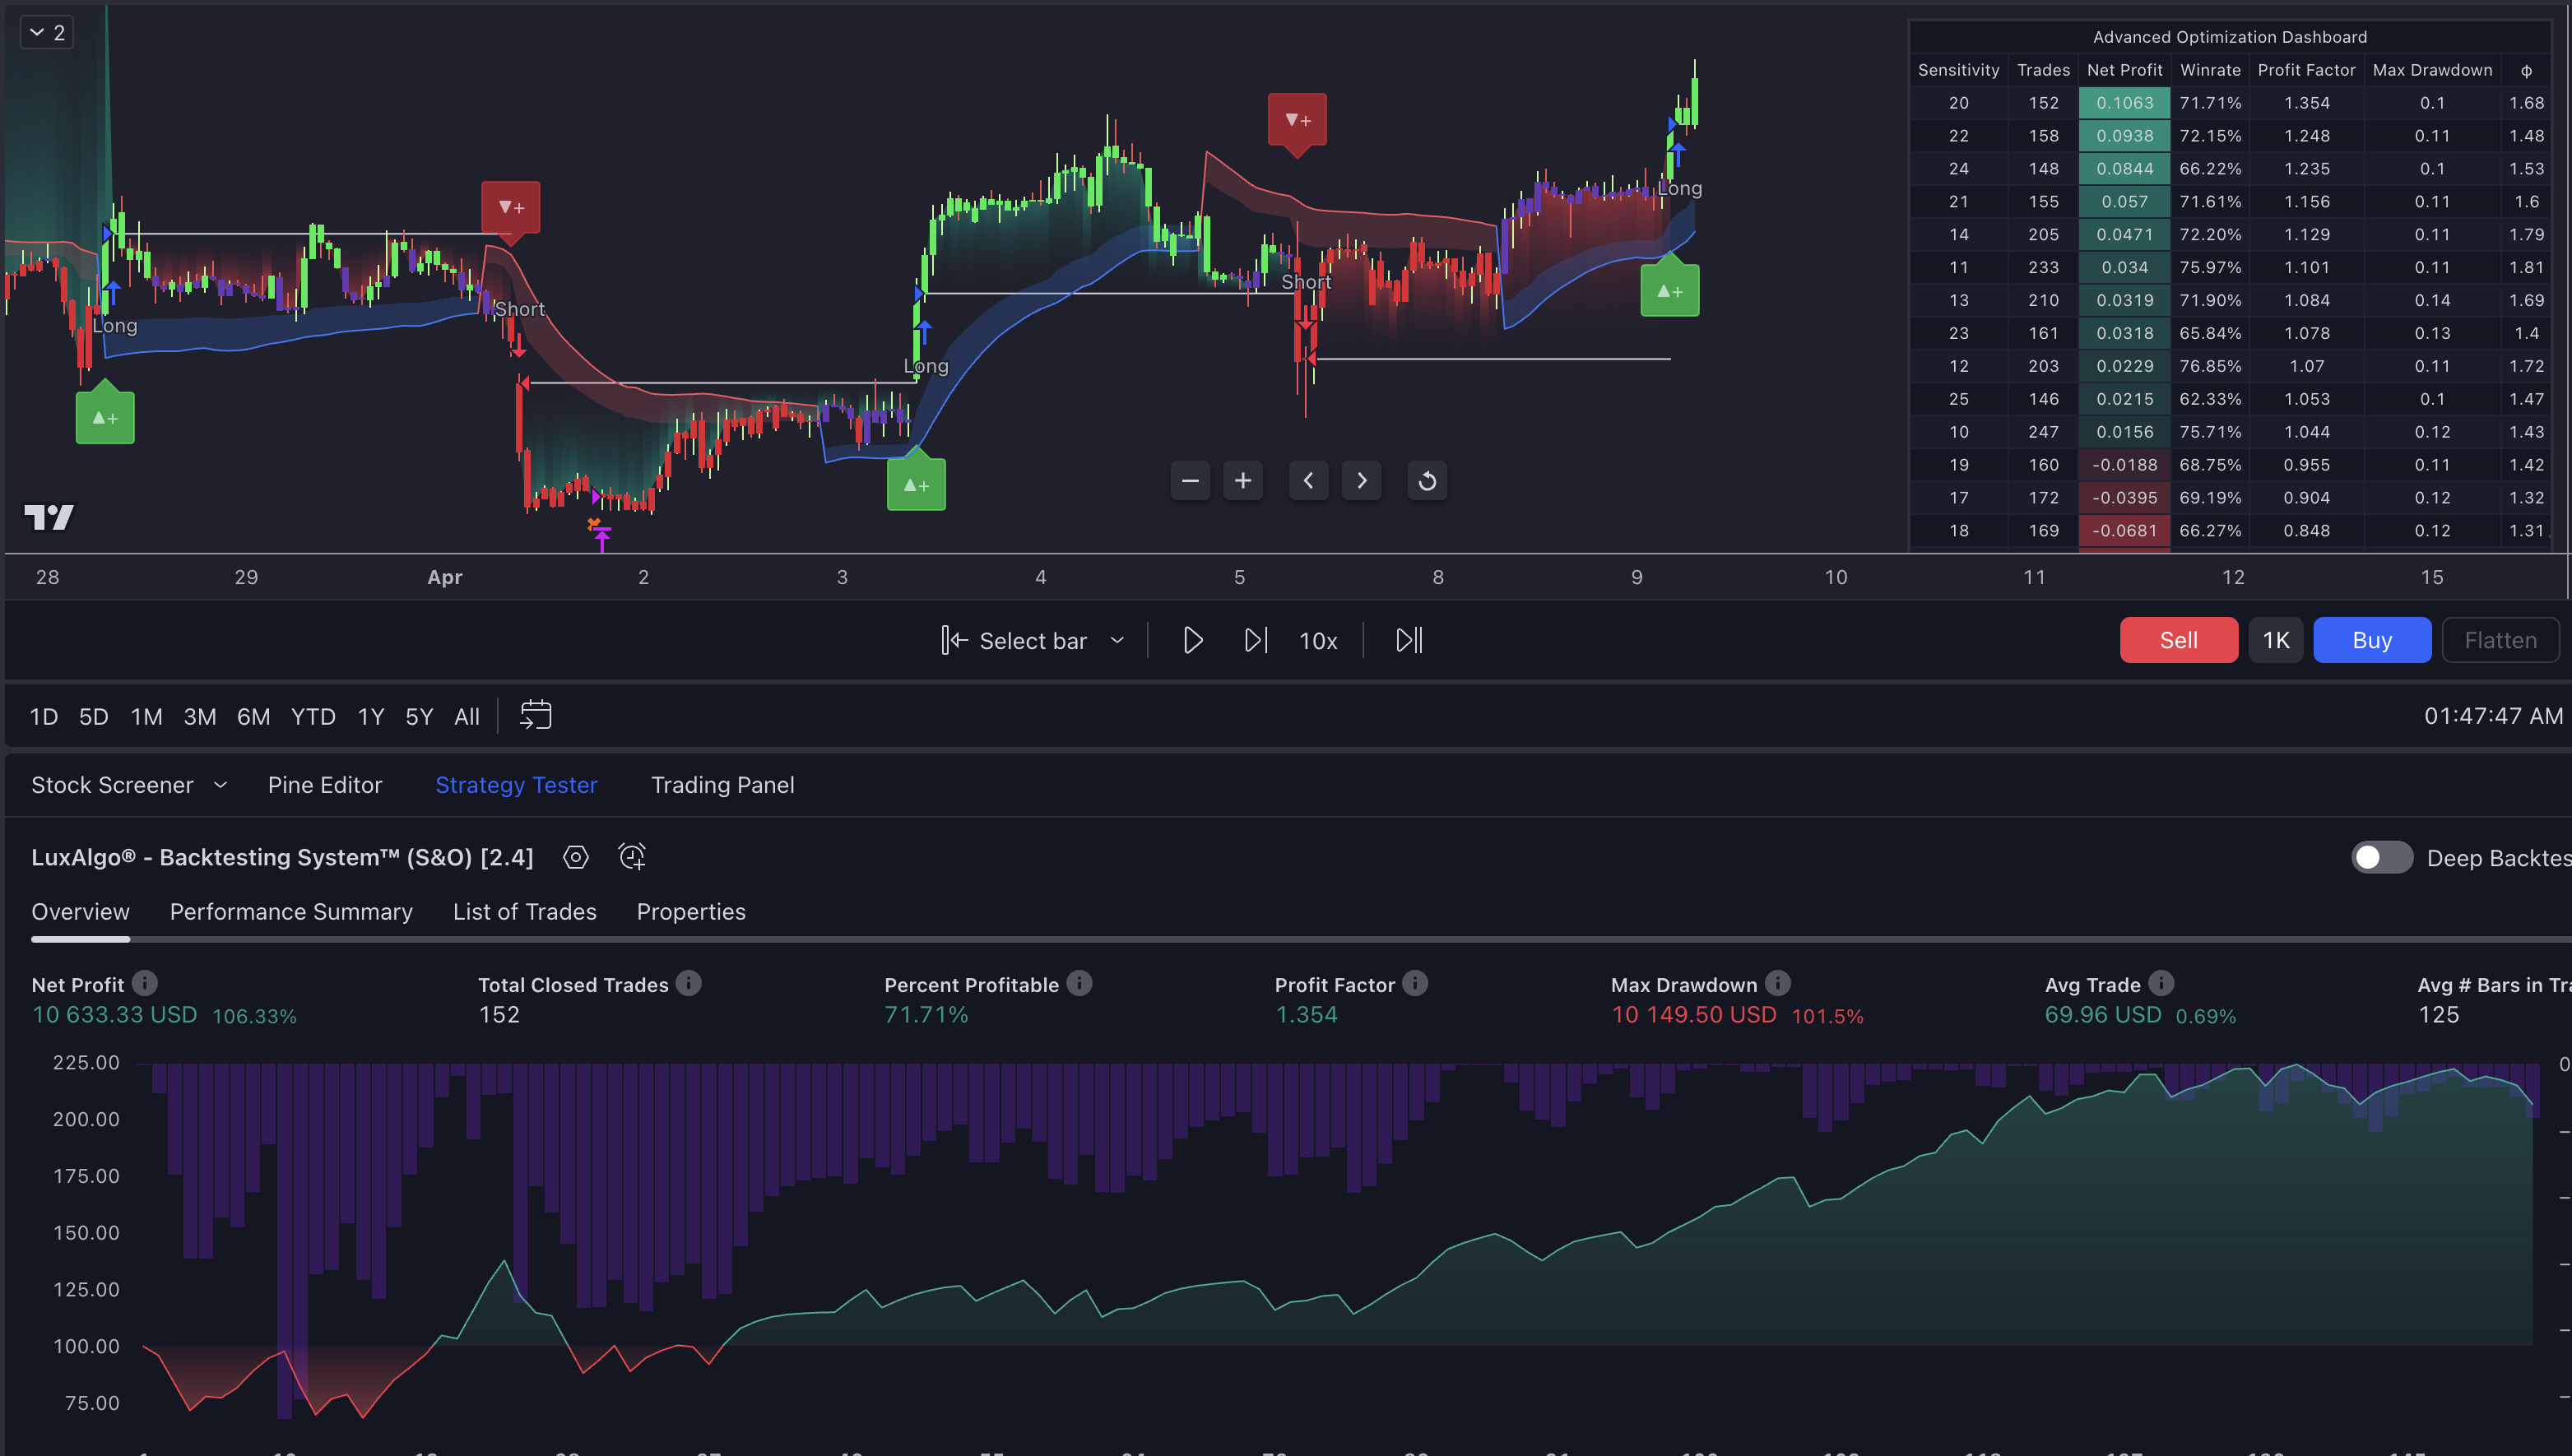
Below is an overview of the backtester tool:
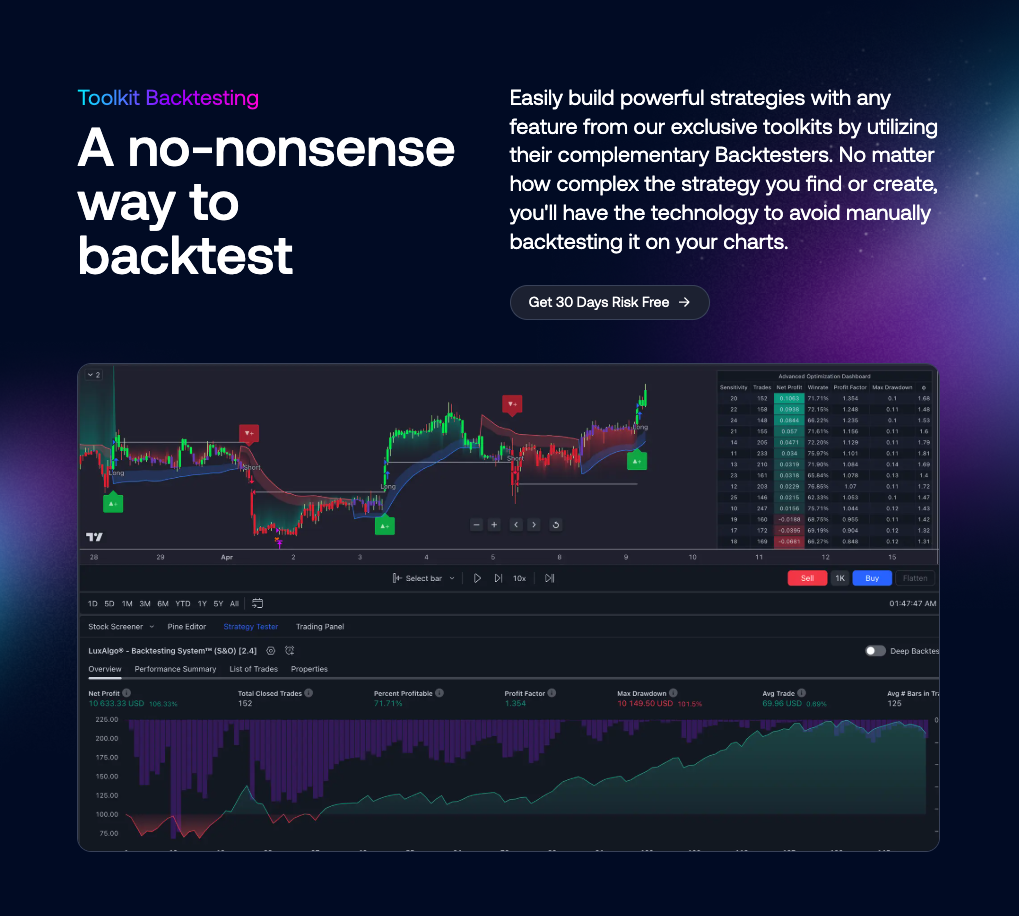
Additionally, review the performance of your strategy with detailed equity curve analysis:
Applying MACD Divergence in Trading
Combining MACD Divergence with Other Indicators
Pairing MACD divergence with additional tools can improve your trading decisions. Some of the most commonly used indicators include:
| Indicator | Purpose |
|---|---|
| RSI | Confirms oversold or overbought levels |
| Moving Averages | Helps identify the trend direction |
| Volume Analysis | Checks the strength of a signal |
| Bollinger Bands | Highlights levels of market volatility |
These tools work well with TradingView's built-in features, while the integrated backtesting approach simplifies the process of analyzing multiple indicators together.
Using Divergence for Entry and Exit
When planning entry points, focus on strong confirmation signals instead of aiming for the perfect top or bottom. Look for MACD line crosses combined with candlestick patterns at critical price levels. TradingView’s multi-chart setups can help you spot these opportunities.
Managing Risk with MACD Divergence
Effective risk management is key to using MACD divergence successfully. Here are some strategies to consider:
- Position Sizing: Use an ATR-based method to calculate position size, keeping your account's risk tolerance in mind.
-
Stop-Loss Placement: Place stop-loss orders based on market structure.
For example:
- Below recent swing lows for bullish divergence trades.
- Above recent swing highs for bearish divergence trades.
- 1-2 ATR away from the entry point to account for volatility.
-
Profit Taking:
- Take partial profits when you reach a 1:1 risk-to-reward ratio.
- Adjust stops to breakeven.
- Use a trailing stop for the remaining position to lock in gains.
Conclusion and Key Points
Using MACD divergence screening on TradingView helps traders identify potential trend reversals more effectively when paired with robust charting tools and disciplined risk management practices. By following the strategies discussed, you can apply MACD divergence analysis in a structured way.
Here are some key steps for implementing MACD divergence trading:
- Validate signals with multi-timeframe analysis (see Section 3).
- Use ATR-based position sizing and set stop-loss levels (refer to Section 6).
- Adjust MACD settings based on the asset class, aligning with the screener setup parameters in Section 4.
- Focus on divergences in trending markets (explained in Section 3).
The combination of TradingView's capabilities and disciplined risk management is crucial. Success lies in leveraging these indicators while adhering to clear risk parameters [1].


