Learn how to effectively backtest chart patterns manually, enhancing your trading strategies with detailed analysis and practical steps.
Manual backtesting helps traders test strategies by analyzing historical price charts for patterns. It offers deeper insights into market behavior compared to automated systems. Here’s why it’s useful and how to get started:
- What You Need: Tools like TradingView, Excel, and indicators (e.g., RSI, moving averages).
- Steps: Select historical data, identify patterns, simulate trades, and document results.
- Benefits: Improves pattern recognition, refines strategies, and provides performance data.
- Tips: Avoid hindsight bias, test at least 30 patterns, and factor in market conditions.
Quick Comparison: Manual vs Automated Backtesting
| Factor | Manual | Automated |
|---|---|---|
| Speed | 20-30 hours for 100 trades | 1-2 hours for 10,000 trades |
| Pattern Recognition | Great for complex patterns | Best for defined patterns |
| Market Context | Strong awareness | Limited to programmed rules |
| Sample Size | 50-100 trades per day | Thousands per hour |
Manual backtesting builds trading skills and strategy confidence, especially when paired with automation for efficiency.
Chart Patterns Trading and Backtesting
Required Tools and Setup
Getting your workspace set up properly is key to effectively backtesting chart patterns manually. A well-organized setup ensures consistency and precision throughout the testing process.
Basic Equipment List
Here’s what you’ll need to get started:
| Tool Category | Essential Components | Purpose |
|---|---|---|
| Charting Platform | TradingView Pro | Access to historical data, drawing tools, and multiple timeframes |
| Data Management | Excel or Google Sheets | Logging trades, tracking performance, and analyzing stats |
| Pattern Analysis | LuxAlgo Price Action Concepts Toolkit | Helps detect patterns, which can be manually verified |
| Documentation | Note-taking app | For recording observations and insights |
Chart Setup Guide
Once your tools are ready, follow these steps to configure your charts:
1. Timeframe Configuration
- For swing trading: Use the Daily chart as your main view, 4-hour charts for entry points, and Weekly charts for overall trend context.
2. Essential Indicators
Keep your charts uncluttered by using only the most important indicators:
- Standard volume indicator
- 20 and 50-period moving averages to identify trends
- RSI for momentum checks
- Volume profile to pinpoint key support and resistance zones
3. Visual Settings
Adjust your chart visuals for better clarity:
- Use contrasting colors for price bars or candlesticks.
- Turn on grid lines for better alignment.
- Enable price labels to clearly mark levels.
Pattern Rules and Filters
To ensure consistency in your analysis, stick to these criteria for chart patterns:
| Pattern Element | Specific Criteria | Validation Rule |
|---|---|---|
| Pattern Size | At least a 5% price range | Required for the pattern to be valid |
| Formation Time | Between 5 and 20 candles | Disregard patterns outside this range |
| Volume Profile | 20% above average volume | Necessary to confirm the pattern |
| Support/Resistance | Interaction with clear levels | Patterns must align with key support/resistance zones |
If you’re using automated systems, make sure they’re set to match these criteria for better alignment with your manual analysis.
Manual Backtesting Steps
Once you've set up your tools and defined your pattern criteria, it's time to dive into the backtesting process. Here's how to tackle it step by step.
Time Period Selection
Picking the right historical period is key to getting meaningful results. Keep these points in mind:
- Include both bullish and bearish market phases.
- Cover periods with varying levels of volatility - both high and low.
- Aim to test 30-50 pattern instances under different conditions for reliable data [1][6].
- Use recent data (3-5 years) to reflect current market trends.
- Match the timeframe to your trading style (e.g., daily for swing trading, hourly for day trading).
This careful selection ensures your analysis is grounded in relevant and diverse market scenarios.
Price Action Review
Once you've locked in your historical period, follow these three steps to analyze price action effectively:
1. Pattern Identification
Go through each candle, one at a time, starting from your chosen date. Identify patterns as they develop - don’t cheat by looking at the outcome. Stick to your predefined criteria and visually confirm each pattern.
2. Market Context Analysis
Document details like trend direction, volume changes, and key support/resistance levels. This helps you understand the broader market environment.
3. Trade Simulation
When a pattern matches your criteria, simulate a trade by:
- Entering at the next available price after the pattern is complete.
- Applying the risk parameters you've set in your Pattern Rules and Filters.
Trade Documentation
Keep detailed records of every simulated trade in a structured format like this:
| Field | Example | Notes |
|---|---|---|
| Date & Time | 2024-12-15 14:30 | |
| Pattern Type | Bull Flag | |
| Entry Price | $50.10 | |
| Stop-Loss | $49.00 | |
| Target(s) | $52.00, $53.50 | |
| Position Size | $10,000 | Aligned with your risk management rules |
| Outcome | +2.7% | |
| Market Context | Uptrend, Above 50 MA |
For each trade, track these key metrics:
- Risk-to-reward ratio
- Holding period
- Maximum adverse excursion (worst drawdown during the trade)
- Maximum favorable excursion (highest profit during the trade)
This level of documentation ensures you can accurately evaluate performance during the analysis phase.
Results Analysis
Once you’ve gathered your backtesting data, analyzing it carefully is the key to drawing useful insights. Here’s how to break it down step by step.
Performance Metrics
Start by reviewing essential metrics from your recorded trade data:
| Metric | Description |
|---|---|
| Win Rate | Percentage of trades that were profitable |
| Profit Factor | Total profits divided by total losses |
| Risk-Reward Ratio | Average profit compared to average loss |
| Maximum Drawdown | Largest drop from a peak to a trough |
| Consistency Score | Percentage of months with profits |
Make sure to evaluate these metrics for each pattern type you tested. For instance, bull flag patterns might show very different results compared to head and shoulders patterns.
Market Condition Impact
Market conditions can heavily influence how patterns perform. Split your analysis into categories like:
Trending Markets
- Assess how quickly patterns complete and whether volume confirms the moves.
- Check if the win rate remains steady.
- Study the volume behavior during pattern formation and completion.
Ranging Markets
- Look at how often breakouts fail and whether targets are reliable.
- Measure the rate at which price hits targets.
- Compare these results to those from trending markets.
This breakdown helps you figure out which patterns thrive in specific conditions. For instance, traditional chart patterns often perform better in trending markets than in sideways or choppy ones.
Common Backtesting Errors
As you wrap up your analysis, double-check your process for these frequent mistakes:
Risk Management Oversights
Always include proper position sizing and stop-loss levels in your tests. Skipping this step can lead to unrealistic results that won’t hold up in live trading.
Other issues to avoid:
- Using future data in your analysis.
- Testing fewer than 30 instances of a pattern.
- Leaving out trading costs like commissions or slippage.
- Ignoring position sizing rules in your calculations.
Manual vs Automated Testing
Method Comparison
Manual and automated backtesting each bring unique strengths to analyzing chart patterns. Manual testing helps traders gain a deeper understanding of how patterns behave and how they fit within the broader market context. On the other hand, automated systems excel at handling large datasets with speed and consistency. Because of this, many traders opt for a mix of both methods.
| Factor | Manual | Automated |
|---|---|---|
| Speed | 20-30 hours for 100 trades | 1-2 hours for 10,000 trades |
| Pattern Recognition | Great for complex patterns | Best for defined patterns |
| Market Context | Strong awareness | Limited to programmed rules |
| Sample Size | Around 50-100 trades per day | Thousands per hour |
| Accuracy | Higher for complex patterns | 99%+, but may include false positives |
Here’s an example to illustrate the difference: In 2022, a study on quantitative trading revealed that manual backtesting of 100 S&P 500 trades over six months achieved a 62% win rate. Meanwhile, automated testing of 10,000 trades showed a 58% win rate. The manual method’s higher success was linked to better interpretation of market conditions, something automated systems couldn't fully replicate [3].
Tool Integration Tips
Using both manual and automated methods together can optimize your workflow. Here’s how:
- Pattern Identification: Use automated systems to detect potential setups, then manually verify them for accuracy.
- Data Management: Let automation handle data collection and performance calculations, freeing you to focus on assessing pattern quality. This cuts down analysis time while keeping results reliable.
Even when relying on automation, manual oversight is crucial:
- Validation Process: Follow these steps for a hybrid approach:
- Check pattern quality and market context.
- Align setups with current market conditions.
- Confirm volume levels.
- Evaluate support and resistance areas.
For instance, during the 2008 financial crisis, manual traders outperformed automated systems by 20% [7]. When analyzing complex patterns like Head and Shoulders formations, manual backtesting achieved 12% better entry accuracy compared to automated methods [5]. However, automated systems can identify three times more potential setups. By combining the rigor of manual verification with the scalability of automation, traders can maximize both accuracy and efficiency.
Conclusion
Manual backtesting provides a dependable way to validate trading strategies when done in a structured manner. By carefully analyzing historical patterns, focusing on accuracy, and considering market context, traders can refine their strategies and approach live markets with greater confidence. This process builds on the detailed steps covered earlier.
Best Practices
Following a consistent approach is key to achieving trustworthy results in manual backtesting. Here are some essential practices to keep in mind:
Documentation and Analysis
- Keep detailed, standardized records of each trade.
- Monitor both numerical data and qualitative insights to gain a full understanding.
Psychological Preparation
- Set realistic expectations based on historical outcomes.
- Avoid hindsight bias by concealing future price movements during analysis.
- Take regular breaks to stay focused and prevent mental fatigue [2][4].
Strategy Refinement
- Whenever possible, compare manual results with automated backtesting systems[3].
- Continuously evaluate and adjust your process based on new findings.
Manual backtesting can uncover subtle market details that automated systems often miss [3]. By adhering to a disciplined approach and applying these best practices, traders can create strategies that are better suited for real-world trading scenarios.
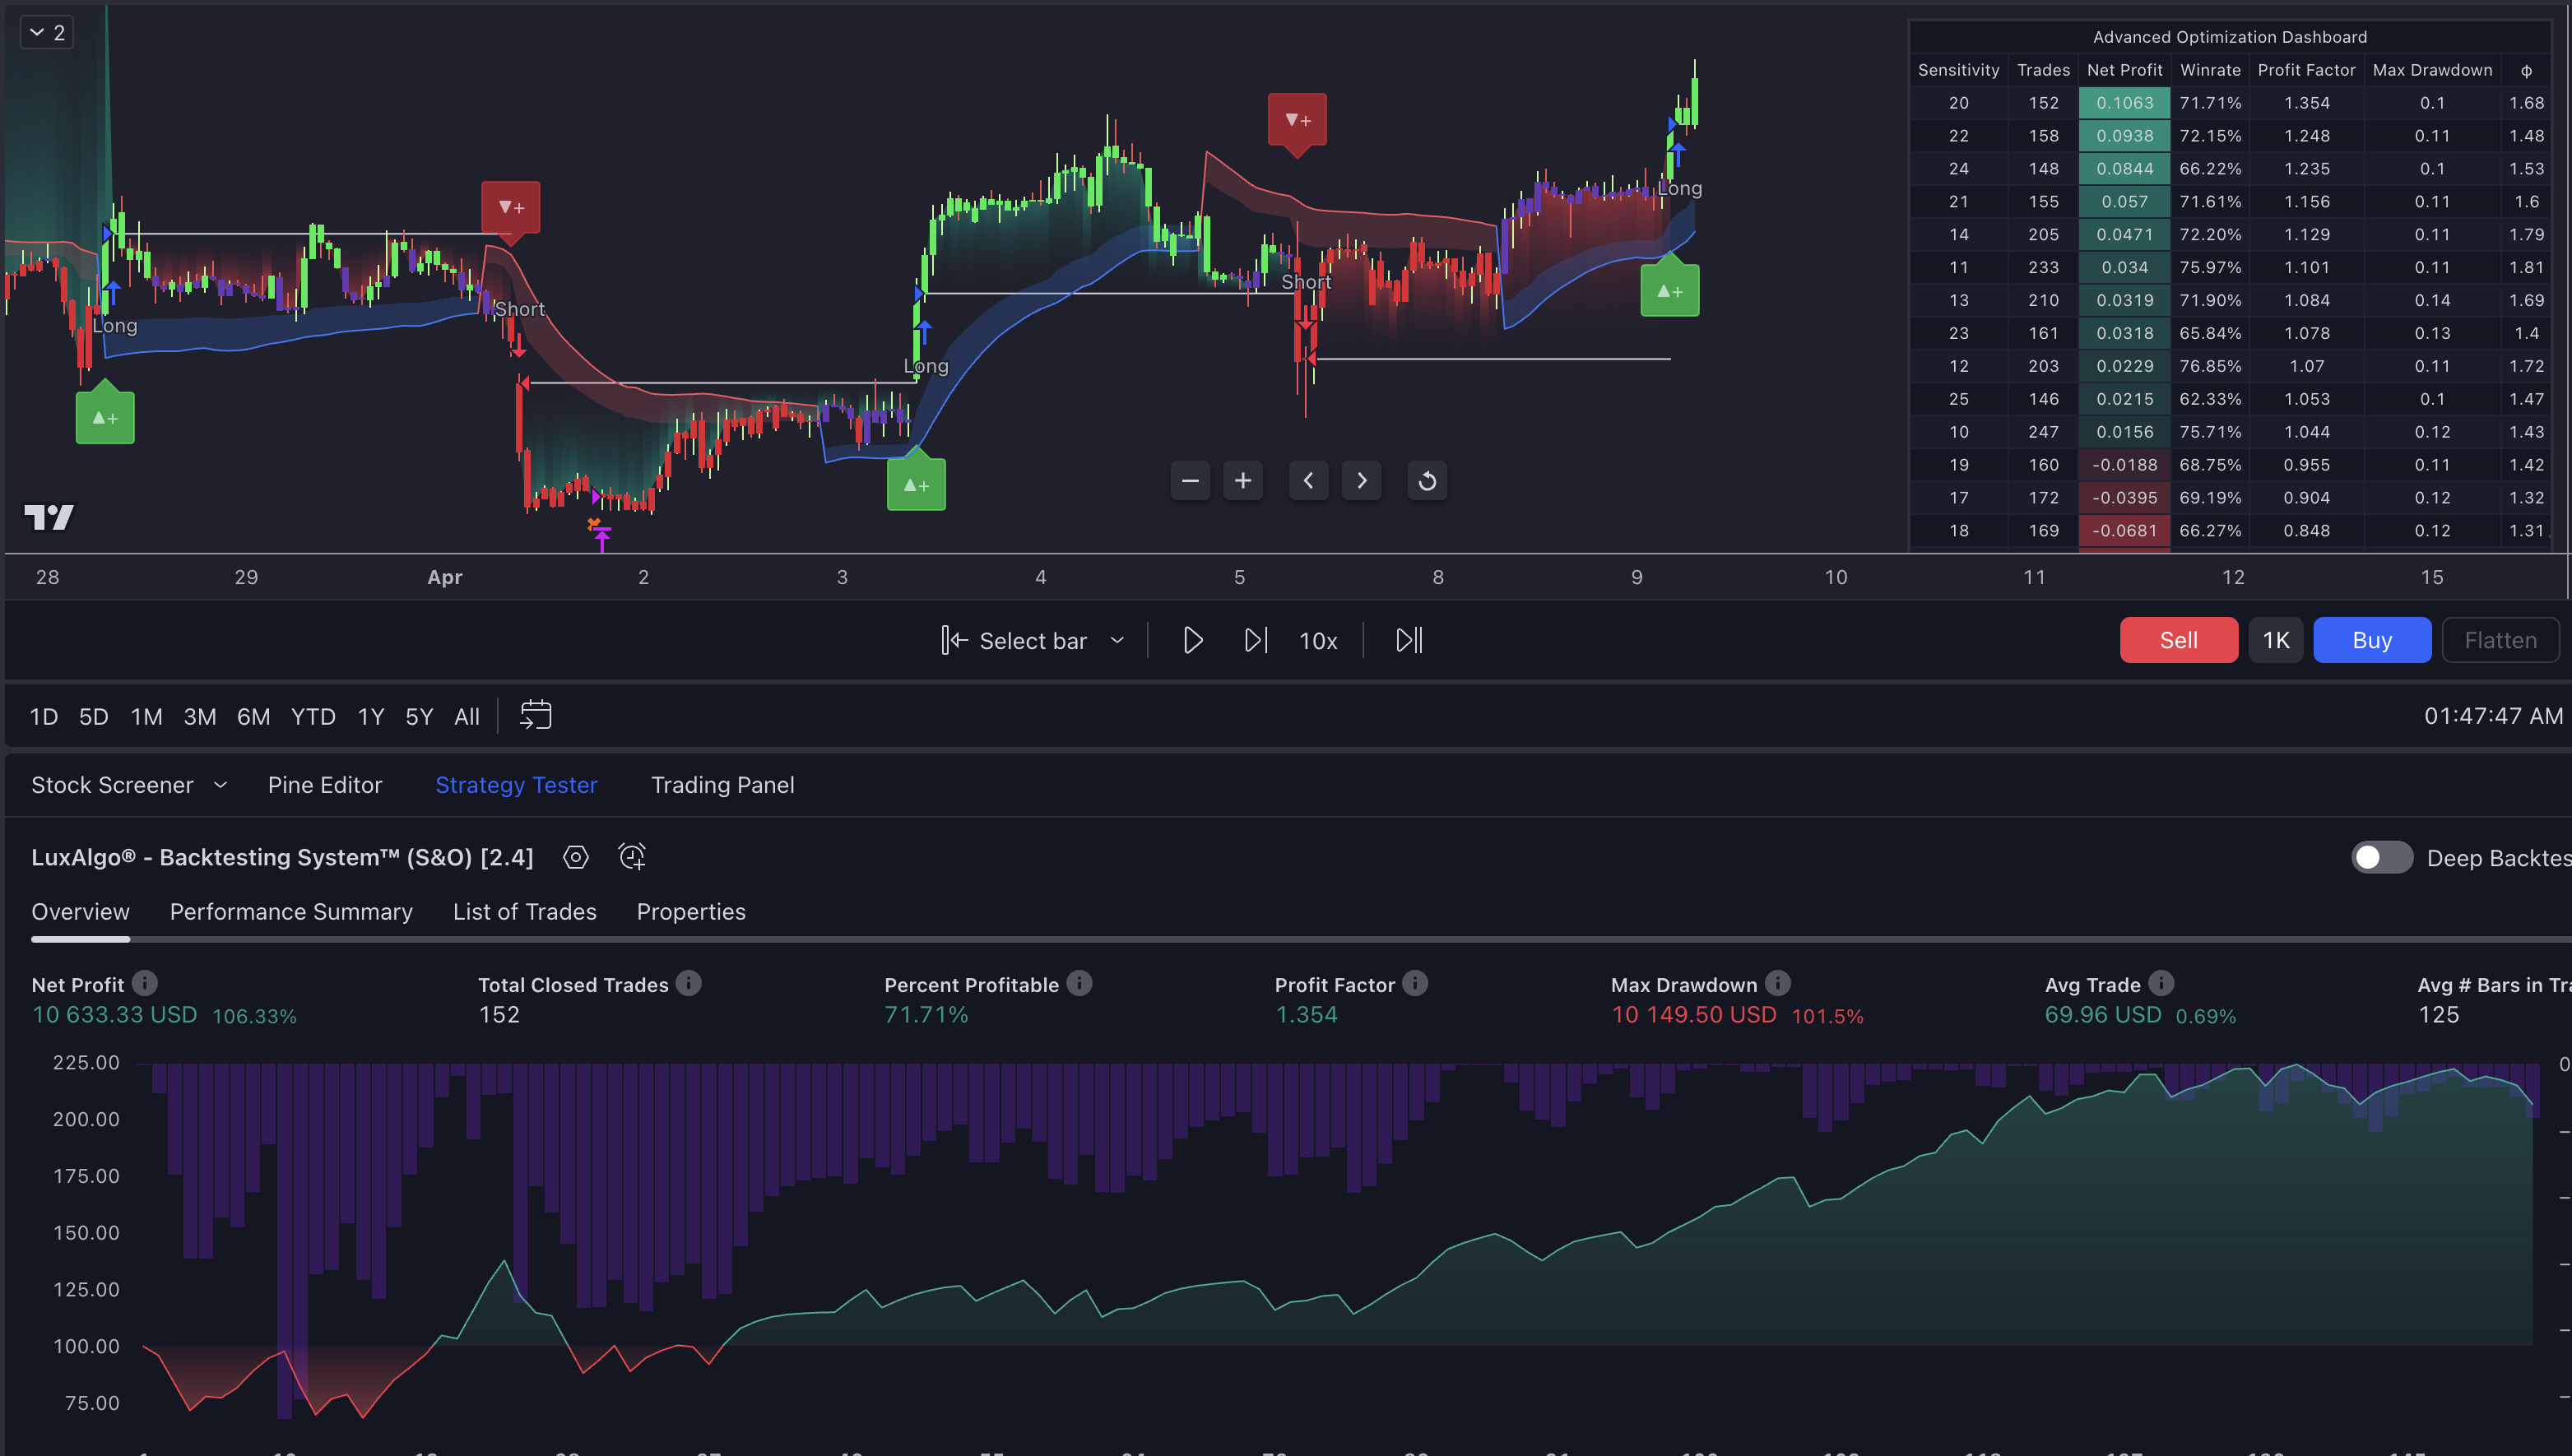
Automated Backtesting & AI Assistance
For traders who prefer to skip the manual grind, the LuxAlgo Backtesting system offers an advanced, automated solution that leverages the power of an AI Backtesting Assistant. This platform is designed for those who want to effortlessly simulate and optimize trading strategies without the time-consuming process of manual data review. By integrating intelligent automation with robust data analytics, it provides comprehensive performance insights and streamlines strategy development for traders of all levels.
This system not only automates data processing but also offers an AI-powered assistant that helps refine trading strategies. It intelligently analyzes market trends and suggests optimizations, giving you more time to focus on strategic decisions rather than manual data crunching.