
Learn effective strategies for intraday trading through market structure breakouts, focusing on volume confirmation and risk management.
Market structure breakouts are critical moments in intraday trading when prices move beyond key support or resistance levels. These breakouts often signal shifts in market sentiment and create trading opportunities. Here's what you need to know:
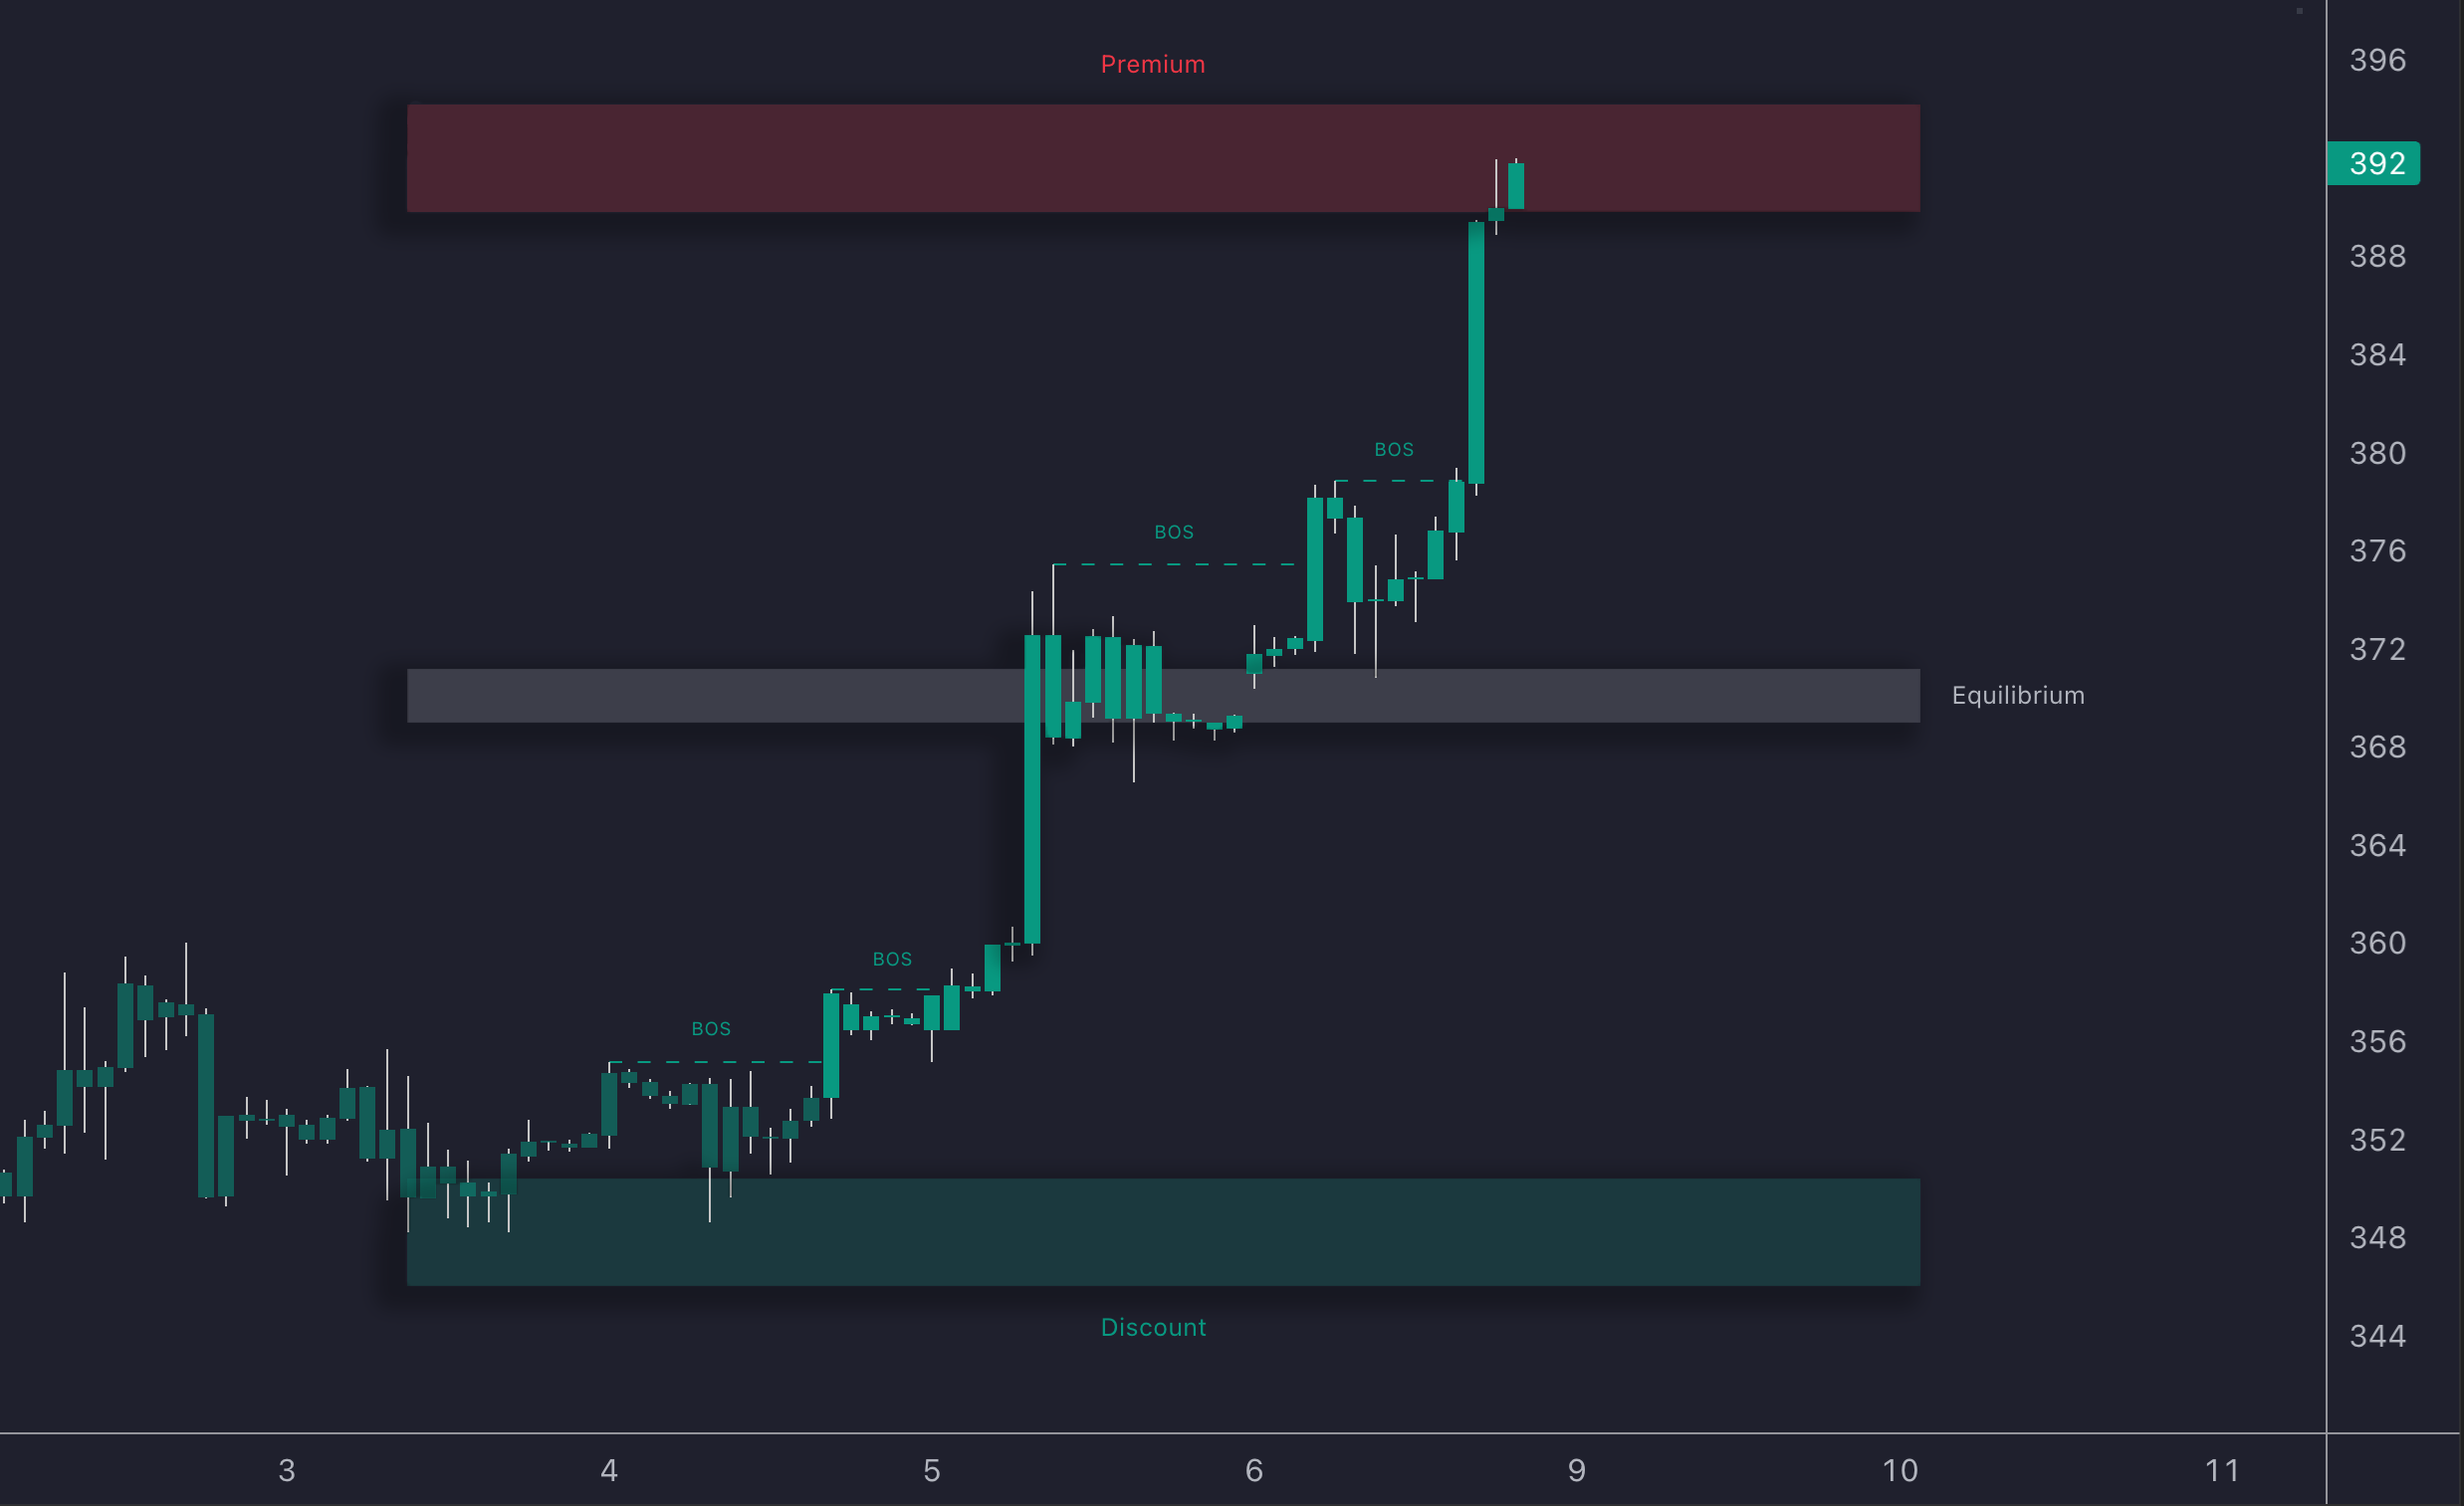
- What is a Breakout?: A breakout occurs when prices move decisively beyond a key level, confirmed by higher trading volume.
- Why It Matters for Intraday Traders: Breakouts offer momentum-based opportunities to capitalize on sharp price movements.
- How to Identify Breakouts:
- Look for price compression patterns (5-10 candles with clear support/resistance levels).
- Confirm with a volume spike during the breakout.
- Use multiple timeframes to validate setups (e.g., daily, 1-hour, and 5-minute charts).
- Key Trading Strategies:
- Place stop-loss orders just below (for long trades) or above (for short trades) the breakout level.
- Set profit targets using the Measured Move Approach or ATR-based levels.
- Exit immediately if the breakout fails and price reverses.
Takeaway: Focus on volume confirmation, use clear risk management, and rely on tools to identify and execute high-probability trades. Breakouts with strong volume often lead to sustained price trends, making them valuable for intraday strategies.
The ONLY Market Structure Lesson You'll EVER Need
Building a Breakout Strategy
Breakout strategies rely on three key factors: price compression patterns, volume confirmation, and alignment across multiple timeframes. For intraday traders, this means quickly spotting compression patterns and confirming signals in real time.
Spotting Price Consolidation
To identify price compression patterns, look for:
- At least 5-10 candles forming the pattern[1][3]
- Clear boundaries created by symmetrical highs and lows[1][3]
- Decreasing volume during the consolidation phase[1][3]
- Obvious horizontal or slightly angled support and resistance levels[1][3]
The strength of the consolidation pattern affects the reliability of the breakout. High-quality setups often show price moving toward breakout levels. For bullish setups, watch for higher lows nearing resistance. For bearish ones, look for lower highs approaching support[4].
Understanding Volume Signals
| Volume Pattern | What It Indicates | What to Do |
|---|---|---|
| Declining Volume | Consolidation phase | Monitor for compression |
| Volume Spike | Breakout confirmation[1][3] | Validate entry signals |
| Sustained High Volume | Trend continuation[1][3] | Hold your position |
Volume is a critical piece of the puzzle. A spike often confirms a breakout, while sustained high volume signals the trend may continue.
Using Multiple Timeframes
Intraday traders should analyze three timeframes to refine their strategy:
- Higher Timeframe (Daily/4-Hour): Reveals overall trend direction and key levels.
- Intermediate Timeframe (1-Hour): Ensures the pattern is valid.
- Lower Timeframe (15/5-Minute): Pinpoints entry points and stop-loss placements.
These combined insights will guide your entry strategies, which we’ll dive into next.
Trading Breakouts
Once you've identified high-probability setups using multi-timeframe analysis, the next step is all about precise execution.
Entry Points and Stops
Timing and risk management are key for successful intraday breakout trades. For the best results, align your entries with high-volume periods, like market opens. Here's how to place stops effectively:
| Trade Direction | Stop-Loss Placement | Volatility Buffer |
|---|---|---|
| Long Positions | Just below the breakout level | 1-2 ATR below the entry |
| Short Positions | Just above the breakout level | 1-2 ATR above the entry |
Setting Profit Targets
For intraday trades, profit targets should be grounded in market behavior, not random price points. Two reliable methods include:
- Measured Move Approach: Take the height of the consolidation pattern and project it from the breakout point.
- ATR-Based Targets: Use multiples of the Average True Range (ATR) to set staggered profit levels:
- First target: 2x ATR from the entry
- Second target: 3x ATR from the entry
- Final target: Based on prior resistance levels [1]
Managing Failed Breakouts
Not every breakout will succeed, and recognizing failure quickly is crucial. Look out for these red flags:
- Immediate price rejection after the breakout [2][4]
- Reversal patterns forming near key levels [3]
"The usual progression of successful breakouts is split into two scenarios: Hold of microshelf around the break level and then push, or strong quick move instantly after breaking of key level [6]."
If a breakout fails, act decisively:
- Exit immediately if the price drops back into the previous range.
- Consider reversing your position if the failure is confirmed by volume.
These strategies are especially important for fast intraday moves, which we'll delve into further with specialized tools in the next section.
Tools for Breakout Trading
Executing breakout strategies effectively involves using three key types of tools:
LuxAlgo Market Structure Tools
The LuxAlgo Price Action Concepts (PAC) toolkit simplifies breakout detection with automated features designed to improve trading accuracy. It identifies critical support and resistance levels, making it easier for traders to find potential breakout zones[1].
- Real-time breakout alerts
- Multi-timeframe level identification
- Volume-confirmed signals
- Automated pattern recognition
On average, PAC toolkit users see gains of 1.6% within hours of a breakout[1].
Volume Profile and VWAP Analysis
| Tool | Purpose | Role in Breakout Trading |
|---|---|---|
| Volume Profile | Highlights high-volume nodes | Confirms breakout strength at key areas |
| VWAP | Serves as dynamic support/resistance | Validates breakout direction |
| Time-Based Volume | Tracks intraday activity patterns | Helps pinpoint breakout entry timing |
"Volume profile analysis is essential for identifying value areas where most trading activity occurs. Breakouts from these areas often lead to significant price movements[5]."
Testing with LuxAlgo AI
LuxAlgo's AI Backtesting Assistant is a powerful tool for validating breakout strategies. It offers:
- Optimization of breakout parameters to fine-tune thresholds.
- Multi-timeframe intraday testing to assess performance.
- Stress-testing across market conditions to prepare for varying scenarios.
Conclusion
Breakout trading strategies can drive intraday success when executed with precision and discipline. Let’s recap the essentials.
Key Insights
To trade breakouts effectively, focus on volume confirmation and enforce strict risk management. Use correlated timeframe analysis to weed out false signals while staying open to high-probability opportunities. Breakouts accompanied by strong volume often lead to more sustained price movements[2]. This methodical approach minimizes the impact of false breakouts, which are common in all market conditions.
Tools for Breakout Trading
Modern tools have made breakout trading more efficient. Advanced platforms now offer automated pattern recognition and market structure analysis, while AI-based testing helps refine strategies across different scenarios.
Combining these tools with a disciplined execution plan allows traders to build stronger strategies for market structure breakouts. By applying these techniques, traders can approach structural market shifts with confidence and consistency.
FAQs
What is a breakout of market structure?
A breakout of market structure happens when an asset's price moves past a well-defined support or resistance level. This often signals a possible change in the market's direction. For intraday traders, such breakouts are key opportunities that can lead to profitable trades.
To identify a valid breakout, look for these signs:
- A clear move beyond key levels
- A surge in volume (at least 1.5x the average)
- Occurrence after compression patterns
- Alignment with active trading sessions
For added precision, tools like LuxAlgo's automated pattern recognition can help confirm breakouts.
To manage risk, place stop-loss orders just below the breakout level for long positions or just above it for short positions. This approach helps guard against false breakouts. These strategies align with the entry and stop-loss techniques discussed in the Trading Breakouts section.