Understand Maximum Drawdown, a crucial metric for risk management in trading, and learn effective calculation methods and best practices.
Maximum Drawdown (MDD) measures the largest percentage drop in a portfolio's value from its peak to its lowest point before recovery. It's a critical metric for understanding risk and managing trading strategies effectively.
Key Takeaways:
- Why It Matters: MDD reveals the worst-case loss, helping traders set risk limits and compare strategies.
- How to Calculate: Identify the peak, find the lowest point after it, and calculate the percentage drop.
- Tools to Use: Platforms like TradingView simplify MDD tracking with automated alerts and visual tools, while LuxAlgo provides hundreds of free trading indicators along with exclusive tools & an AI Backtesting Assistant that locates strategies with low drawdown.
- Practical Use Cases: MDD informs stop-loss settings, portfolio diversification, and position sizing.
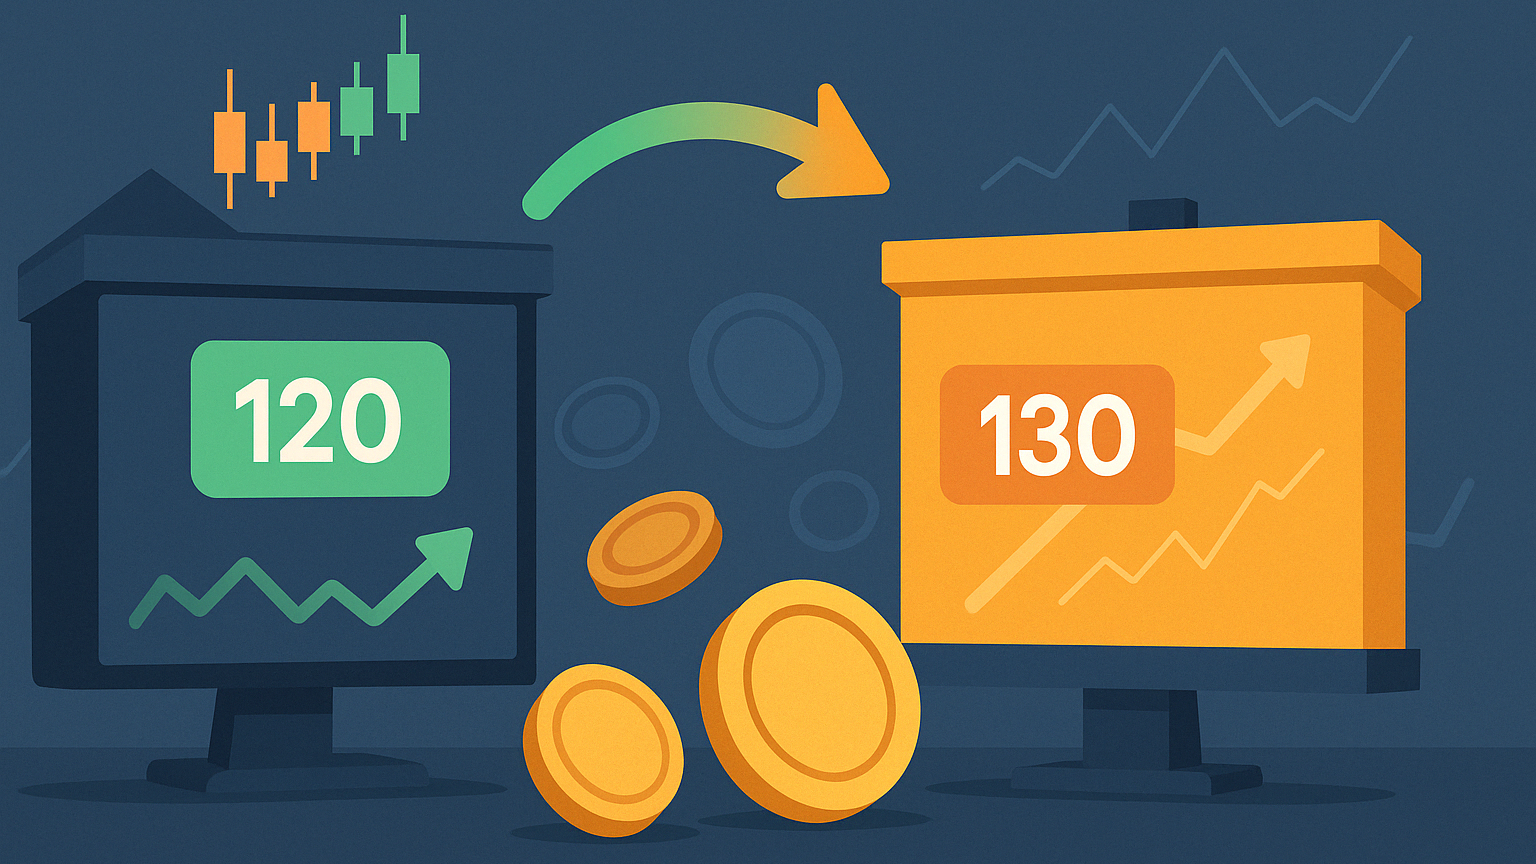
Quick Example:
If a portfolio grows to $100,000, drops to $75,000, and then recovers, the MDD is 25%. This shows the maximum loss endured during the period.
MDD analysis helps traders avoid irreversible losses, optimize strategies, and adjust to market conditions effectively.
The Maximum Drawdown Explained in 3 Minutes
MDD Calculation Methods
Let’s break down how to calculate Maximum Drawdown (MDD) using both manual and automated methods.
Step-by-Step Manual Calculation
Manually calculating MDD involves comparing the highest (peak) and lowest (trough) points in your trading data. Here’s how to do it step by step:
| Step | Action | Example |
|---|---|---|
| 1. Peak Identification | Find the highest value in the dataset | $100 (Initial peak) |
| 2. Trough Location | Identify the lowest value after the peak | $60 (Lowest following peak) |
| 3. Calculate Drawdown | (Trough - Peak) / Peak × 100 | ($60 - $100) / $100 × 100 = -40% |
| 4. Repeat Process | Apply the same steps for all peaks |
For larger datasets, spreadsheets can simplify this process:
- Column B: Input price data.
- Column C: Use
=MAX($B$2:B2)to track running peaks. - Column D: Use
=(B2-C2)/C2to calculate drawdown percentages. - Use
=MIN(D:D)to find the MDD.
TradingView MDD Tools

Manual calculations work well for small datasets, but platforms like TradingView make MDD analysis much easier for larger datasets. TradingView provides:
- Visual tools to compare MDD across different assets.
- Customizable thresholds for drawdown alerts.
- Automated notifications when drawdown limits are reached.
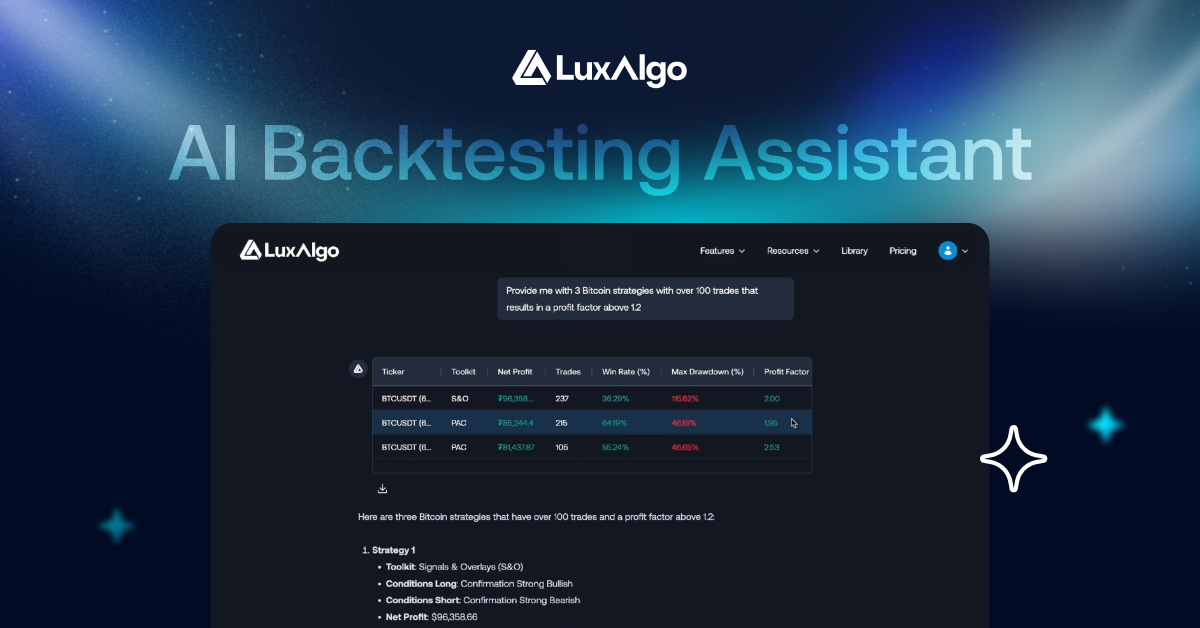
LuxAlgo AI Backtesting Assistant for Low Drawdown Strategies
LuxAlgo’s AI Backtesting Assistant leverages advanced artificial intelligence to scan through historical market data and identify trading strategies that exhibit low drawdown characteristics. By automating the backtesting process, this platform enables traders to quickly pinpoint high-performing strategies that effectively minimize risk while optimizing returns.
Using natural language queries, traders can instruct the AI to locate strategies with favorable drawdown metrics. The interactive experience simplifies the backtesting process—providing clear performance insights and allowing both beginners and experienced traders to refine their strategy selection with a focus on risk management.
This AI-driven approach not only streamlines strategy discovery but also integrates seamlessly with TradingView’s interface, offering real-time insights alongside comprehensive historical performance reports.
Drawdown Control Methods
These methods use Maximum Drawdown (MDD) metrics from earlier analysis to put strategies into action, helping manage and reduce trading risks effectively.
Position Size Management
Using a $100,000 account as an example, applying a 2% risk rule means risking no more than $2,000 per trade. If the account balance drops to $90,000, the risk per trade automatically adjusts to $1,800 [1]. Citadel Securities demonstrated the effectiveness of this approach by cutting drawdowns by 61% through volatility-based position sizing, while still achieving annual returns of 16.4%. This strategy aligns with their historical MDD levels.
Risk Spreading Techniques
Diversification plays a key role in managing MDD, as seen in LuxAlgo's correlation analysis. Research suggests that spreading trades across 5-7 uncorrelated markets can lower maximum drawdown by up to 30% compared to trading in a single market [2].
| Asset Class | Allocation |
|---|---|
| Stock Indices | 40% |
| Forex Pairs | 30% |
| Commodities | 20% |
| Cryptocurrencies | 10% |
Market Volatility Exits
Using Average True Range (ATR)-based exits can help adjust to market volatility while managing drawdowns. Backtesting across 100 strategies shows that ATR-based stops can reduce MDD by an average of 15% [5]. These exits are calculated using ATR values, such as those tracked through TradingView scripts.
To apply this approach:
- Set initial stops at 2-3x ATR during stable market conditions.
- Tighten stops to 1.5x ATR when account drawdown reaches 50% of its historical maximum.
- Reduce stops further to 1x ATR during highly volatile periods.
This step-by-step adjustment helps maintain consistent risk management across different market environments.
Conclusion
Key Points About MDD
Analyzing Maximum Drawdown (MDD) is crucial for managing trading risks and making informed portfolio decisions. The collapse of Melvin Capital in 2022, following consecutive drawdowns of 39% and 23%, highlights the dangers of neglecting proper MDD management. These examples emphasize the importance of strategies like position sizing and alert systems.
Key takeaways from backtesting include:
- Monitoring MDD helps avoid irreversible losses.
- Recovery time is just as critical as the drawdown itself.
- Market conditions influence how quickly traders need to act.
Tips for Using MDD Tools
Platforms like TradingView and LuxAlgo offer effective solutions for applying MDD analysis in trading. Here’s how to make the most of them:
- Set realistic drawdown limits based on your strategy’s historical data.
- Use LuxAlgo's AI Backtesting Assistant to fine-tune entry and exit strategies.
- Enable automated alerts in TradingView to stay informed when nearing critical MDD levels.
- Regularly adjust your parameters to align with changing market conditions.
While MDD tools are powerful, they should always be part of a comprehensive risk management plan.
FAQs
What is the maximum drawdown as a risk measure?
Maximum drawdown (MDD) is a metric that calculates the largest drop in portfolio value from its peak to its lowest point before recovering. It focuses solely on downside risk, which is particularly important for investors who prioritize minimizing losses [1][3].
What is the difference between drawdown and max drawdown?
Drawdown refers to any drop in portfolio value from a peak to a trough, while maximum drawdown highlights the largest such drop over a specific period [2]. Here's how they differ:
| Aspect | Drawdown | Maximum Drawdown |
|---|---|---|
| Time Period | Covers any decline period | Focuses on the largest decline over the entire period |
| Frequency | Can happen multiple times | Represents the single worst instance |
| Risk Assessment | Reflects the current decline | Shows the worst historical drop |
| Recovery Analysis | Tracks recovery needed now | Indicates the maximum recovery required historically |
What is the maximum drawdown of a strategy?
The maximum drawdown of a strategy is the largest percentage loss it has experienced over a given timeframe. This measure provides insight into a strategy's worst historical performance, helping investors gauge its risk level and set realistic expectations [1].
Tools like TradingView and LuxAlgo enhance MDD tracking by combining historical analysis with dynamic risk management techniques. These platforms allow users to:
- Track real-time and historical drawdowns
- Set alerts for specific thresholds
- Analyze MDD across various timeframes