Learn how measured moves in technical analysis can enhance your trading strategy by predicting price targets and managing risk effectively.
Measured moves are a simple yet powerful tool in technical analysis. They help traders predict future price movements by identifying recurring patterns in the market. Here's what you need to know:
-
What Are Measured Moves?
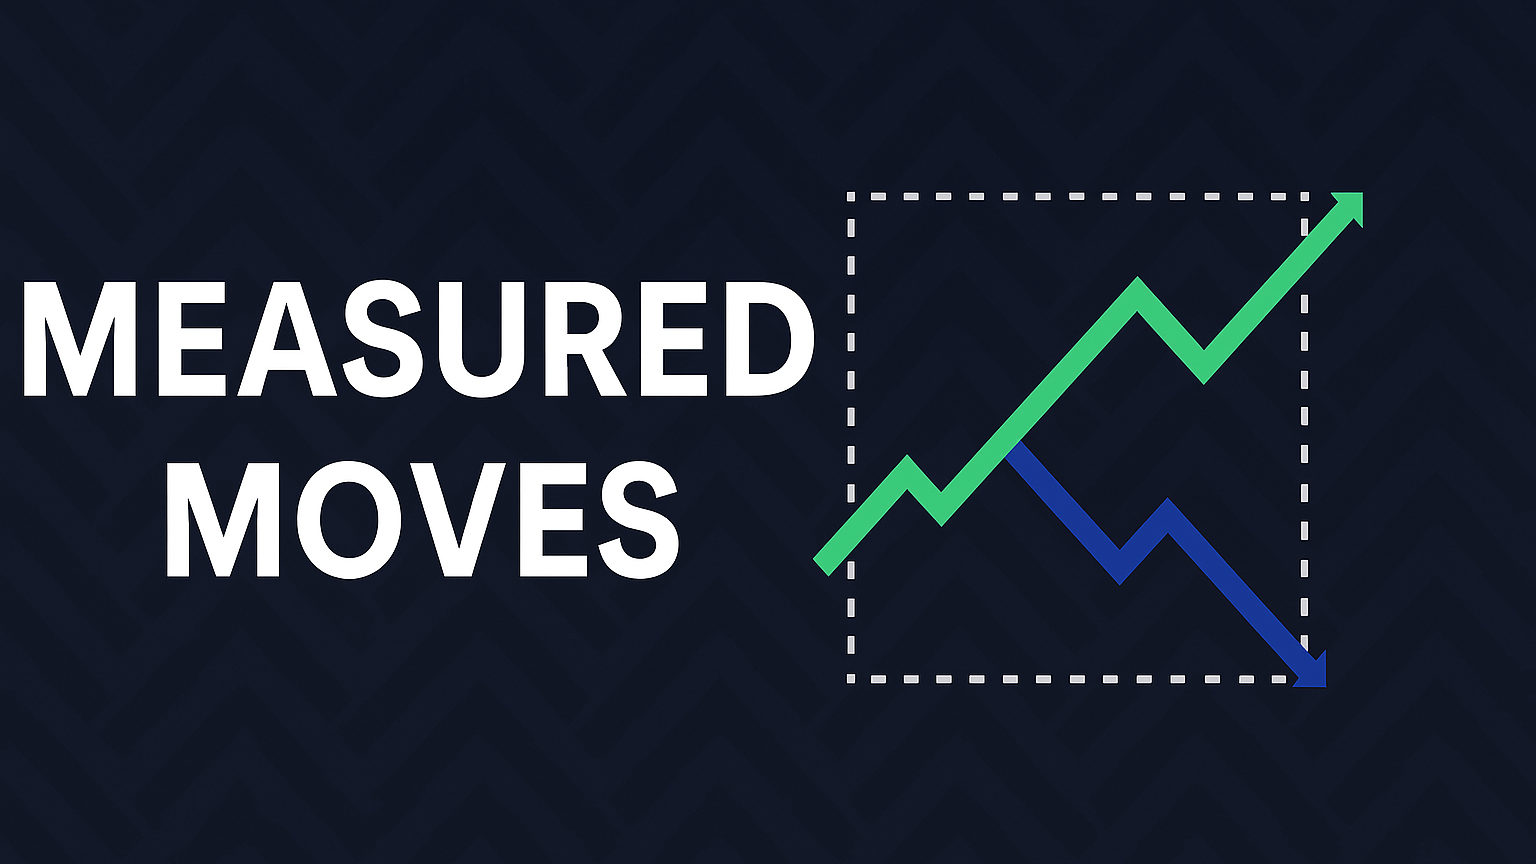
A three-part price pattern: an initial strong move, a retracement, and a continuation of the trend.
Example: If a stock rises from $50 to $70, retraces to $60, the target would be $80. -
Why They Matter:
- Set realistic profit targets.
- Manage risk with logical stop-loss levels.
- Work across different timeframes and market conditions.
-
How to Spot Them:
Look for patterns like flags, pennants, or wedges on charts. Confirm using volume analysis, trendlines, and price action signals. -
Key Tools:
Use Fibonacci levels, moving averages, and volume trends to refine predictions.
Measured moves simplify trading by offering a structured way to estimate price targets. Whether you're analyzing stocks, crypto, or other markets, this method provides clarity and actionable insights.
Measured Moves: Price Action Fundamentals
How to Spot Measured Move Patterns
Identifying measured moves requires understanding their structure and recognizing specific chart patterns. These moves typically follow a three-step sequence: a strong initial move (AB leg), a consolidation phase (BC leg), and a continuation of the trend (CD leg). The first leg is marked by high momentum and volume, while the consolidation phase shows reduced activity.
For instance, in November 1998, Intel Corp.'s stock price rose sharply from $17.44 to $35.92, retraced 54% during the consolidation phase, and then climbed to $44.75.
Basic Chart Formations
Measured moves often appear within familiar chart patterns. Here are a few to watch for:
| Formation | Characteristics | How to Spot |
|---|---|---|
| Flags | Two parallel trendlines containing price movements | Check for decreasing volume during formation |
| Pennants | Converging trendlines forming a small triangle | Typically shorter in duration compared to flags |
| Wedges | Converging trendlines sloping in the same direction | Look for a breakout accompanied by rising volume |
Corrections in these patterns generally retrace 20%-50% of the initial move, with the next leg extending 60%-120% of the original move.
How to Confirm Patterns
To validate measured moves, use these methods:
- Volume Analysis: Look for strong volume during the AB leg, lower volume in the BC leg, and a decisive breakout. Trendlines can help pinpoint support and resistance levels.
- Trendline Assessment: Draw trendlines to mark support and resistance during the consolidation phase. These levels often act as triggers for the continuation move.
- Price Action Signals: Watch for a clear breakout from the consolidation phase. For example, a break above the resistance line of a descending flag often signals the trend's continuation.
Stable volatility can improve the reliability of these patterns.
"The Measured Move is a three-part formation that begins as a reversal pattern and resumes as a continuation pattern." - ChartSchool
Price Target Calculations

Once you've identified measured move patterns, the next step is figuring out price targets. This involves using specific price segments and making adjustments based on current market conditions.
Price Target Method
To calculate the target, measure the AB leg, account for the retracement (BC leg), and then add the AB length to the retracement's endpoint to estimate the CD target.
| Move Component | How to Calculate |
|---|---|
| Initial Move (AB) | Measure the price range from the starting point to the peak of the move. |
| Correction (BC) | Determine the depth of the retracement. |
| Target Move (CD) | Add the length of the initial move to the end of the retracement. |
Example: If a stock rises from $50 to $70 (a $20 move) and retraces to $60, the projected target would be $80 ($60 + $20).
Using Fibonacci Levels
Fibonacci retracements can help confirm measured move targets by identifying key support and resistance levels. The most commonly used Fibonacci levels in this context are:
- 38.2% retracement: Often seen in strong trends.
- 50.0% retracement: Represents a natural equilibrium in the market.
- 61.8% retracement: Suggests a deeper pullback.
- 161.8% extension: Frequently used to project targets for measured moves.
Adjusting for Market Conditions
Market conditions can influence the accuracy of target calculations. Key factors to consider include:
- Trend Strength: Stronger trends typically produce more predictable moves.
- Volatility Levels: Higher volatility may require a wider target range.
- Market Structure: Recent price action often carries more weight than older patterns.
Measured moves are generally most reliable in continuation setups. However, they may lose accuracy during periods of structural shifts or when the market reaches exhaustion points.
Trading with Measured Moves
Trade Entry and Exit Rules
Once you've identified a pattern, it's time to set clear rules for entering and exiting trades. For instance, enter a trade after a consolidation phase when the price breaks resistance with higher trading volume. A good example is from November 1998, when Intel Corp. broke through resistance at $22 after an initial move from $17.44 to $35.92. The price movement came close to the projected target of $44.42.
Risk Control Methods
Effective risk management is key. Here are some common methods and how to use them:
| Risk Control Type | How to Apply | Best For |
|---|---|---|
| Percentage-Based | Limit to 2% of position value | Standard market conditions |
| Volatility-Based | Set stops at 2× ATR from entry | Highly volatile markets |
| Technical Level | Place stops below support/resistance | Trend-following trades |
For example, in a volatile market like Bitcoin, if your entry point is $26,500 and the ATR (Average True Range) is 700, set your stop-loss at $25,100 (2× ATR below entry).
"Avoiding a loss takes priority over improving gains. To make up for a 95% loss in value requires the investor to make an astounding gain of 1900%." - Benjamin Graham
Sticking to these risk controls ensures that your measured move strategy stays disciplined and precise.
Supporting Indicators
Enhance your measured move strategy by incorporating technical indicators:
- Moving Averages: These help confirm trends and potential reversals. Use the 50-day moving average for intermediate trends and the 200-day moving average for long-term direction. A "golden cross" (50-day crossing above 200-day) often signals a bullish trend, while a "death cross" (50-day falling below 200-day) may indicate a bearish reversal.
- Volume Patterns: Volume provides critical validation. Look for increased volume during reversals, reduced volume during consolidation phases, and a surge in volume when the continuation move begins.
Combining these tools with measured moves can improve your trading insights and decision-making.
Advanced Techniques
Timeframe Analysis
Measured moves work across all timeframes. Choose a primary timeframe that aligns with your trading strategy and complement it with higher or lower timeframes for added perspective or precision. For instance, a swing trader might rely on daily charts for trade signals, weekly charts for a broader view, and 4-hour charts for fine-tuning entries.
Here's a quick breakdown of timeframe levels and their roles:
| Timeframe Level | Primary Use | Considerations |
|---|---|---|
| Higher Timeframe | Trend Direction | Gives a bigger picture but lacks fine detail |
| Primary Timeframe | Trade Signals | Acts as the main decision-making tool |
| Lower Timeframe | Entry/Exit Timing | Provides detailed insights but adds noise |
"The beautiful thing about measured moves is you don't have to overthink. You just measure them."
Use these insights to adapt your approach to different market conditions.
Market Type Adjustments
Market conditions play a key role in how you apply measured moves. Trending markets often feature clear price steps, which help in setting profit targets. On the other hand, range-bound markets require a strategy focused on support and resistance levels.
Trending Markets:
- Look for strong initial price movements in the trend's direction.
- Use measured moves to map out potential swing points.
Range-Bound Markets:
- Identify well-defined support and resistance zones.
- Apply measured moves within these boundaries.
- Use oscillators to confirm signals at the edges of the range.
Common Errors to Avoid
While these techniques can be effective, traders often face challenges that may limit their success.
"The common mistake is saying, 'Well, it's reached 3750. I'm already up two and a half percent. I'm just going to cover it.'" – Bob Iaccino, Chief Market Strategist at Path Trading Partners
Here are some common pitfalls and how to steer clear of them:
- Premature Exit: Avoid closing trades solely based on fixed profit levels. Stick to measured move targets unless the market clearly invalidates the setup.
- Over-Reliance: Don't depend entirely on measured moves. Combine them with other technical indicators and the broader market context for better decision-making.
- Pattern Misidentification: Ensure patterns are fully confirmed before entering a trade. For example, with double tops, wait for the market to break the neckline and retest it as new resistance before proceeding.
Focus on current market behavior and treat measured moves as a guide rather than a rigid rule.
Summary
Main Points
Measured moves rely on using a strong initial price movement to estimate future targets. For instance, Intel's 1998 price action is a classic example of this method.
Here's a quick breakdown of the key components:
| Component | Purpose | Application |
|---|---|---|
| Initial Move | Sets the baseline | Measure its length for projections |
| Correction Phase | Confirms the pattern | Usually involves a 40–60% retracement |
| Continuation Move | Estimates the target | Matches the length of the initial move |
"With measured moves, you don't have to guess. You measure the move out and say, 'This is my target.' A target is not necessarily where you exit a trade. A target is where an action is required."
With these principles in mind, you can start incorporating measured moves into your trading strategy.
Getting Started
To put this method into practice, focus on clear, trending markets. As VIPROSE explains:
"Measured moves offer a structured approach to estimating price targets by identifying recurring swing patterns and projecting future price behavior based on previous moves."
For the best outcomes:
- Use professional charting tools with accurate measurement features.
- Begin with markets where trends and patterns are easy to spot.
- Verify the patterns by using additional technical indicators.


