
Learn how to effectively use moving average crossovers to identify trends, manage risks, and enhance trading strategies across various markets.
Moving average crossovers are a simple yet powerful tool for identifying market trends and making trading decisions.
Here’s what you’ll learn:
- What are Moving Averages?: SMAs (Simple Moving Averages) smooth price data, while EMAs (Exponential Moving Averages) respond faster to recent price changes.
- Key Crossover Types:
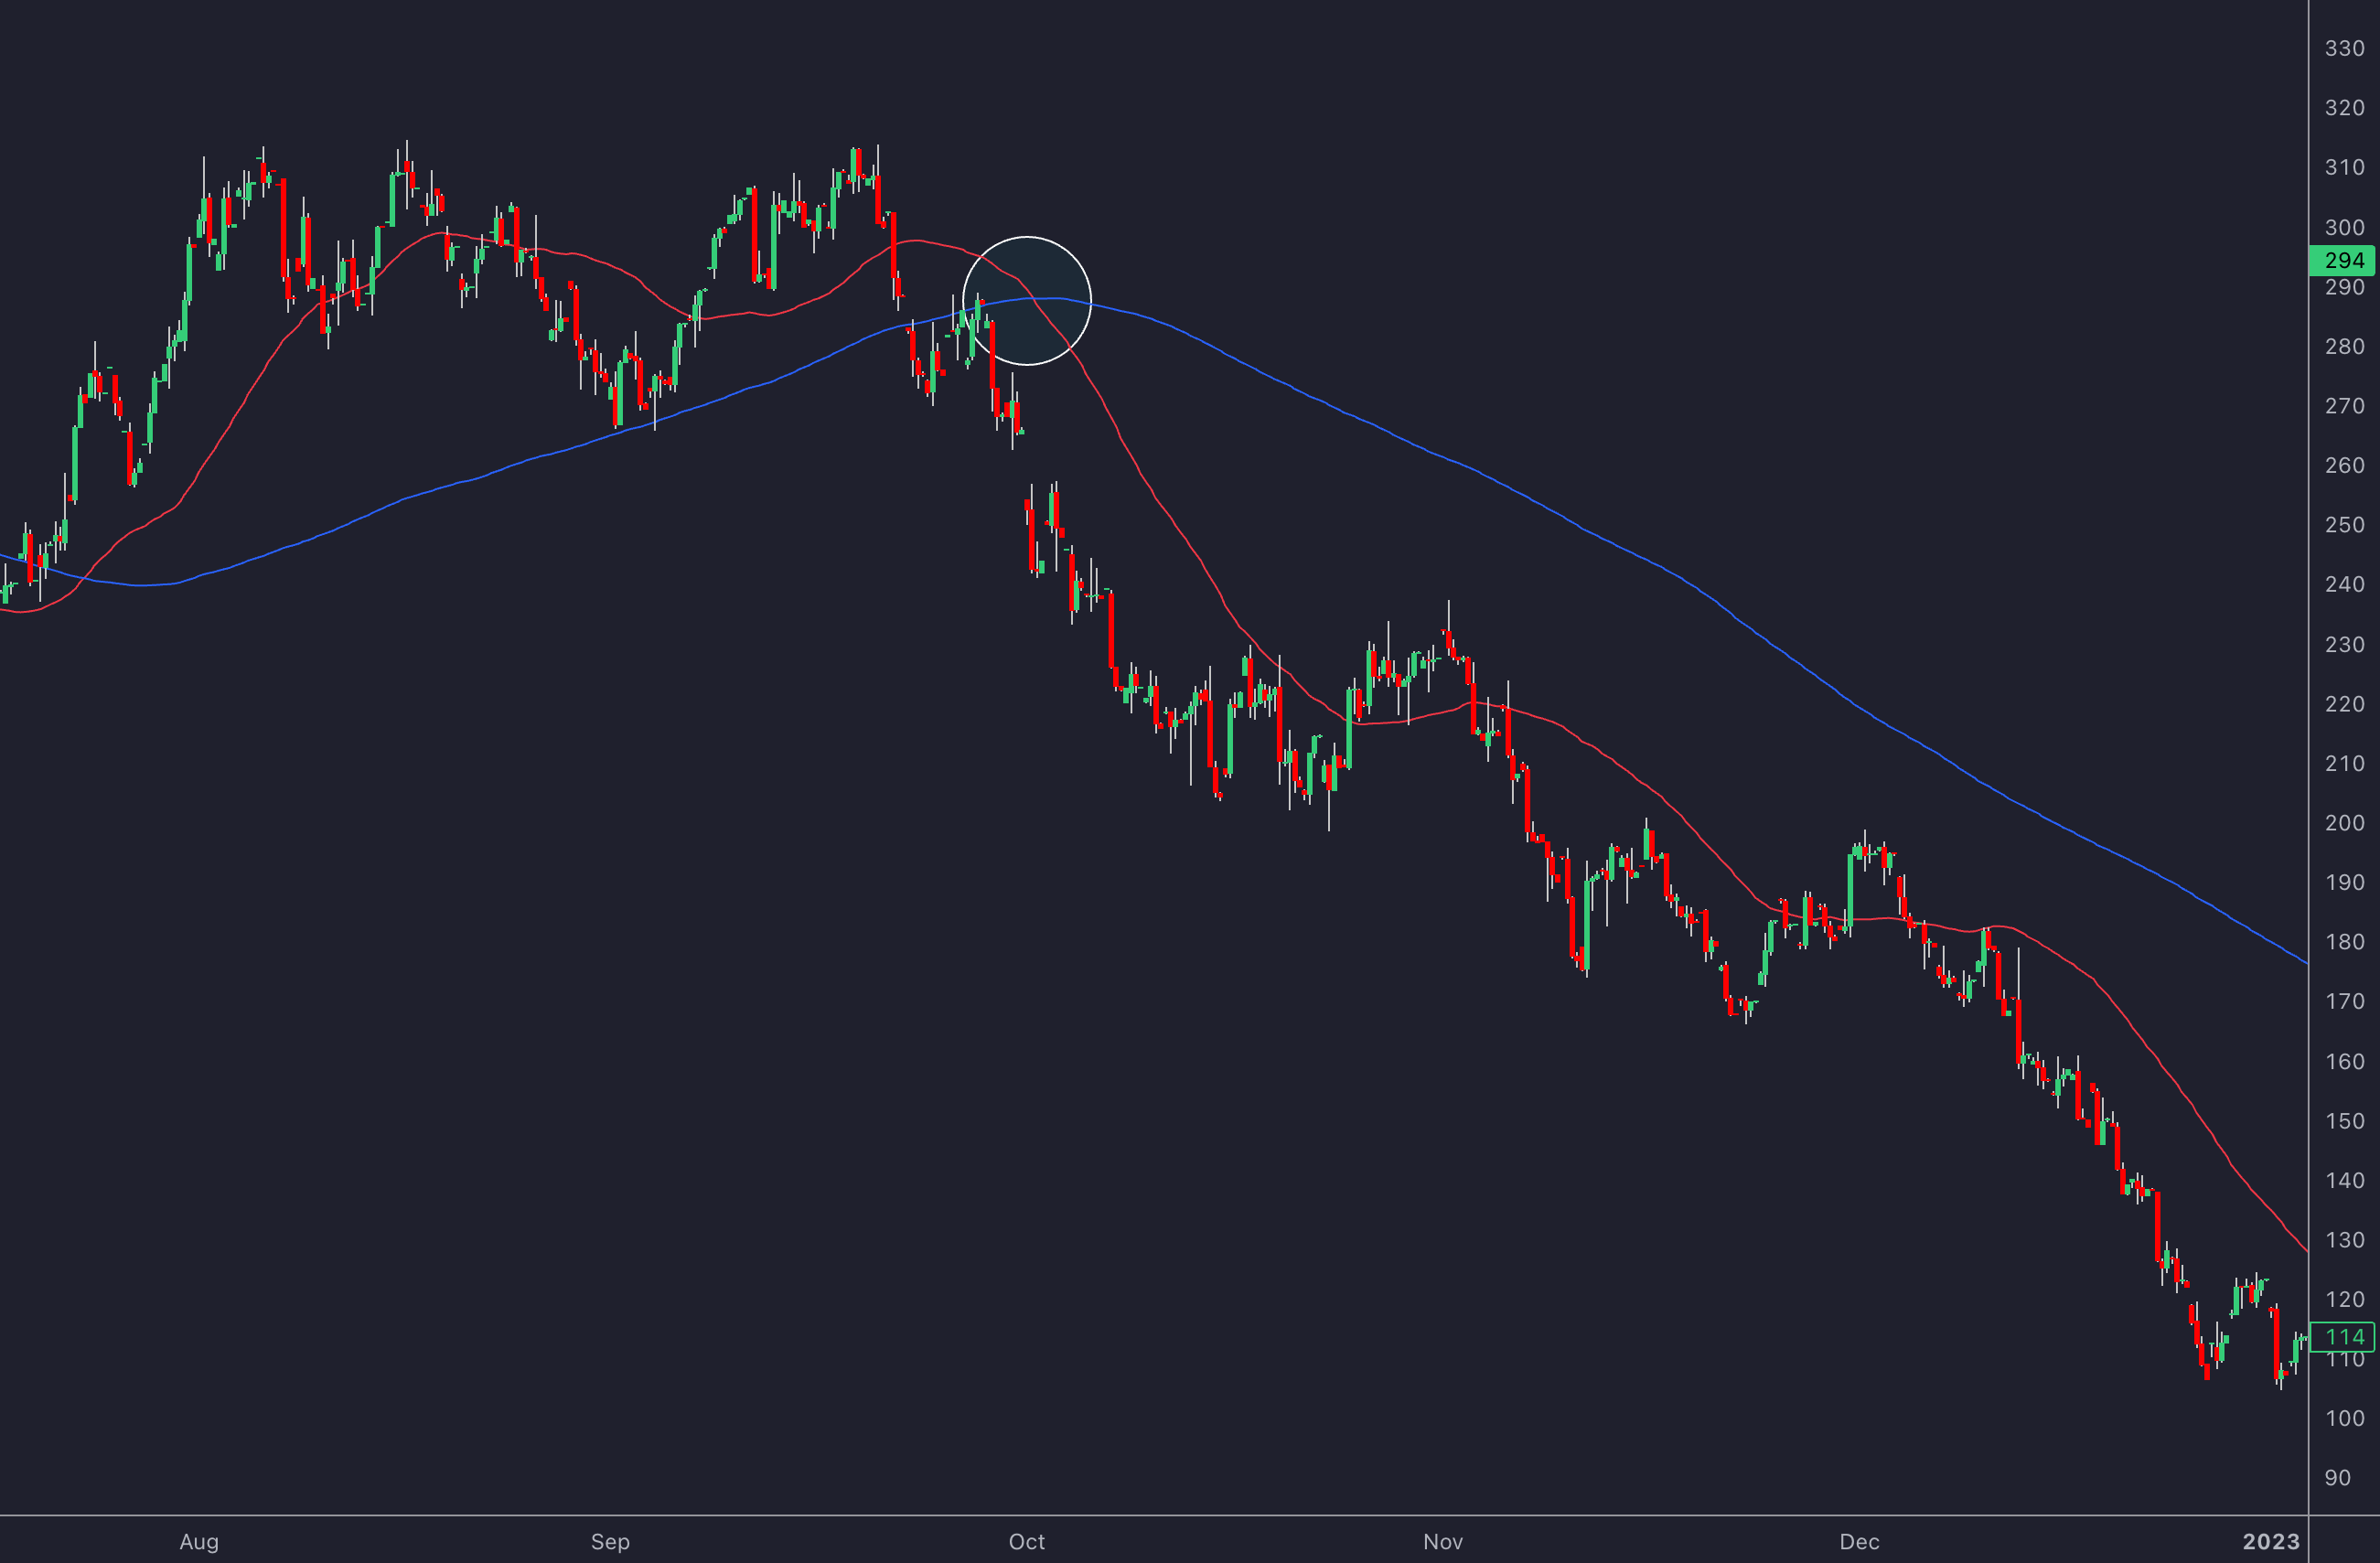
- Price-to-MA: When price crosses a moving average, signaling potential trend changes.
- Dual MA: Shorter moving averages crossing longer ones confirm trends (e.g., 20/50 EMA or 50/200 SMA).
- Golden Cross vs. Death Cross: Long-term 50/200 SMA crossovers signal bullish or bearish trends.
- Trading Strategies:
- Use specific MA setups for day trading, swing trading, or position trading.
- Combine crossovers with RSI, MACD, or volume analysis for stronger signals.
- Apply multi-timeframe analysis to align short-term trades with broader trends.
- Avoiding Mistakes: Reduce false signals, address lag issues, and improve backtesting accuracy.
| Crossover Type | Best For | Confirmation Tools |
|---|---|---|
| Price-to-MA | Day/Swing Trading | RSI, Volume |
| Dual MA | Trend Confirmation | MACD, Multi-Timeframe |
| Golden/Death Cross | Long-Term Trends | Volume, Support/Resistance |
Golden Cross Explained: Why most traders get it wrong (and how it really works)
Moving Average Crossover Trading Methods
Building on the Golden Cross and Death Cross concepts, these strategies apply crossover principles to suit various trading approaches.
Price and MA Crossovers
Price-to-MA crossovers provide straightforward entry and exit signals, making them ideal for day and swing traders. When the price moves above a moving average, it can indicate bullish momentum, while a move below suggests bearish sentiment. For day trading, the 20-period EMA is a commonly used benchmark. A typical strategy involves entering a long position when the price crosses above this level, with a stop-loss set just below the most recent swing low.
| Timeframe | MA | Stop-Loss |
|---|---|---|
| Day Trading | 20 EMA | Below recent swing low |
| Swing Trading | 50 SMA | Below MA line |
| Position Trading | 200 SMA | 2-3% below MA |
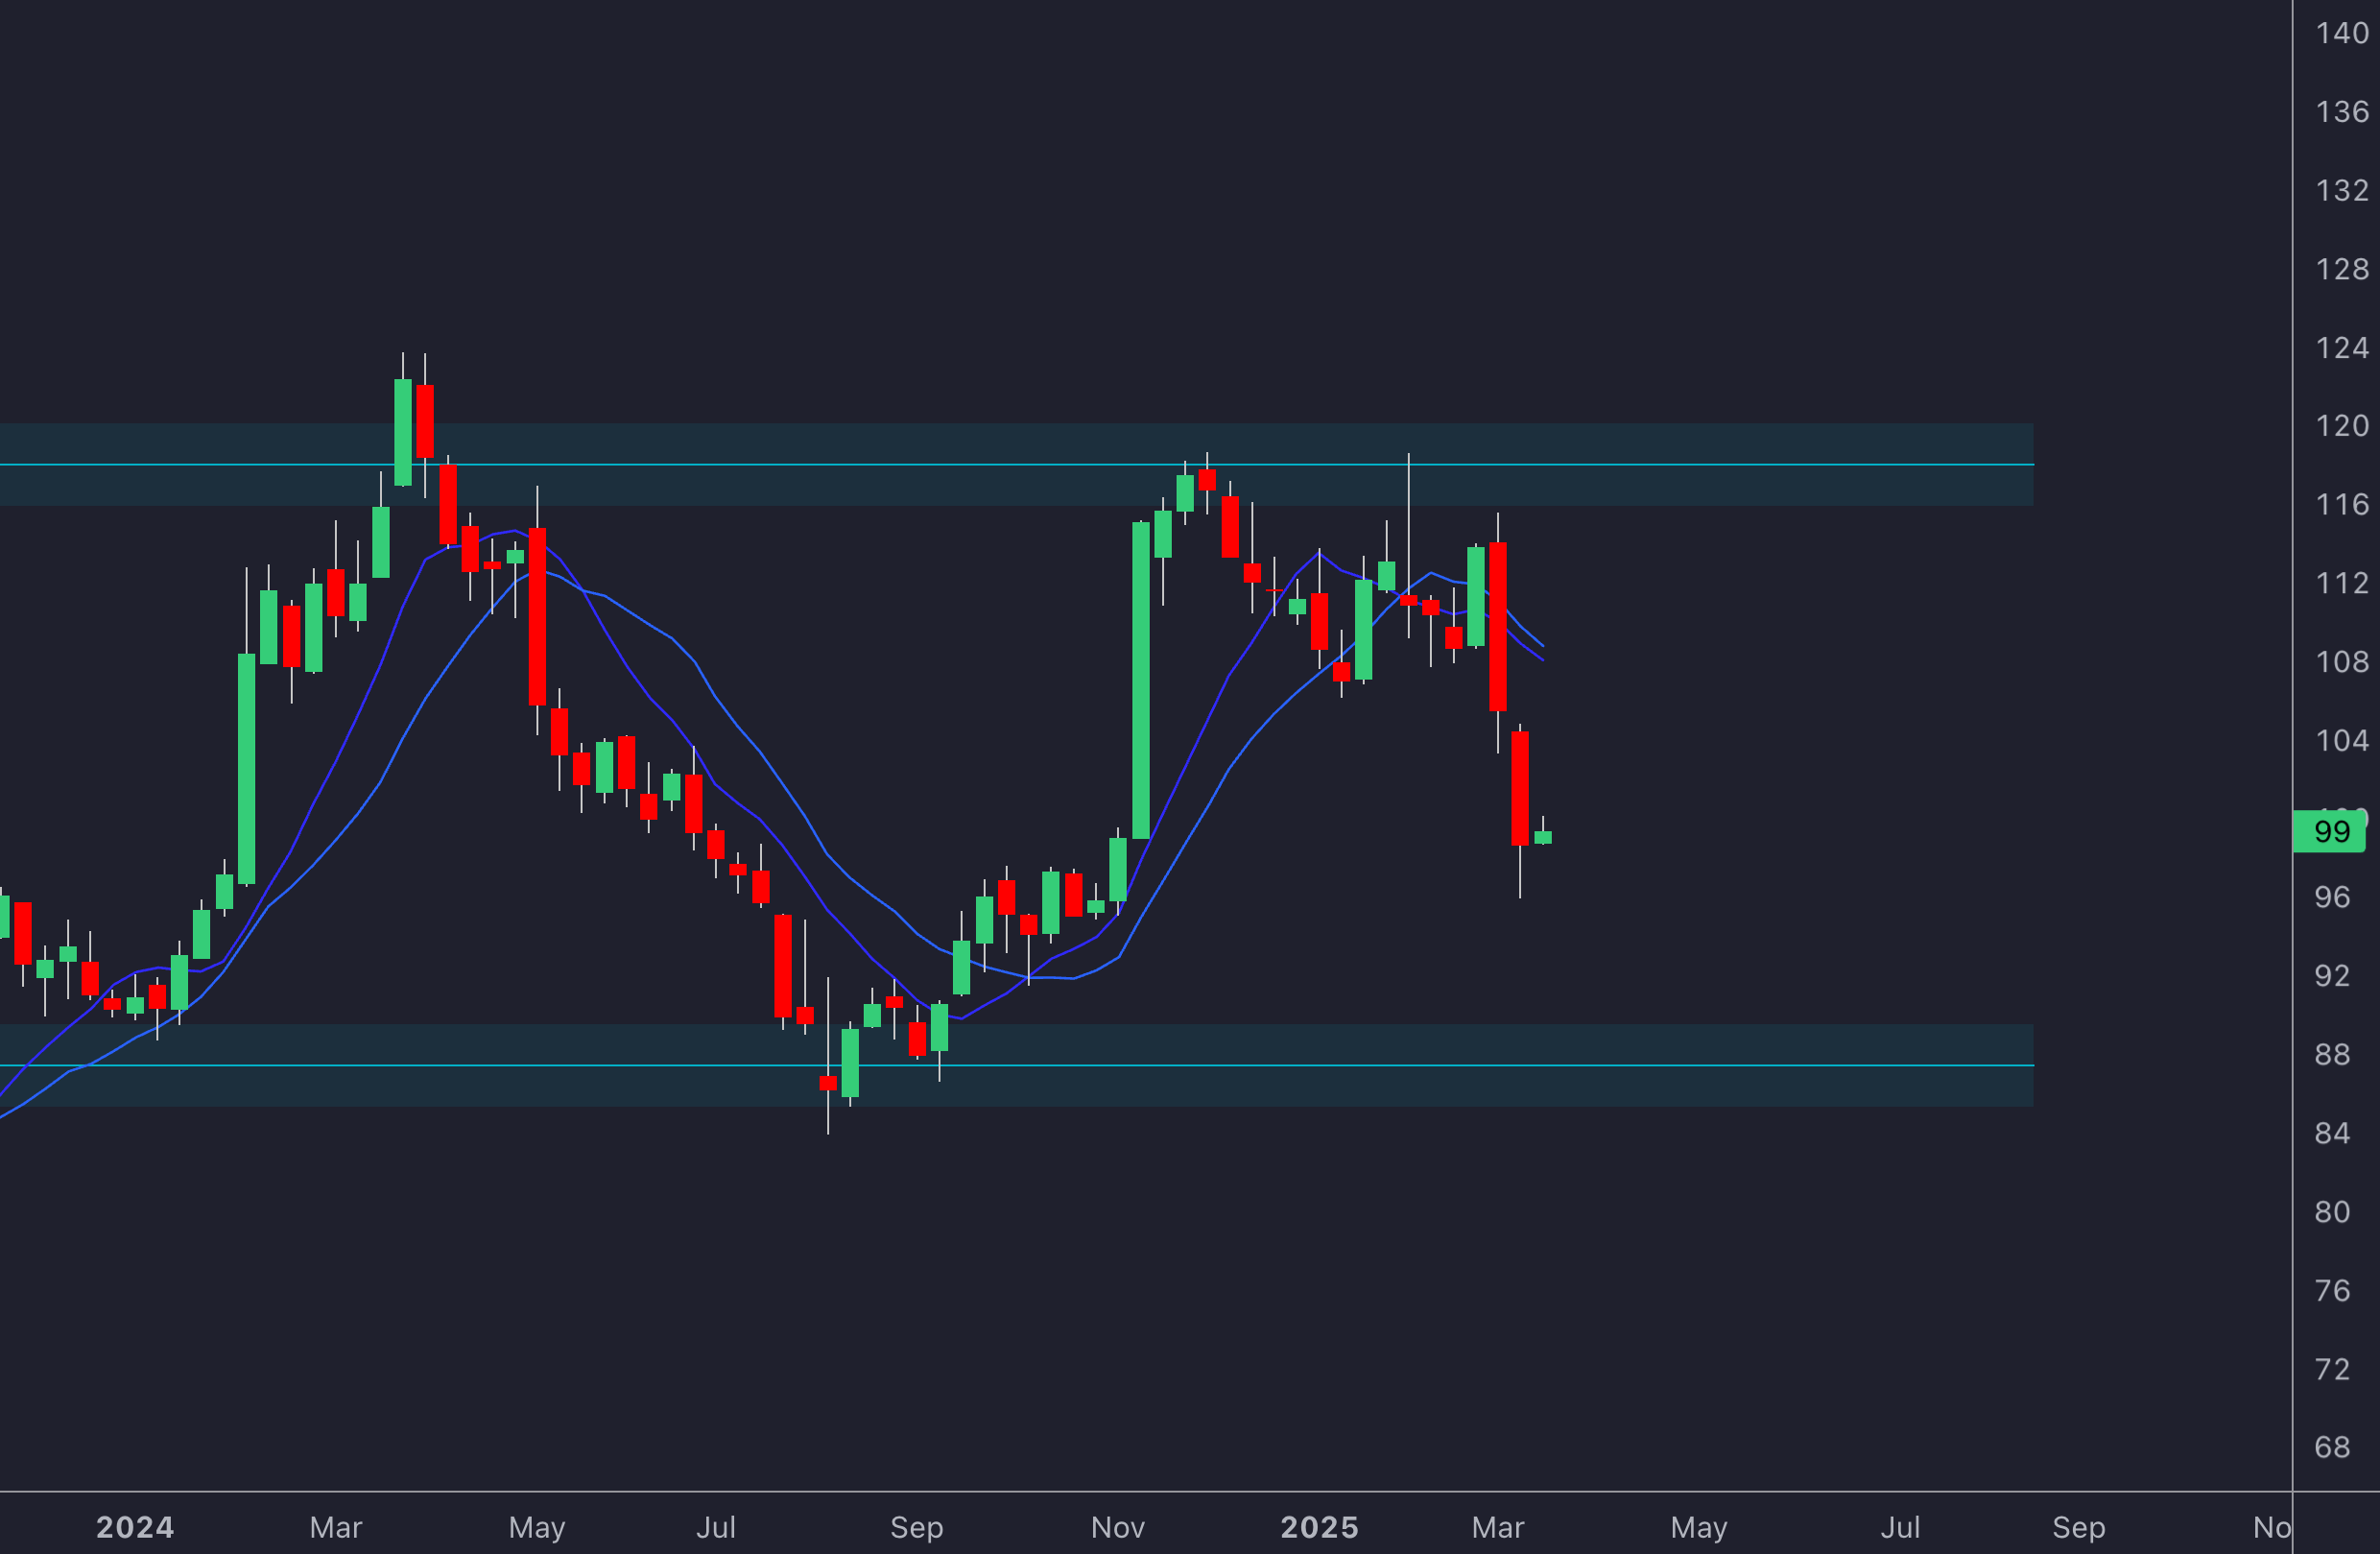
Two MA Crossover System
Using two moving averages helps to reduce market noise compared to single MA strategies. Traders often rely on these combinations for different timeframes:
- Intraday Trading: 9 and 21-period EMAs
- Swing Trading: 20 and 50-period SMAs
- Position Trading: 50 and 200-period SMAs
Before acting on a crossover, confirm the signal with price action or alignment across higher timeframes. This system becomes more effective when paired with the multiple timeframe method below.
Multiple Timeframe Crossovers
This method uses a layered approach, analyzing weekly (50/200 SMA), daily (20/50 EMA), and 4-hour (9/21 EMA) charts to minimize false signals. By aligning short-term trades with broader trends, traders can improve accuracy [4]. Adding momentum indicators like RSI can further validate trend strength, especially in trending markets.
Adding Indicators to Crossover Trades
Confirming Signals
To make crossover signals more reliable, traders often combine them with momentum indicators. For instance, MACD signal line crossovers that match up with moving average (MA) crossovers can significantly improve accuracy. Backtesting reveals this combination can increase win rates by 10-15% [1][3].
Here’s how RSI filters can help refine your strategy:
| Signal | RSI | Action |
|---|---|---|
| Bullish | Above 50, Rising | Suggests potential for an uptrend |
| Bearish | Below 50, Falling | Confirms a downtrend signal |
| Either | Above 70 or Below 30 | Signals possible reversals |
Support and Resistance with Crossovers
Crossover signals become more dependable when they occur near important support or resistance levels. Waiting for a price retest after a crossover can improve entry precision by up to 20% [4]. Adding volume analysis to the mix makes this strategy even stronger. Look for volume spikes - at least 150% of the 20-day average - during crossovers. This can enhance signal reliability by 40% across various markets [6][3]. When combined with multi-timeframe analysis, this method becomes even more robust.
Crossovers in Different Market Types
The effectiveness of MA combinations depends on the market environment:
| Market Type | Recommended MA Setup | Useful Confirmation Indicators |
|---|---|---|
| Trending | 50/200 SMA (Golden/Death Cross) | MACD + Volume |
| Ranging | 10/30 SMA | RSI + Support/Resistance |
| Volatile | 20/50 EMA | Volume + Price Action |
In trending markets, longer-period MAs help filter out noise, while shorter SMAs are better suited for range-bound conditions. For volatile markets, EMAs adapt more quickly to rapid price changes [2].
"Combining MA crossovers with RSI improved annual returns from 3.9% to 5.1% over a 12-year study of S&P 500 data" [3]
Setting Up Crossover Trading Systems
Chart Setup Guide
To get started, fine-tune your chart by choosing moving average (MA) periods that fit your trading style and timeframe. For guidance, refer to the MA combinations in the Two MA Crossover System. To enhance your analysis, include volume and momentum indicators below the main chart. These tools help confirm trading signals [3].
Signal Confirmation Steps
Before acting on crossovers, confirm them with these steps:
- Ensure a full candle closes beyond the MA.
- Look for a volume surge exceeding 150% of the 20-day average.
- Check momentum alignment using RSI or MACD indicators.
This layered confirmation works well alongside multi-timeframe analysis for added accuracy.
Trade Entry and Exit Rules
Enter trades only after signals are confirmed. Use stops based on 2x ATR (Average True Range) and trailing stops that follow the slower MA’s movement. Apply these confirmation steps consistently for every trade [2].
For managing risk, follow this sequence:
- Initial Stop: Place it at the recent swing low/high or 2x ATR.
- Trail Stops: Move stops to breakeven once the trade reaches a 2x risk-reward ratio.
- Profit Targets: Set targets based on support and resistance levels identified through multi-timeframe analysis.
This method aligns with proven strategies for handling volatility effectively [3][1].
Common Crossover Trading Mistakes
Even with advanced features designed to refine crossover strategies, traders can still make errors that affect the accuracy of entry and exit points. Avoiding these mistakes is crucial for success.
Tackling False Signals
False signals are a common issue in crossover strategies, especially in volatile markets. According to the Journal of Trading, an unfiltered 10/30 SMA crossover strategy on EUR/USD produced 37 false signals in six months, resulting in a 12% drawdown. Adding RSI filters reduced these false signals by 62%.
Here are ways to cut down on false signals:
- Use longer-term moving averages, like the 50-day and 200-day, in unpredictable markets.
- Wait for candle closes beyond the moving average before acting.
- Check trading volume to confirm the strength of a signal.
Dealing with Moving Average Lag
The lag inherent in moving averages can cause traders to miss opportunities. Addressing this requires a more nuanced approach:
| Solution | Method | Advantage |
|---|---|---|
| Multiple Timeframe Analysis | Combine signals from short and long-term MAs | Balances speed and reliability |
| Price Action Integration | Look for candlestick patterns near crossovers | Helps spot trend reversals earlier |
Avoiding Backtesting Errors
Poor backtesting practices can lead to unrealistic expectations about a strategy’s effectiveness. Studies show that relying only on in-sample data can inflate performance estimates by as much as 30% [2].
Key mistakes to avoid:
- Overfitting parameters to historical data.
- Using too little historical data.
- Overlooking transaction costs.
- Falling victim to survivorship bias.
For better backtesting results:
- Test strategies under varied market conditions.
- Factor in transaction costs and potential slippage.
- Use datasets that include delisted stocks.
- Validate results with out-of-sample testing.
Regularly revisiting and adjusting your strategy is essential to keep up with changing market dynamics. This aligns well with the capabilities of LuxAlgo’s AI Backtesting Assistant, which can help streamline these adjustments.
Conclusion
Main Points Review
Moving average crossovers are a useful tool for spotting trend shifts and identifying potential entry or exit points in the market. Combining different timeframes and adding confirmation methods often strengthens their signals. For example, the 50/200-day moving average crossover has shown reliable results in trending markets, especially when paired with volume confirmation [1][3].
These strategies work best when paired with the confirmation techniques and risk management principles discussed earlier.
Best Practices
To effectively implement crossover strategies, consider the following:
- Use confirmation tools like RSI or MACD for added reliability.
- Apply multi-timeframe analysis to get a clearer market picture.
- Stick to strict risk management rules, as outlined in Trade Entry/Exit Rules.
As highlighted in the Common Mistakes section, leveraging features such as LuxAlgo’s AI Backtesting Assistant can help avoid pitfalls like overfitting or survivorship bias. The insights shared within the trading community further support refining and validating your strategies.


