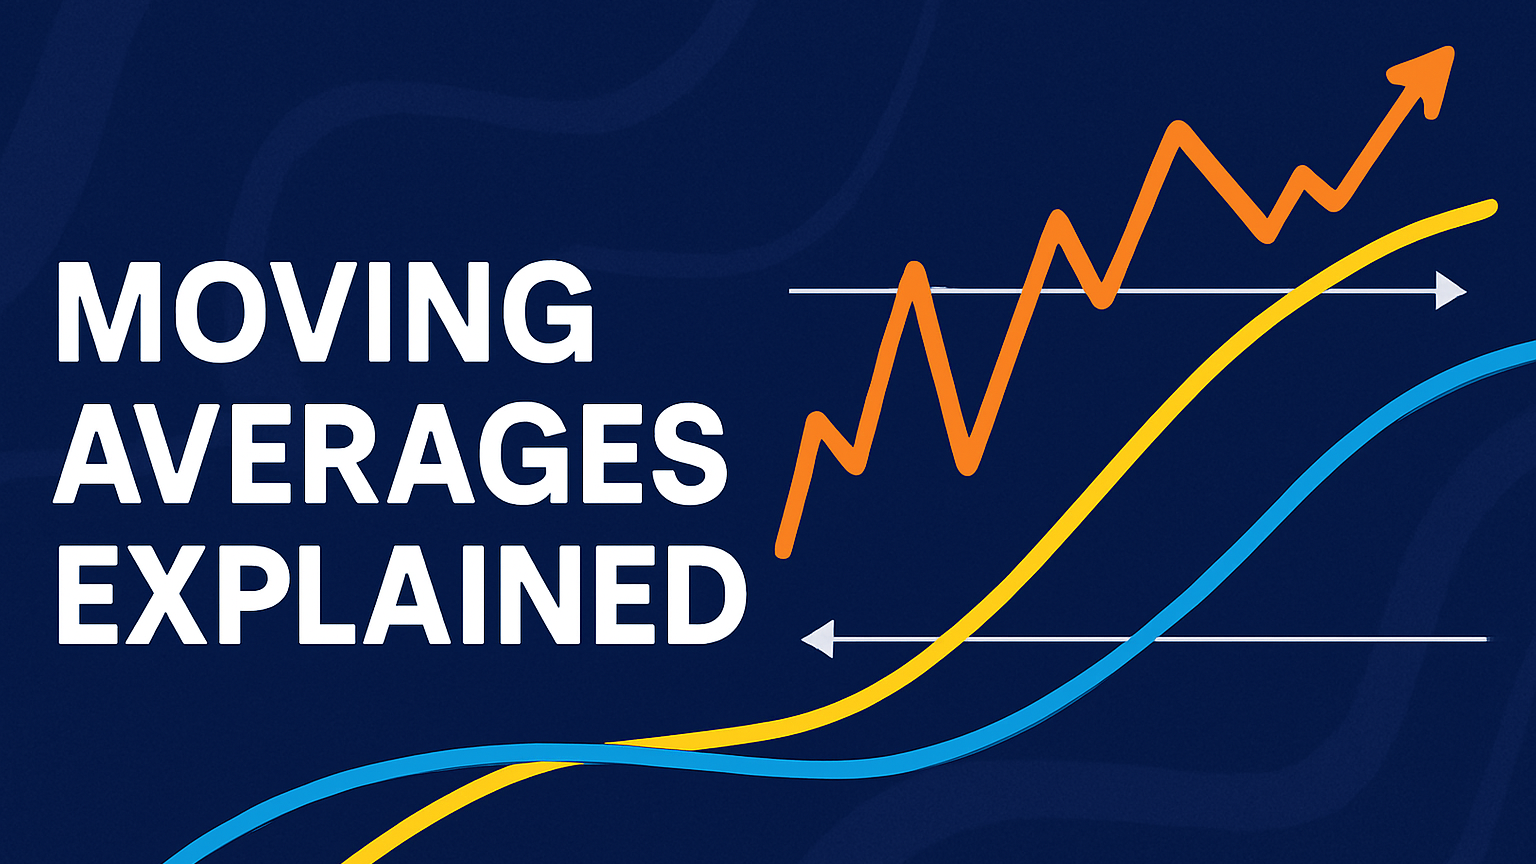
Explore the essential aspects of moving averages in trading, including types, strategies, and how to effectively analyze market trends.
Moving averages are a straightforward way to analyze market trends by smoothing out price data. They help traders identify trends, confirm momentum, and generate trading signals. Here’s a quick breakdown:
-
Types of Moving Averages:
- SMA: Equal weight to all data, best for long-term trends.
- EMA: Focuses on recent prices, ideal for short-term analysis.
- WMA: Custom weight distribution, used in specialized strategies.
-
Key Uses:
- Spot trends (rising = uptrend, falling = downtrend).
- Generate signals (e.g., price crossing above/below the average).
- Identify support and resistance levels.
-
Strategies:
- Golden Cross: Short-term average crosses above long-term (bullish).
- Death Cross: Short-term average crosses below long-term (bearish).
- Multi-MA Systems: Combine multiple averages for better accuracy.
-
SMA vs EMA:
- SMA is slower but stable, good for steady markets.
- EMA reacts quickly, better for volatile conditions.
Quick Comparison Table:
| Feature | SMA | EMA |
|---|---|---|
| Price Sensitivity | Lower (equal weight) | Higher (recent prices matter) |
| Best For | Long-term trends | Short-term trading |
| Signal Frequency | Fewer signals | More frequent signals |
| Market Suitability | Stable markets | Volatile markets |
To effectively use moving averages, pair them with other tools like RSI or MACD, choose the right timeframe for your goals, and always manage risk with stop-loss and profit-taking strategies.
Trading Up-Close: SMA vs EMA
Moving Average Calculations
Grasping how moving averages are calculated helps traders choose the right type and better interpret market signals.
SMA and EMA Formulas
The Simple Moving Average (SMA) is the average of a set number of prices. For example, to calculate a 5-day SMA, add the last 5 closing prices and divide by 5:
SMA = (Price₁ + Price₂ + … + Priceₙ) / n
The Exponential Moving Average (EMA), on the other hand, assigns more weight to recent prices, making it quicker to reflect price changes. Its formula is:
EMAt = [Vt × (s / (1 + d))] + EMAy × [1 − (s / (1 + d))]
Where:
- EMAt = today's EMA
- Vt = today's value
- EMAy = yesterday's EMA
- s = smoothing factor
- d = number of days
These formulas are essential for understanding how moving averages are used to interpret market trends, as explained below.
Reading Chart Signals
Price crossovers provide key trading signals:
- A price crossing above a moving average suggests bullish momentum.
- A price crossing below indicates bearish momentum.
To improve accuracy when acting on these signals, traders should:
- Wait for the candle to fully close after a crossover.
- Check trading volume to confirm the trend's strength.
- Place stop-loss orders just below the moving average for long positions.
- Set profit targets based on support and resistance levels.
Trend Analysis Methods
The length of the moving average period impacts its sensitivity and reliability:
| Period Length | Best For | Common Use |
|---|---|---|
| 10–20 days | Short-term trading | Capturing quick trend shifts |
| 50 days | Medium-term analysis | Identifying intermediate support/resistance |
| 200 days | Long-term investing | Spotting major trends |
Strike.money’s multi-timeframe EMA analysis (10–200 days) is a useful tool for pinpointing critical crossover levels.
Shorter moving averages respond faster to price changes but can produce more false signals. In contrast, longer periods give more reliable trends but lag behind price movements. Balancing these trade-offs is crucial for crafting effective trading strategies.
Trading Strategies
Traders rely on a variety of strategies based on moving averages and chart signals to navigate market trends effectively.
Golden and Death Crosses
Golden and Death Crosses are widely recognized technical patterns. A Golden Cross forms when a short-term moving average (like the 50-day) moves above a long-term moving average (such as the 200-day), signaling a potential bullish trend. On the other hand, a Death Cross occurs when the short-term moving average dips below the long-term one, hinting at bearish momentum.
Traders often buy during a Golden Cross and exit when the trend reverses. Similarly, they sell or short during a Death Cross, closing positions when the signals shift. Historical data suggests that markets tend to underperform during Death Cross periods, while Golden Crosses often align with periods of improvement. Beyond these basic patterns, more advanced systems have been designed to fine-tune entry and exit points.
Multi-Moving Average Systems
Multi-moving average (multi-MA) strategies have shown strong performance compared to simpler two-MA methods. A backtest of 20 trading pairs revealed that multi-MA strategies outperformed in 65% of cases, delivering 95% higher returns. For instance, between January 2022 and November 2022, a multi-MA approach on the ETH/USDT pair (3-hour timeframe) produced a net profit of 33.33%.
To apply multi-MA strategies effectively, focus on higher timeframes like 4–6 hours. Use a combination of different moving average periods to filter out false signals, confirm trends with volume data, and analyze multiple timeframes for consistency. Moving averages can also highlight key support and resistance levels, further aiding decision-making.
Support and Resistance Levels
After a Golden Cross, the long-term moving average often acts as support, while following a Death Cross, it can serve as resistance. Pairing these signals with other technical indicators and maintaining disciplined risk management can improve outcomes. The success of multi-MA systems highlights the importance of using multiple factors to confirm trading decisions.
SMA vs EMA Analysis
Let's dive into the differences between Simple Moving Averages (SMAs) and Exponential Moving Averages (EMAs), building on the moving average strategies we've discussed.
Key Differences
SMAs calculate the average of prices by giving equal weight to all data points. EMAs, on the other hand, prioritize recent prices, which can highlight trend changes faster. For example, a 10-period EMA assigns an 18.18% weight to the most recent price, while a 20-period EMA reduces this to 9.52%. This weighting makes EMAs more responsive to price movements, often signaling potential shifts before SMAs.
Strengths and Weaknesses
Each type of moving average has its own strengths and limitations, depending on the market conditions and trading goals.
| Characteristic | SMA | EMA |
|---|---|---|
| Price Sensitivity | Lower – equal weight to all data | Higher – emphasizes recent prices |
| Signal Generation | Fewer false signals | More frequent signals |
| Market Conditions | Better for stable markets | Suited for volatile markets |
| Trend Analysis | Ideal for long-term trends | Better for short-term price movements |
SMAs are great for smoothing out market noise, making them ideal for identifying long-term trends. However, their slower reaction to price changes can lead to delayed signals in fast-moving markets. EMAs, with their faster response, are more suited to short-term trading but can produce false signals during periods of consolidation.
Choosing Between SMA and EMA
Deciding between SMAs and EMAs depends on your trading style and the market environment. If you're a short-term trader in a fast-moving market, EMAs are more responsive and can provide timely signals, making them useful for day trading and managing short-term positions. On the other hand, long-term investors and swing traders often prefer SMAs for their ability to smooth out price fluctuations and deliver reliable signals for sustained trends.
Some traders combine both indicators for a balanced approach. For example, pairing a shorter-period EMA with a longer-period SMA can help confirm trend changes while maintaining a balance between responsiveness and stability. This strategy complements other trading techniques by offering a clearer understanding of when to use each moving average type effectively.
Advanced Moving Average Methods
Building on earlier strategies, these approaches refine moving average analysis for more precise trade management.
Indicator Combinations
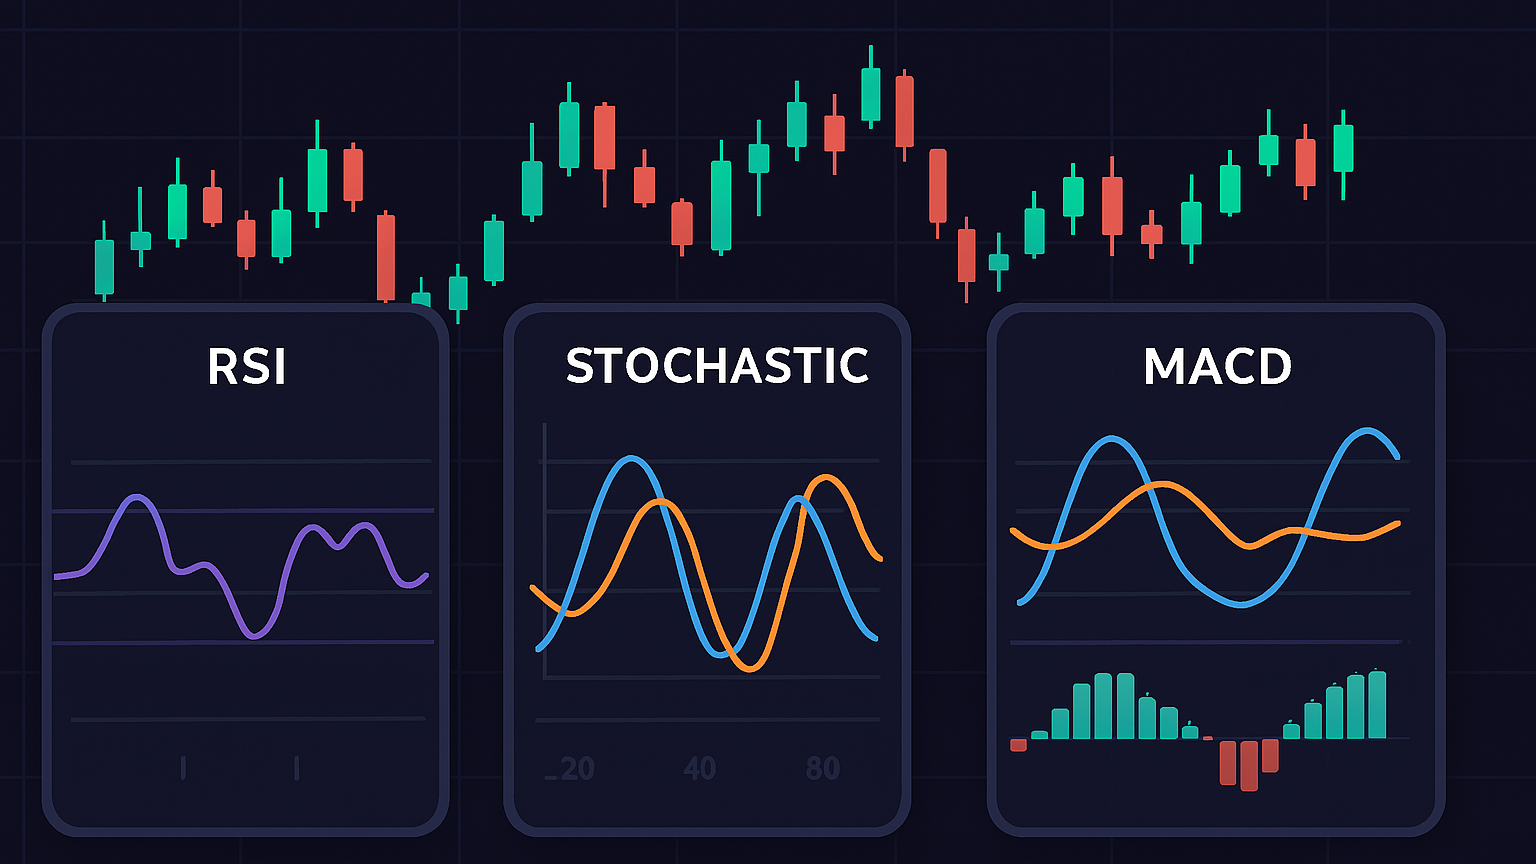
Combining moving averages with other indicators can improve signal reliability. For instance, the MACD (calculated by subtracting the 26-period EMA from the 12-period EMA) helps confirm trend strength when its signals align with moving averages. The RSI adds momentum insights, flagging overbought conditions with readings above 70 and oversold conditions below 30.
| Indicator Combination | Purpose | Signal Insights |
|---|---|---|
| MA + MACD | Confirms trends | MACD crossovers that match MA trends |
| MA + RSI | Validates momentum | RSI extremes aligning with MA levels |
| MA + ADX | Measures trend strength | ADX supporting MA trend signals |
Price Bands and Envelopes
Moving average envelopes create dynamic trading bands that help spot potential reversals. These bands typically use a 35- or 45-day moving average as the centerline, with upper and lower bands calculated by applying a percentage deviation - usually between 2% and 6%. These bands act as flexible support or resistance levels, signaling overbought or oversold conditions.
To use moving average envelopes:
- Calculate the centerline using a simple or exponential moving average.
- Determine the upper band: Moving Average + (Moving Average × Percentage).
- Determine the lower band: Moving Average − (Moving Average × Percentage).
Exit Point Strategies
Exit strategies are key to locking in profits and limiting losses. Moving averages can guide trade exits through methods like moving average-based trailing stops, which adjust stop-loss levels as the market moves favorably.
To fine-tune exits, use shorter moving average periods in stable markets and longer ones in volatile conditions, ensuring alignment with your risk-reward goals.
Conclusion
Key Advantages Recap
Moving averages are a reliable tool for spotting and confirming market trends. By smoothing out price fluctuations, they reveal the underlying direction of the market. They also help traders identify dynamic support and resistance levels, forming the backbone of many trading strategies.
Practical Tips for Use
To get the most out of moving averages, consider these tips:
- Choose the right timeframe: Align the moving average period with your trading goals. For example, short-term traders might use 10–20 days, while long-term traders often rely on 200-day averages.
- Combine with other tools: Use moving averages alongside momentum indicators or candlestick patterns. This can help confirm trends and filter out misleading signals.
- Focus on risk management: Always pair moving averages with strong stop-loss and profit-taking strategies. Research shows that 71% of retail CFD accounts lose money, highlighting the importance of managing risk effectively.


