Learn to identify false breakouts in trading using multi-timeframe analysis for improved accuracy and risk management.
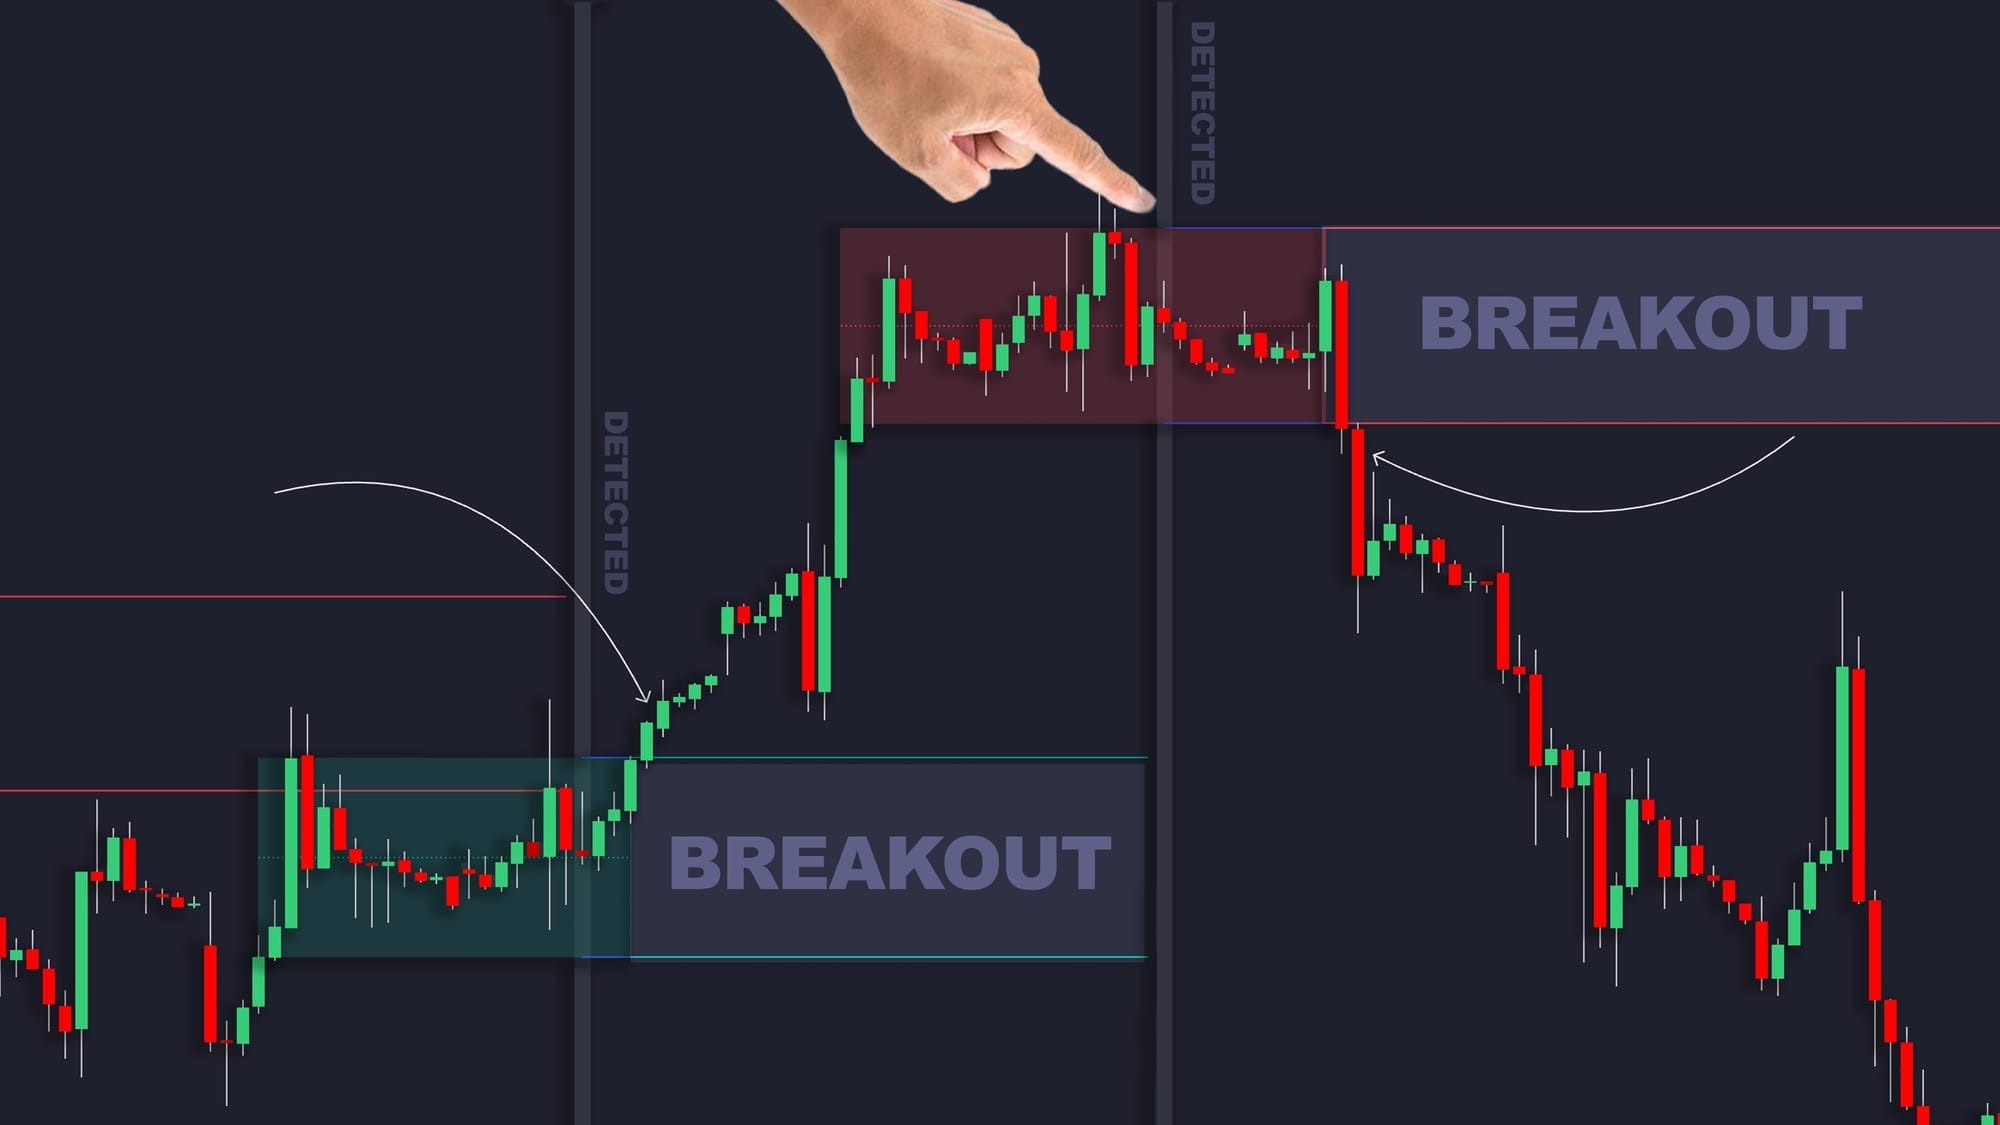
False breakouts occur when prices move beyond key levels briefly but reverse direction, catching traders off guard. A multi-timeframe analysis approach can help you identify these setups with greater accuracy. Here's a quick breakdown:
-
Key Timeframes:
- Daily: Spot major trends and key levels.
- 4-Hour: Confirm patterns and volume surges.
- 1-Hour: Pinpoint entry opportunities.
-
Tools You Can Use:
- LuxAlgo Library: Access hundreds of free trading indicators on TradingView that automatically identify support/resistance levels, volume disparities, and reversal patterns.
- Volume Analysis: Check for weak volume during breakouts to detect false moves.
- Technical Indicators: Use RSI, MACD, and Bollinger Bands for additional confirmation.
-
Steps to Build Your Strategy:
- Identify key levels on the daily chart.
- Confirm levels and patterns on the 4-hour chart.
- Use the 1-hour chart for precise entries.
-
Risk Management:
- Limit losses to 1-2% per trade.
- Use stop-loss orders and maintain a 1:2 risk-reward ratio.
This structured approach, combined with features from LuxAlgo, simplifies spotting false breakouts and improves your trading accuracy. Keep reading for detailed steps, testing methods, and tool recommendations.
Advanced Technical Analysis: False Breakout Traps
Creating Your Multi-Timeframe Strategy
To trade false breakouts effectively, you need a structured plan that blends higher timeframe analysis with accurate entry timing. Here's how to build a trading system that focuses on false breakouts while keeping risk under control.
Finding Support and Resistance Levels
Start by analyzing the daily chart to locate major support and resistance zones. These levels are crucial and act as the foundation for your trading decisions. For example, using the Multi-Timeframe Support/Resistance feature available through LuxAlgo can simplify this process, though you can always refine levels manually.
Here’s how to approach it:
- Primary Level Identification: Use the daily chart to mark key swing highs and lows[6].
- Level Confirmation: Switch to the 4-hour chart to confirm these levels and highlight areas of consolidation[5][2].
- Fine-Tuning: Drill down to the 1-hour chart to pinpoint exact entry opportunities within these zones[2].
Breakout Confirmation Rules
When trading breakouts, apply these timeframe-specific rules alongside the Breakout Sentiment Matrix feature provided by LuxAlgo for real-time alerts:
- Daily Chart: Look for 2-3 consecutive closes beyond a key level.
- 4-Hour Chart: Confirm with a noticeable surge in volume.
- 1-Hour Chart: Watch for clear candlestick patterns like engulfing bars or pin bars.
Spotting Reversal Signals
To identify reversals, pay close attention to price action patterns and technical indicators across multiple timeframes. Focus on the following:
Price Action Signals:
- Look for 1-hour pin bars and 4-hour double tops or bottoms forming near critical levels[2].
- Double tops or bottoms on the 4-hour chart are especially noteworthy[6].
Technical Confirmation:
- Check for RSI divergences on the 4-hour and 1-hour charts using the Divergence Scanner available through LuxAlgo.
- Use Bollinger Bands to spot reversal opportunities when the price touches or exceeds the bands[2].
- Analyze volume patterns across timeframes with the Volume Disparity Scanner provided by LuxAlgo[2].
LuxAlgo Trading Features
LuxAlgo offers a range of features that simplify breakout analysis. The Multi-Timeframe Breakout Detector evaluates breakout strength by analyzing volume and price action patterns across selected periods. Additionally, the Price Action Concepts (PAC) Toolkit automates price action analysis by identifying key support and resistance zones, trend lines, and common patterns to enhance your trading decisions.
Strategy Testing and Improvement
Once you've built your multi-timeframe strategy framework, it’s time to test it thoroughly to ensure it holds up under different conditions.
Historical Performance Testing
Evaluate your strategy's historical performance by reviewing over 200 trades across daily, 4-hour, and 1-hour charts. Make sure to establish clear rules for identifying levels and confirmation signals before diving into win rates and drawdowns [3].
Here’s what you’ll need to focus on:
- Data preparation: Collect clean historical data for daily, 4-hour, and 1-hour charts.
- Parameter definition: Clearly define rules for support/resistance levels, breakout confirmations, and entry/exit signals.
- Performance evaluation: Measure critical metrics like win rate, profit factor, and maximum drawdown.
Risk Control Guidelines
Managing risk effectively is essential to safeguard your trading capital, especially when dealing with false breakouts. Studies suggest that limiting losses to 1-2% of your account balance per trade can greatly improve your chances of long-term success [9].
Key risk management practices include:
- Using the daily chart’s ATR to size your positions.
- Placing stop-loss orders beyond daily support/resistance levels.
- Setting a 1:2 risk-reward ratio, targeting levels based on the daily chart.
- Limiting drawdowns to 2% per trade.
If you’re trading correlated assets, adjust your position sizes to avoid excessive exposure.
LuxAlgo AI Backtesting Assistant
For fine-tuning, consider using LuxAlgo’s AI Backtesting Assistant to optimize multi-timeframe parameters by running extensive scenario tests. This feature evaluates thousands of parameter combinations across daily, 4-hour, and 1-hour charts to identify the best settings for your strategy.
Summary
Using multi-timeframe analysis can lead to consistent trading results:
Success rates for multi-timeframe analysis range from 60-75% across various market conditions [5][2]. LuxAlgo users have reported identifying levels 22% faster. For instance, a recent CAD/JPY false breakout showcased a 300-pip reversal opportunity, identified through combined timeframe analysis [4]. The Volume Disparity Scanner flagged this setup four hours before the reversal, demonstrating the value of integrated timeframe analysis during low-volatility periods [10].
LuxAlgo Implementation Guide
To put your strategy into action, LuxAlgo’s exclusive features offer a structured approach:
- Price Action Concepts (PAC) Toolkit: Serves as the strategy's foundation.
- Signals & Overlays Toolkit: Adds layers of confirmation for more precise decision-making.
For best results, follow these steps:
- Map key levels across multiple timeframes using the Support/Resistance Toolkit.
- Confirm potential breakouts using volume analysis.
- Set up custom alerts to monitor setups in real-time.
- Fine-tune strategy parameters with AI-driven backtesting available through LuxAlgo’s platform.
AI optimization not only saves time but also ensures accuracy in your analysis. Automated alerts and systematic multi-timeframe validation help traders seize opportunities while maintaining disciplined risk management.
References
- LuxAlgo Homepage
- LuxAlgo Library: Support/Resistance Indicator
- Reversal Spotting Made Easy
- Fxtrendo: Fake Price Breakout
- TastyFX: What Is A False Breakout and How Can You Avoid It
- LuxAlgo Library: Candlestick Structure
- LuxAlgo Library: Market Structure Volume Distribution
- IG: Relative Volume Indicator
- LuxAlgo Library: Volume Profile Maps
- LuxAlgo Blog: Understanding RSI
- LuxAlgo Library: Ultimate RSI
- FTMO: Smart Money Concepts
- LuxAlgo Docs: Reversal Patterns Indicator
- LuxAlgo Docs: Backtesters Alerts
- LuxAlgo Blog: Backtesting AI Chat Breakdown
- TioMarkets: False Breakout
- TradeThatSwing: False Breakouts – Key Trading Opportunities
- VisionFactory: How to Avoid False Breakouts