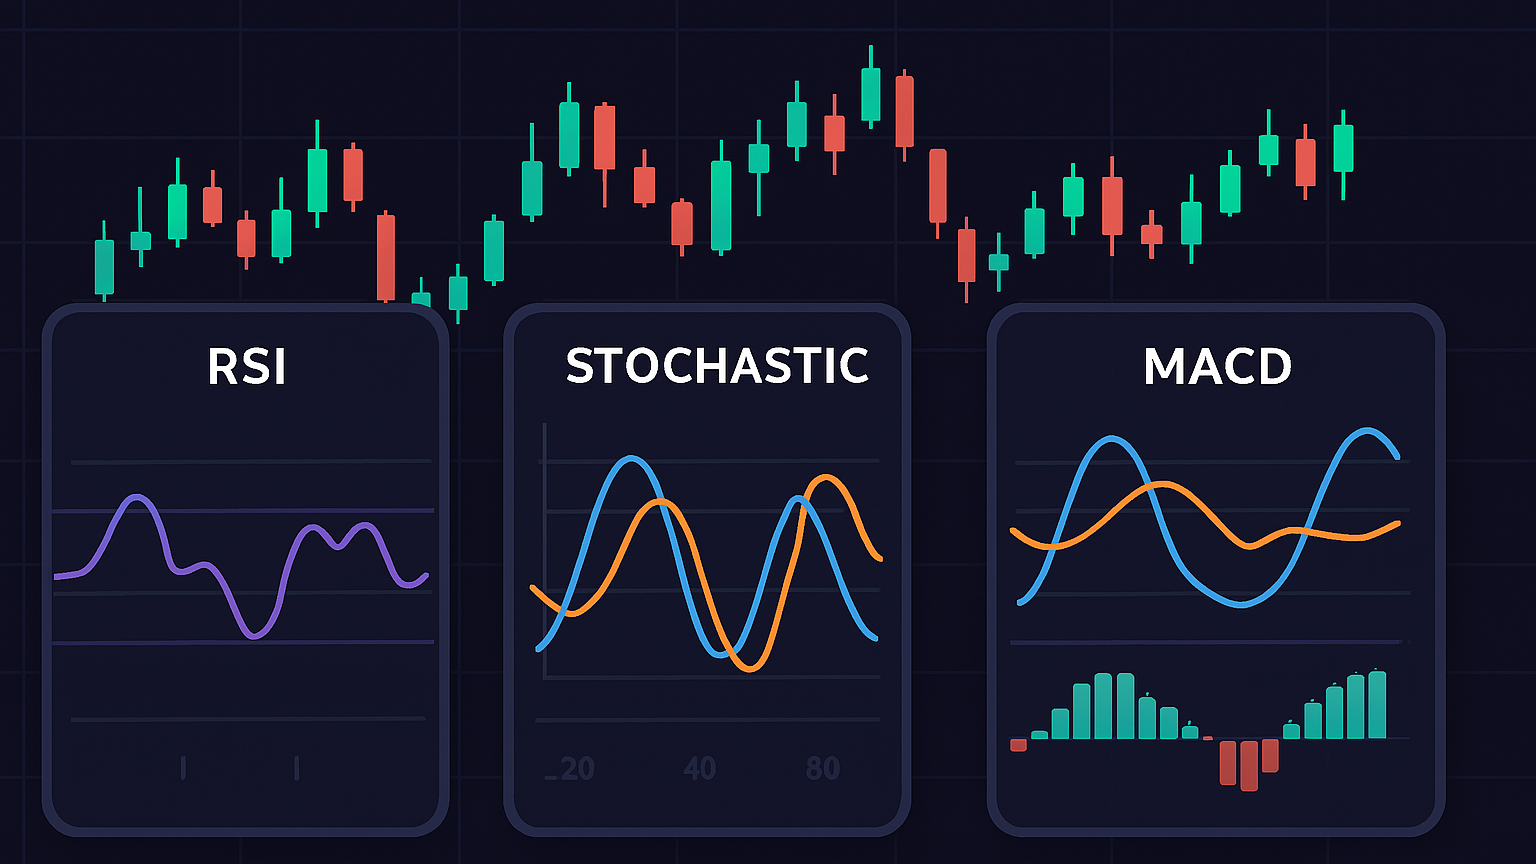
Learn how to effectively use oscillators like RSI, MACD, and Stochastic to identify market momentum and improve trading strategies.
Oscillators are essential for traders to identify market momentum and potential reversals. They work by highlighting overbought and oversold conditions, making them particularly effective in sideways markets. Unlike trend indicators, oscillators are bounded within a range (e.g., 0–100), offering early signals before price movements become evident.
Key Takeaways:
- Types of Oscillators: RSI, MACD, and Stochastic are the most commonly used.
- Best Use Cases: Sideways or range-bound markets, as they provide leading signals compared to lagging trend indicators.
- Advantages:
- RSI predicts reversals with ~70% accuracy at extreme levels.
- MACD highlights momentum changes with crossovers.
- Stochastic identifies overbought/oversold conditions using %K and %D lines.
- Common Mistakes: Misinterpreting signals in trending markets or ignoring volume.
Quick Comparison:
| Oscillator | Primary Use | Key Signals | Best Market Type |
|---|---|---|---|
| RSI | Momentum detection | Overbought (>70), Oversold (<30) | Sideways |
| MACD | Trend validation | Line crossovers, zero-line shifts | Trending |
| Stochastic | Price range evaluation | %K and %D crossovers, 80/20 levels | Range-bound |
Start by using a single oscillator like RSI or MACD, combine it with other complementary analysis methods (e.g., Bollinger Bands), and always prioritize risk management. Oscillators are powerful, but their effectiveness depends on market conditions and proper interpretation.
How to Actually Trade with RSI: The Real Way (Including MACD and Stochastic)
3 Main Trading Oscillators
RSI, MACD, and Stochastic are three key oscillators that traders rely on for identifying trading opportunities. Each approaches the analysis of price movements and momentum in its own way. Here's a closer look at how they work.
RSI: How It Works
The Relative Strength Index (RSI) tracks price momentum by comparing recent gains to losses, producing a value between 0 and 100. Traders often use 70 and 30 as default levels to spot overbought and oversold conditions.
However, these thresholds can be adjusted depending on the market:
| Market Condition | Suggested RSI Levels |
|---|---|
| Ranging Market | 70/30 |
| Strong Uptrend | 80/40 |
| Strong Downtrend | 60/20 |
A 14-period RSI is common for swing trading, while day traders may prefer shorter settings like 9–11 periods for quicker reactions. Divergences between price and RSI values can also hint at potential trend reversals.
MACD: Key Features
Unlike RSI, the MACD doesn’t use fixed levels for overbought or oversold conditions. Instead, it focuses on crossovers and interactions with the zero line to highlight momentum changes.

The standard MACD setup includes:
- MACD Line: The difference between the 12-period EMA and 26-period EMA.
- Signal Line: A 9-period EMA of the MACD line.
- Histogram: The gap between the MACD line and the signal line.
"Overbought/oversold signals suggest short term reversals in price, but do not guarantee them" – Shaun Murison, Senior Market Analyst
These components work together to help traders spot potential shifts in momentum.
Stochastic: Fast vs. Slow
The Stochastic oscillator measures a security's closing price relative to its range over a specific period. It uses two lines: %K (the faster line) and %D (a smoothed version of %K). Typically, values above 80 indicate overbought conditions, while values below 20 signal oversold conditions.

- Fast Stochastic: Reacts quickly to price changes, ideal for short-term trades.
- Slow Stochastic: Smooths out fluctuations, reducing false signals for longer-term strategies.
For a combined approach, some traders use RSI with Stochastic. For example, on a 4-hour chart, watch for RSI crossing the 50 centerline while monitoring 15-minute Stochastic signals. Go long when RSI moves above 50 and Stochastic exits oversold, or go short when RSI drops below 50 and Stochastic exits overbought.
Advanced Oscillator Methods
Advanced oscillator techniques go beyond the basics, offering refined strategies to improve trading accuracy. By building on core concepts, these methods help traders make better-informed decisions.
Using Multiple Timeframes
Analyzing multiple timeframes provides a broader market perspective, leading to more informed trading decisions. In fact, traders using this approach report a 17% higher success rate than those relying on a single timeframe.
| Timeframe Level | Purpose | Chart Period |
|---|---|---|
| Higher | Identifying Trend Direction | Weekly/Daily |
| Intermediate | Setting Up Trades | 4-hour/Daily |
| Lower | Fine-Tuning Entry/Exit Points | 1-hour/30-min |
For example, Bath & Body Works (BBWI) demonstrated bullish momentum across timeframes. A weekly 12-week SMA crossover was confirmed on the daily chart, and a 4-hour KST signal led to a 27% price rally. This highlights the value of aligning signals across multiple charts.
Combining Multiple Oscillators
Pairing oscillators with complementary analytical methods enhances the reliability of trading signals. For instance, combining RSI with moving averages increases signal accuracy by 12%, while using multiple oscillators together reduces false signals by 10%.
| Primary Indicator | Complementary Tool | Purpose |
|---|---|---|
| Stochastic | Volume Analysis | Assessing Price Strength |
| MACD | Support/Resistance Levels | Confirming Reversals |
| RSI | Candlestick Patterns | Timing Entries/Exits |
MACD crossover signals, for example, have been shown to predict market direction changes with 60% accuracy, especially in trending markets.
Common Oscillator Mistakes
While oscillators can be powerful, improper use can lead to errors. Avoiding these common mistakes can make a big difference:
| Market Type | Common Error | Solution |
|---|---|---|
| Trending | Fighting the Trend | Trade in the direction of the trend |
| Volatile | Using Incorrect Settings | Opt for longer periods (e.g., 34,13,13) |
| Range-bound | Ignoring Volume | Look for volume expansion at extremes |
For instance, Tesla (TSLA) showed bearish divergence but still rallied 22% due to strong momentum in the tech sector. This underscores the importance of considering broader market conditions. Similarly, Amazon (AMZN) experienced a bullish stochastic crossover at oversold levels, coupled with a 38% increase in volume, leading to an 18% price surge over 12 sessions. These examples highlight the need to interpret oscillator signals within a larger market context.
Building an Oscillator Trading Plan
To get the most out of oscillator indicators, it's crucial to establish clear, objective rules. This includes defining entry points, managing risk, and validating your overall strategy.
Creating Trading Rules
When developing your trading rules, focus on aligning technical signals with confirmation methods for better decision-making.
| Trading Component | Rule Example | Confirmation Required |
|---|---|---|
| Entry Signal | RSI below 30 or above 70 | Price action confirmation |
| Trend Alignment | Higher timeframe direction | Multiple timeframe analysis |
| Volume Requirement | Above 20-day average | Confirm with price-volume analysis |
For example, a TradingView analysis of Johnson & Johnson (JNJ) highlights a strategy combining stochastic signals with VWAP. In this approach, when the %K crosses above %D while both are below 20—and the price confirms above VWAP—the trade signals tend to be more reliable.
Setting Stops and Targets
Stops and targets should reflect current market conditions and key technical levels to maintain effective risk management.
| Market Condition | Stop Loss Placement | Take Profit Strategy |
|---|---|---|
| Trending | Below a recent swing low (for bullish setups) | At previous resistance levels |
| Ranging | Outside the price channel | Near channel boundaries |
| Volatile | Based on a multiple of ATR | Multiple target levels |
For instance, traders working with GBP/USD on an H4 timeframe often place stops below recent swing lows for bullish setups and above recent swing highs for bearish positions. This approach helps maintain discipline while setting realistic profit targets.
Testing Your Strategy
Before trading live, it's essential to thoroughly test and refine your strategy to ensure it performs well under various market conditions.
| Testing Phase | Purpose | Key Metrics |
|---|---|---|
| Initial Backtest | Strategy validation | Win rate, profit factor |
| Optimization | Parameter refinement | Risk-adjusted returns |
| Forward Testing | Real-market verification | Strategy robustness |
Backtesting provides insights into historical performance, allowing you to fine-tune parameters and improve the strategy. Once validated, integrate these approaches with reliable trading features to enhance execution in live markets.
Oscillator Software and Tools
Use these advanced features to fine-tune your oscillator trading strategy. Today's trading platforms come equipped with robust capabilities for oscillator analysis, helping you make more informed decisions. Below, you'll find key software options and features to bring oscillator-based trading to life.
LuxAlgo Oscillator Features

The Oscillator Matrix available on TradingView delivers a range of advanced features for detailed oscillator analysis. Key components include:
| Component | Key Features | Purpose |
|---|---|---|
| HyperWave | Real-time divergence detection | Spot potential trend reversals |
| Smart Money Flow | Volume-price analysis | Monitor institutional trading activity |
| Reversal Signals | Multi-timeframe confirmation | Confirm possible turning points |
| Confluence Detector | Cross-indicator validation | Minimize false signals |
Additionally, the Market Structure Oscillator analyzes market shifts across different timeframes, allowing traders to adjust weight distributions for more accurate signals.
Charting Software Options
Top charting platforms offer diverse oscillator capabilities. Here are some popular options:
| Platform | Oscillator Features | Capabilities |
|---|---|---|
| TradingView | Custom indicator creation, cloud-based | Real-time alerts, multi-timeframe analysis |
| MetaTrader 5 | MQL5 programming interface | Automated trading, extensive backtesting |
| NinjaTrader | C# based customization | Advanced order execution, market replay |
These platforms help translate market data into actionable insights. Whether you're a beginner or an experienced trader, they offer features to suit various trading styles. For even more flexibility, consider creating your own custom oscillators.
Building Custom Oscillators
Creating custom oscillators allows traders to adapt indicators to specific market conditions. The process involves:
| Phase | Tools Needed | Key Focus |
|---|---|---|
| Design | Technical analysis software | Define signal logic |
| Implementation | Programming interface | Ensure platform compatibility |
| Testing | Historical data | Validate performance |
For instance, TradingView’s Pine Script enables traders to tweak existing oscillators or design new ones, offering the flexibility to fine-tune entry and exit signals.
The success of oscillator-based trading depends on choosing platforms with robust testing capabilities and clear market insights.
Summary and Action Steps
Main Points Review
Oscillators help identify market momentum and potential reversals by highlighting overbought and oversold conditions.
| Oscillator Type | Use Case | Ideal Market Conditions |
|---|---|---|
| RSI | Momentum detection | Sideways markets |
| MACD | Trend validation | Trending markets |
| Stochastic | Price range evaluation | Range-bound markets |
Tim Bohen emphasizes that oscillators offer valuable insights into market behavior.
With this understanding, you can start incorporating oscillators into your trading routine.
Getting Started with Oscillators
Here’s how you can begin using oscillators in your trading strategy:
-
Choose Your Platform
Pick a charting platform with reliable oscillator features. For instance, TradingView combined with LuxAlgo's Oscillator Matrix offers real-time divergence detection and multi-timeframe confirmations. -
Start Simple
Focus on one oscillator, such as RSI or MACD, and learn its key signals:- RSI values above 70 often indicate overbought conditions.
- RSI values below 30 suggest oversold conditions.
- MACD crossovers can hint at momentum changes.
-
Prioritize Risk Management
Implement effective risk management strategies:- Position Sizing: Adjust your exposure based on your risk tolerance.
- Stop Loss: Set stop-loss orders that align with oscillator signals.
- Market Context: Combine oscillator signals with other analysis methods, like price action, for confirmation.


