
Learn how to effectively use the 200-day moving average to identify long-term trends and optimize your position trading strategy.
The 200-day moving average (200 MA) is a powerful metric for position traders looking to ride long-term trends. It smooths out short-term price noise, making it easier to identify bullish or bearish market phases. Here’s what you need to know:
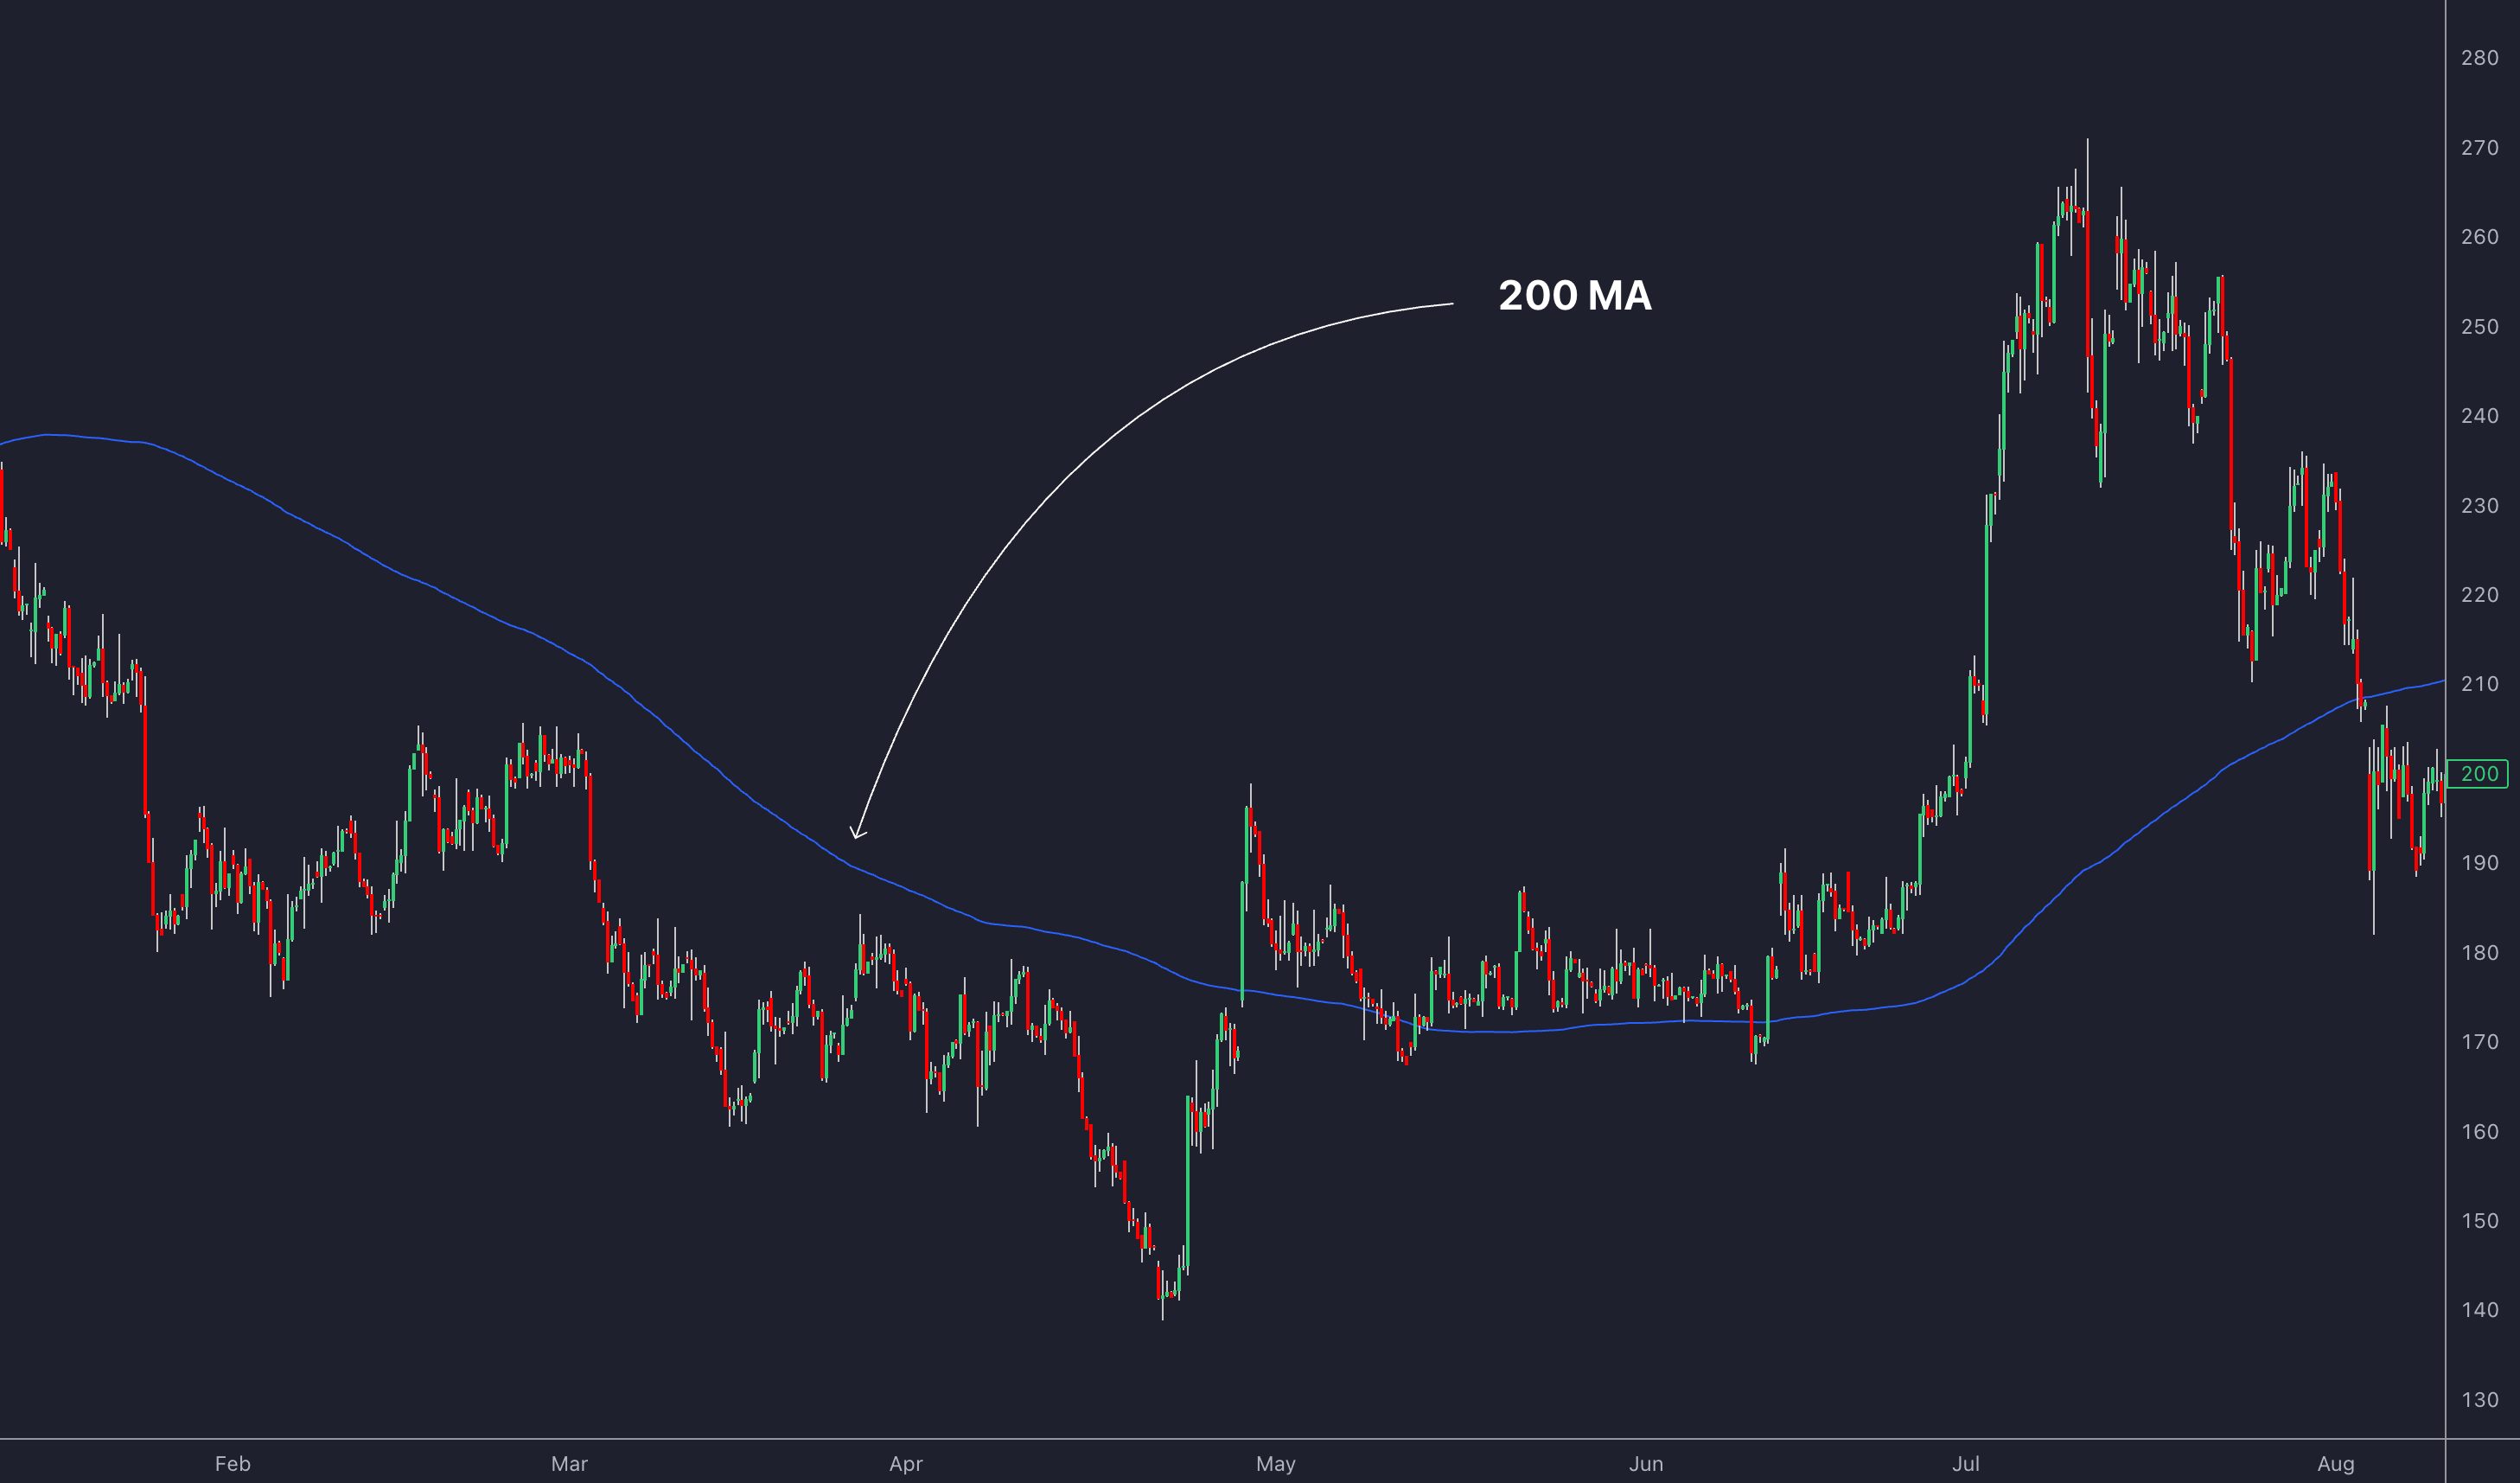
- What is it? The 200-day MA averages closing prices over the last 200 trading days to highlight long-term trends.
- How does it work? Prices above the 200 MA signal an uptrend, while prices below suggest a downtrend.
- Why use it? It helps identify trends, acts as dynamic support/resistance, and reduces market noise.
- Key strategies: Use golden/death crosses, pullback entries, and set stop-loss levels based on the 200 MA.
This indicator works best when paired with other measures like RSI, MACD, or volume analysis to confirm trends and reduce false signals. Platforms like LuxAlgo, which provides hundreds of free trading indicators along with exclusive features and an AI Backtesting platform, can enhance its effectiveness by offering advanced insights and alerts.
Quick Tip: Combine the 200 MA with risk management strategies to protect capital and maximize returns.
Understanding the 200-Day Moving Average
The 200-day moving average (200 MA) is a widely used metric for spotting long-term market trends. Its strength lies in offering clear trend signals while cutting through short-term market fluctuations.
Calculation and Definition
The 200 MA is calculated by taking the sum of an asset’s closing prices over the past 200 trading days and dividing it by 200. This 40-week period captures a broad range of price movements, providing a balanced view of market behavior.
| Component | Description |
|---|---|
| Time Period | 200 trading days (≈ 40 weeks) |
| Data Points | Daily closing prices |
| Calculation | Sum of closing prices ÷ 200 |
| Update Frequency | Daily (with each new closing price) |
Role in Technical Analysis
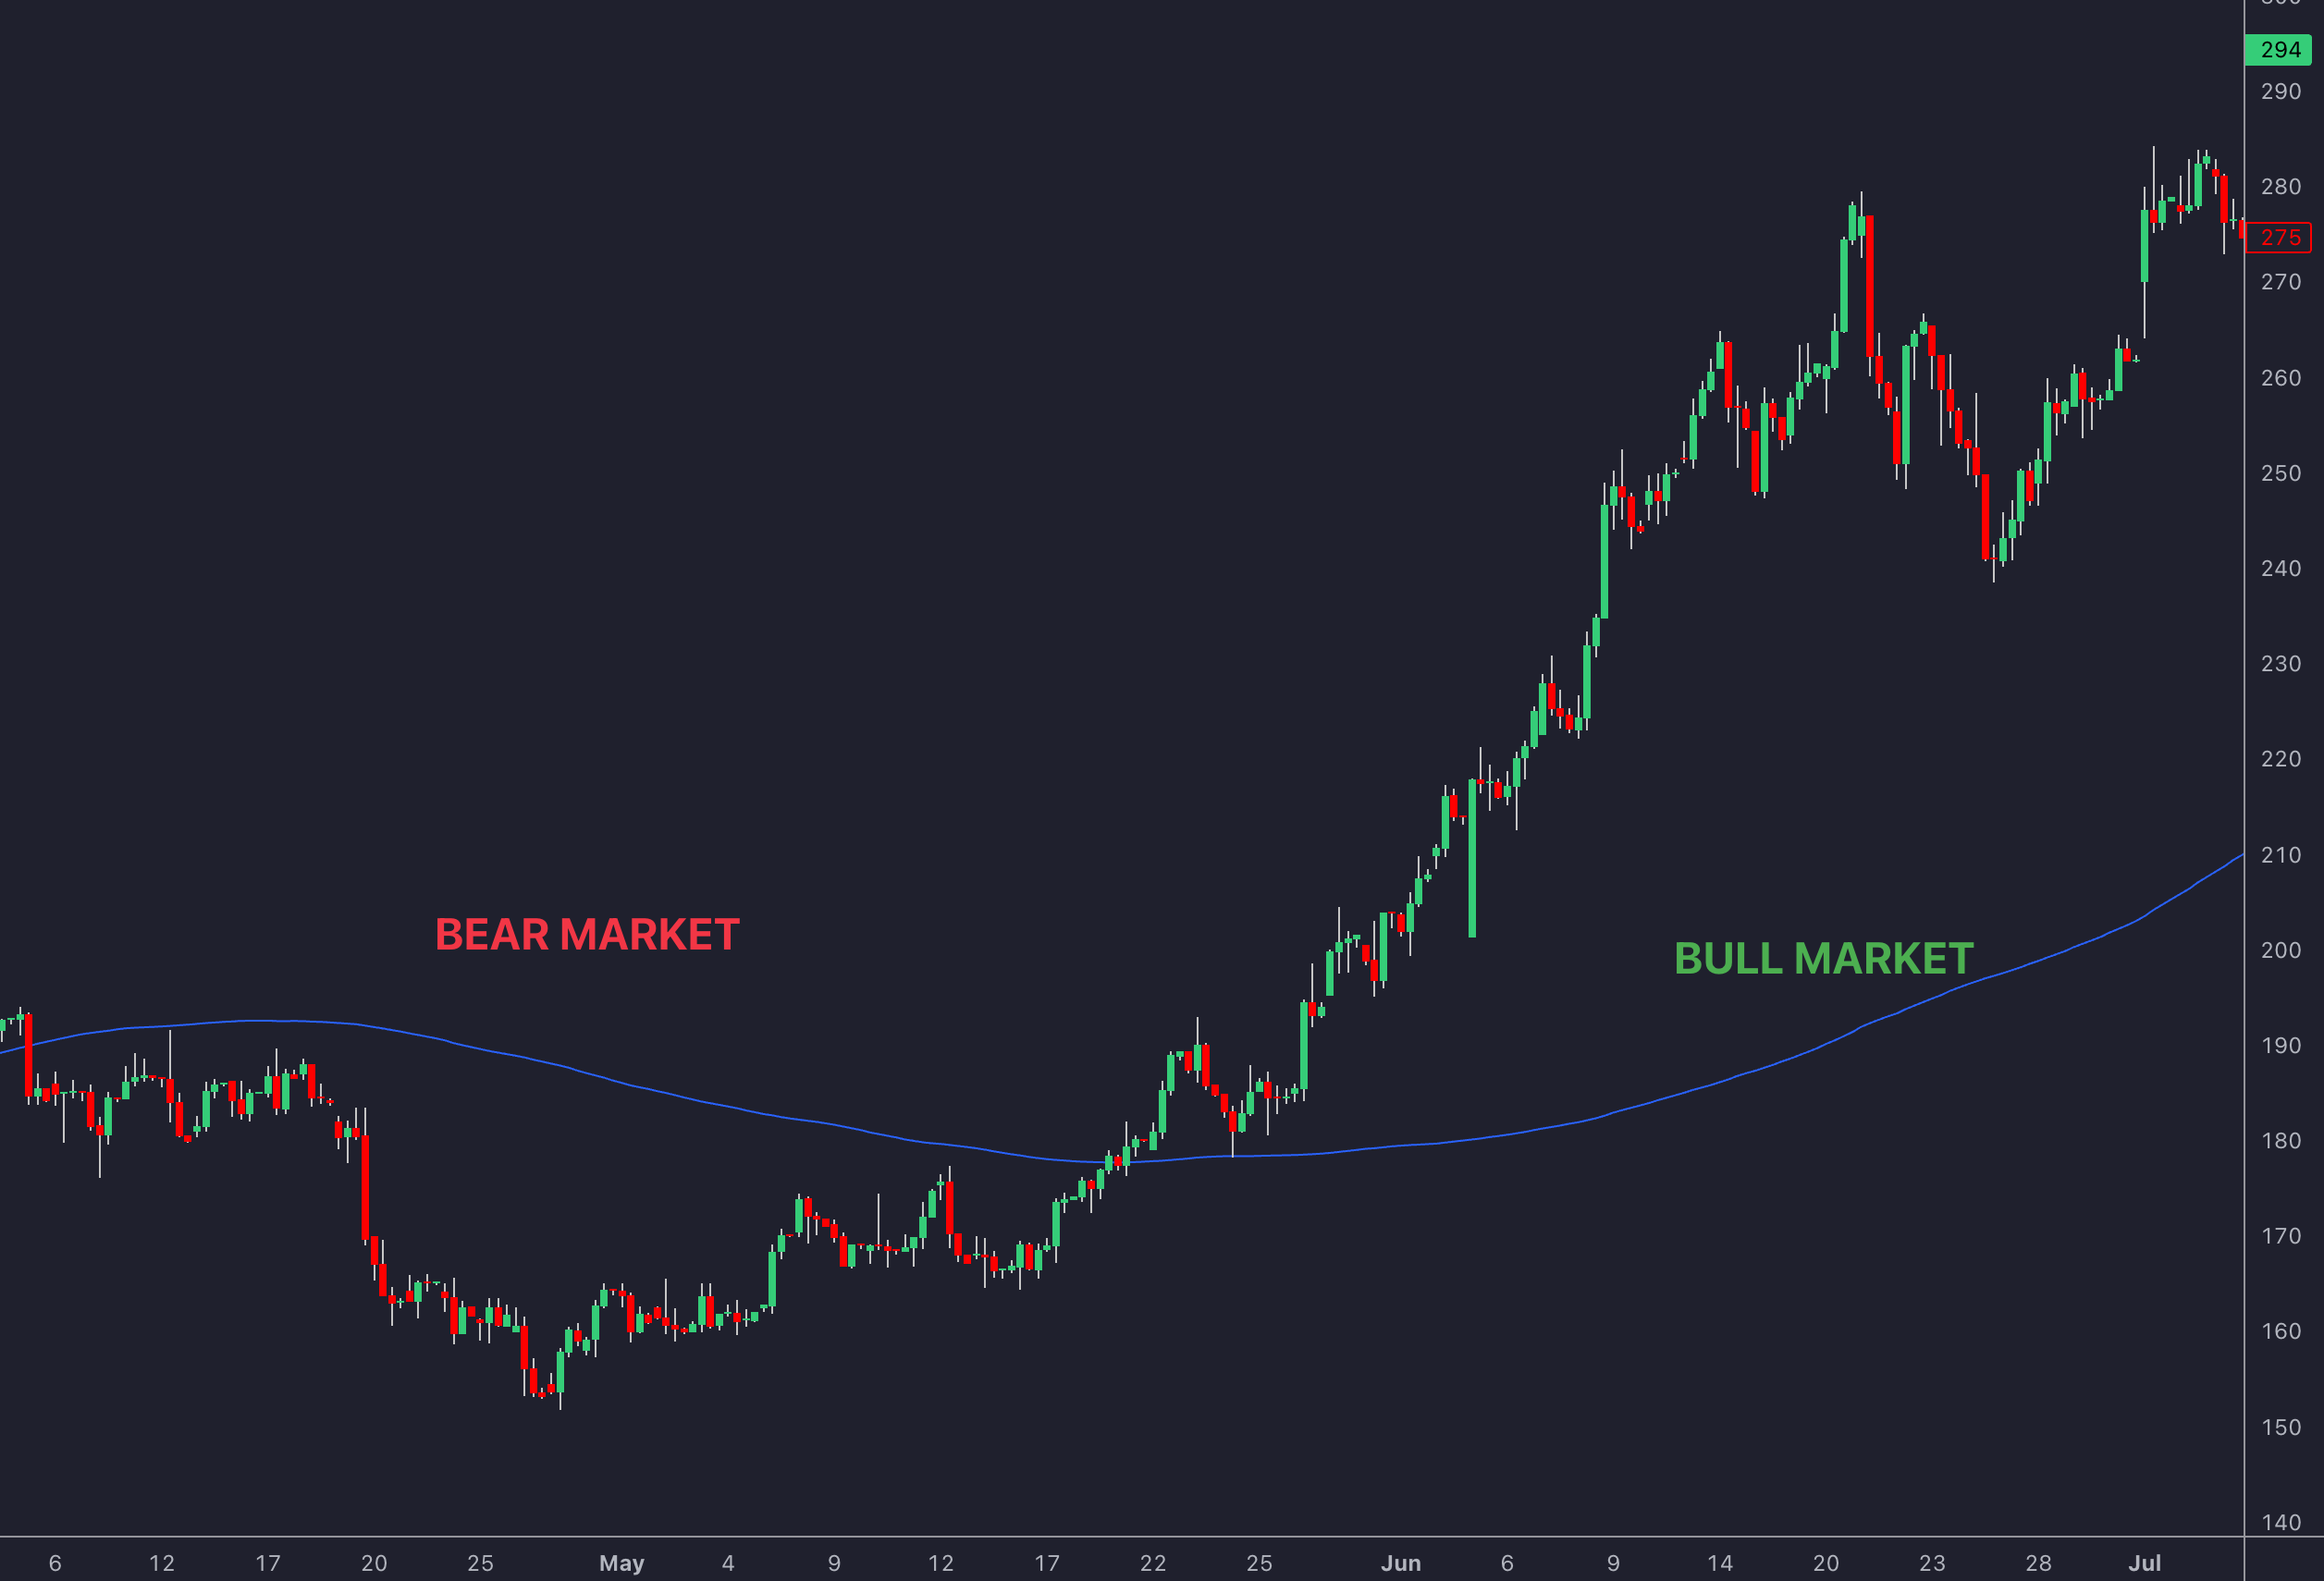
The 200-day moving average is a key metric in technical analysis, offering insights into market direction and identifying potential support or resistance levels. When prices stay above the 200 MA, it signals a bullish trend, while prices below it often point to bearish conditions. This aligns with the goal of position trading, which focuses on identifying trends that last for months.
"The 200-day moving average is one of the most widely followed technical indicators by institutional players. It's a line in the sand between long-term uptrends and downtrends."
Advantages and Limitations
While the 200-day moving average is a valuable metric, it’s not without its drawbacks. Here's a breakdown:
| Advantages | Limitations |
|---|---|
| Reduces market noise | Signals can lag significantly |
| Simplifies trend identification | Struggles in sideways markets |
| Acts as dynamic support/resistance | Prone to false signals (whipsaws) |
| Easy to calculate and understand | May not catch sharp reversals |
To get the most out of the 200 MA, consider pairing it with other measures like momentum indicators or LuxAlgo’s TradingView integrations. This combination can help confirm trends and reduce the impact of false signals.
Identifying Trends with the 200-Day Moving Average
The 200-day moving average is a key metric for position traders aiming to spot and act on long-term market trends. According to a study by Fidelity, the S&P 500 delivered an average annual return of 11.9% when trading above this moving average, compared to a -4.3% return when trading below it.
Bullish and Bearish Signals
The position of the price relative to the 200-day moving average helps determine the market's trend direction. Here's how these signals work:
| Signal Type | Price Action | What It Means |
|---|---|---|
| Bullish | Price above the 200-day MA | Indicates an uptrend; the greater the distance, the stronger the momentum |
| Bearish | Price below the 200-day MA | Signals a downtrend; more separation suggests a stronger trend |
| Consolidation | Price near the 200-day MA | Could indicate a potential trend reversal if this persists for a while |
Take Tesla's 2020 rally as an example: its stock stayed above the 200-day moving average while climbing from $200 to over $880 in just seven months.
Confirming Trends with Other Indicators
While the 200-day moving average is an excellent starting point, pairing it with other measures can help filter out false signals and improve confidence in trend analysis. Here are some to consider:
| Indicator | Role | How It Helps |
|---|---|---|
| RSI | Momentum check | Readings above 50 support an uptrend |
| MACD | Measures trend strength | Positive MACD values align with bullish signals |
| Volume | Confirms trade activity | High volume reinforces trend continuation |
| 50-day MA | Tracks short-term dynamics | Golden or Death crosses highlight major shifts |
For deeper analysis, traders can explore platforms like LuxAlgo. Its comprehensive offering—hundreds of free trading indicators along with exclusive features and an AI Backtesting platform—complements the 200-day moving average to provide a clearer picture of market trends.
Strategies for Entry and Exit Points
Building on trend identification methods, these strategies help fine-tune trade timing using the 200-day moving average.
Using Golden and Death Crosses
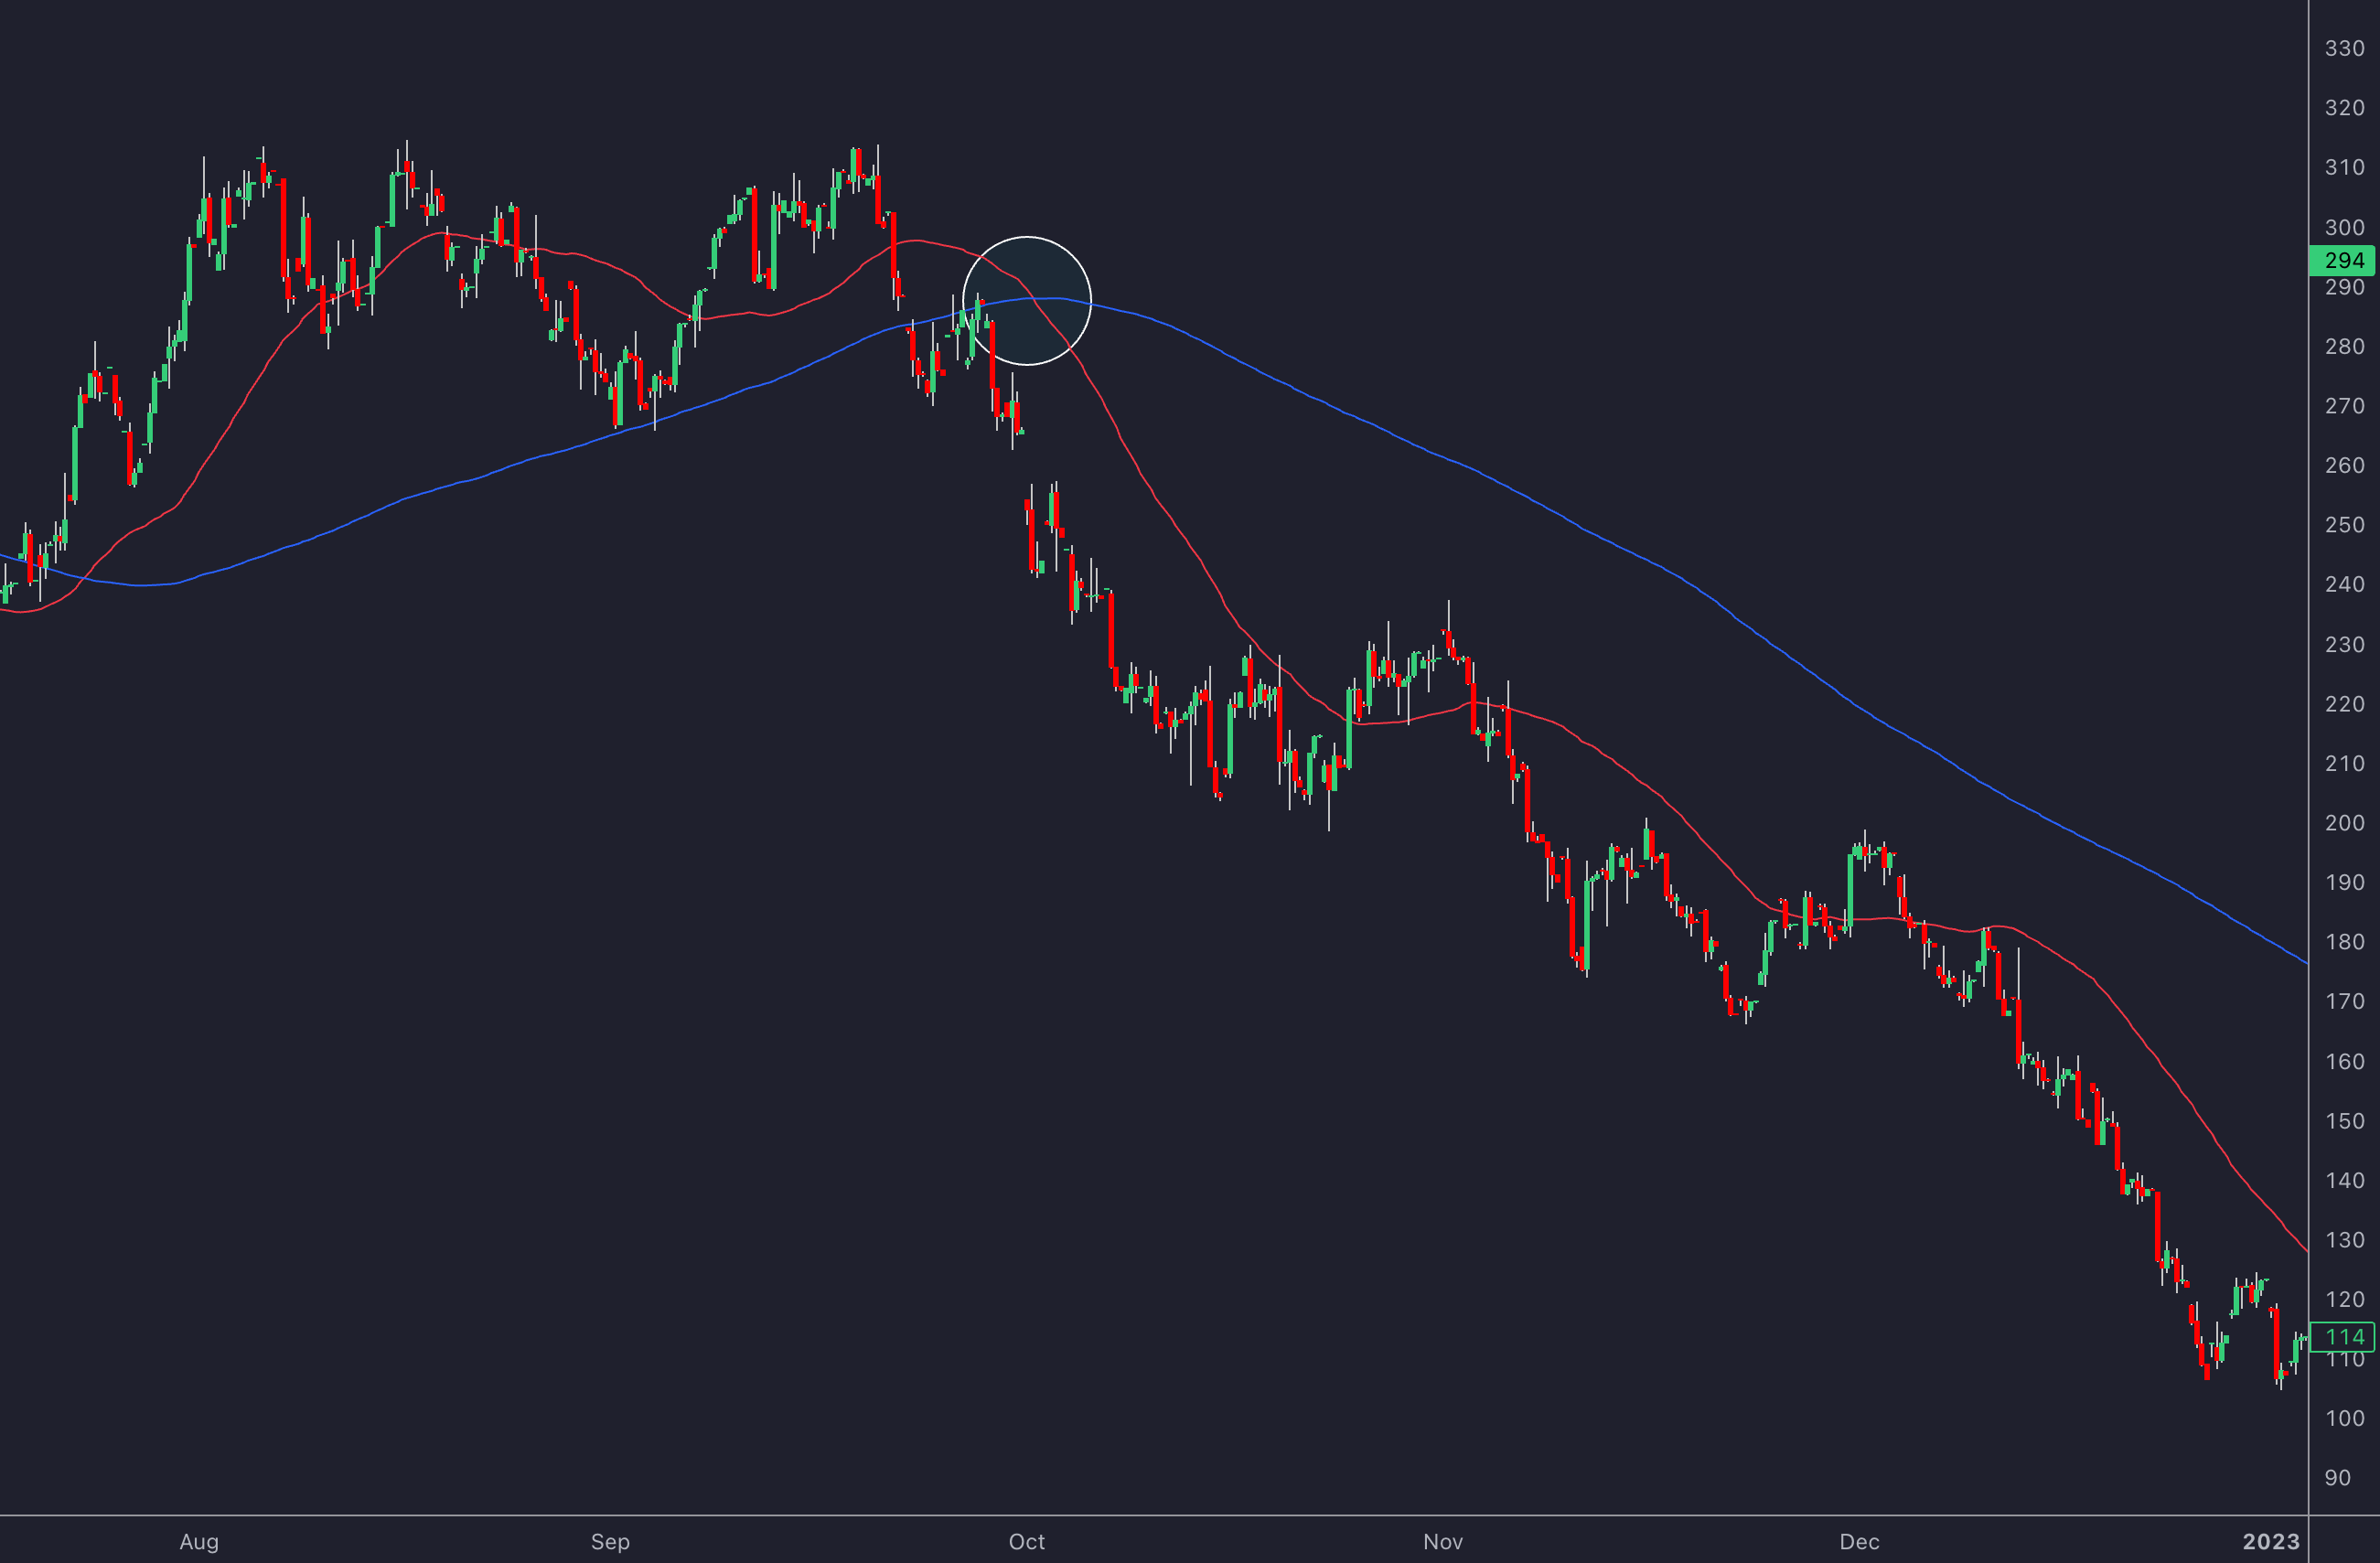
Golden and death crosses are key signals for position traders aiming to spot major trend changes. These occur when the 50-day moving average crosses the 200-day moving average.
| Cross Type | Signal Description | Suggested Action |
|---|---|---|
| Golden Cross | 50-day MA crosses above 200-day MA | Consider entering long positions |
| Death Cross | 50-day MA crosses below 200-day MA | Exit long positions or explore shorts |
| False Cross | Quick reversal after the cross | Wait 2-3 days for confirmation |
While these crosses highlight broader trend shifts, pullbacks to the 200-day MA provide more tactical entry points.
Identifying Pullback and Rejection Points
The 200-day moving average often serves as a dynamic support or resistance level. This creates chances to plan trade entries and exits:
- For confirmed uptrends, consider buying when the price rebounds off the 200-day MA, especially if supported by strong volume.
- For downtrends, be cautious and exit trades if the price closes consistently below the 200-day MA.
Setting Stop-Loss Levels
Managing risk is key, and setting stop-loss levels correctly can protect your capital. Keep position sizes limited to 1-2% of your total trading capital to minimize losses.
| Trade Type | Stop-Loss Placement | Adjustments |
|---|---|---|
| Long Positions | 2-3% below the 200-day MA | Adjust upward as the MA rises |
| Volatile Markets | 5-7% below the 200-day MA | Use ATR (Average True Range) for spacing |
| Trending Markets | Below recent swing low | Maintain at least 2% distance from MA |
Using Tools to Improve Trading
Advanced features, such as those provided by LuxAlgo, bring a new level of precision to 200-day moving average strategies by using AI to identify patterns and trends.
Overview of LuxAlgo Library for Moving Averages
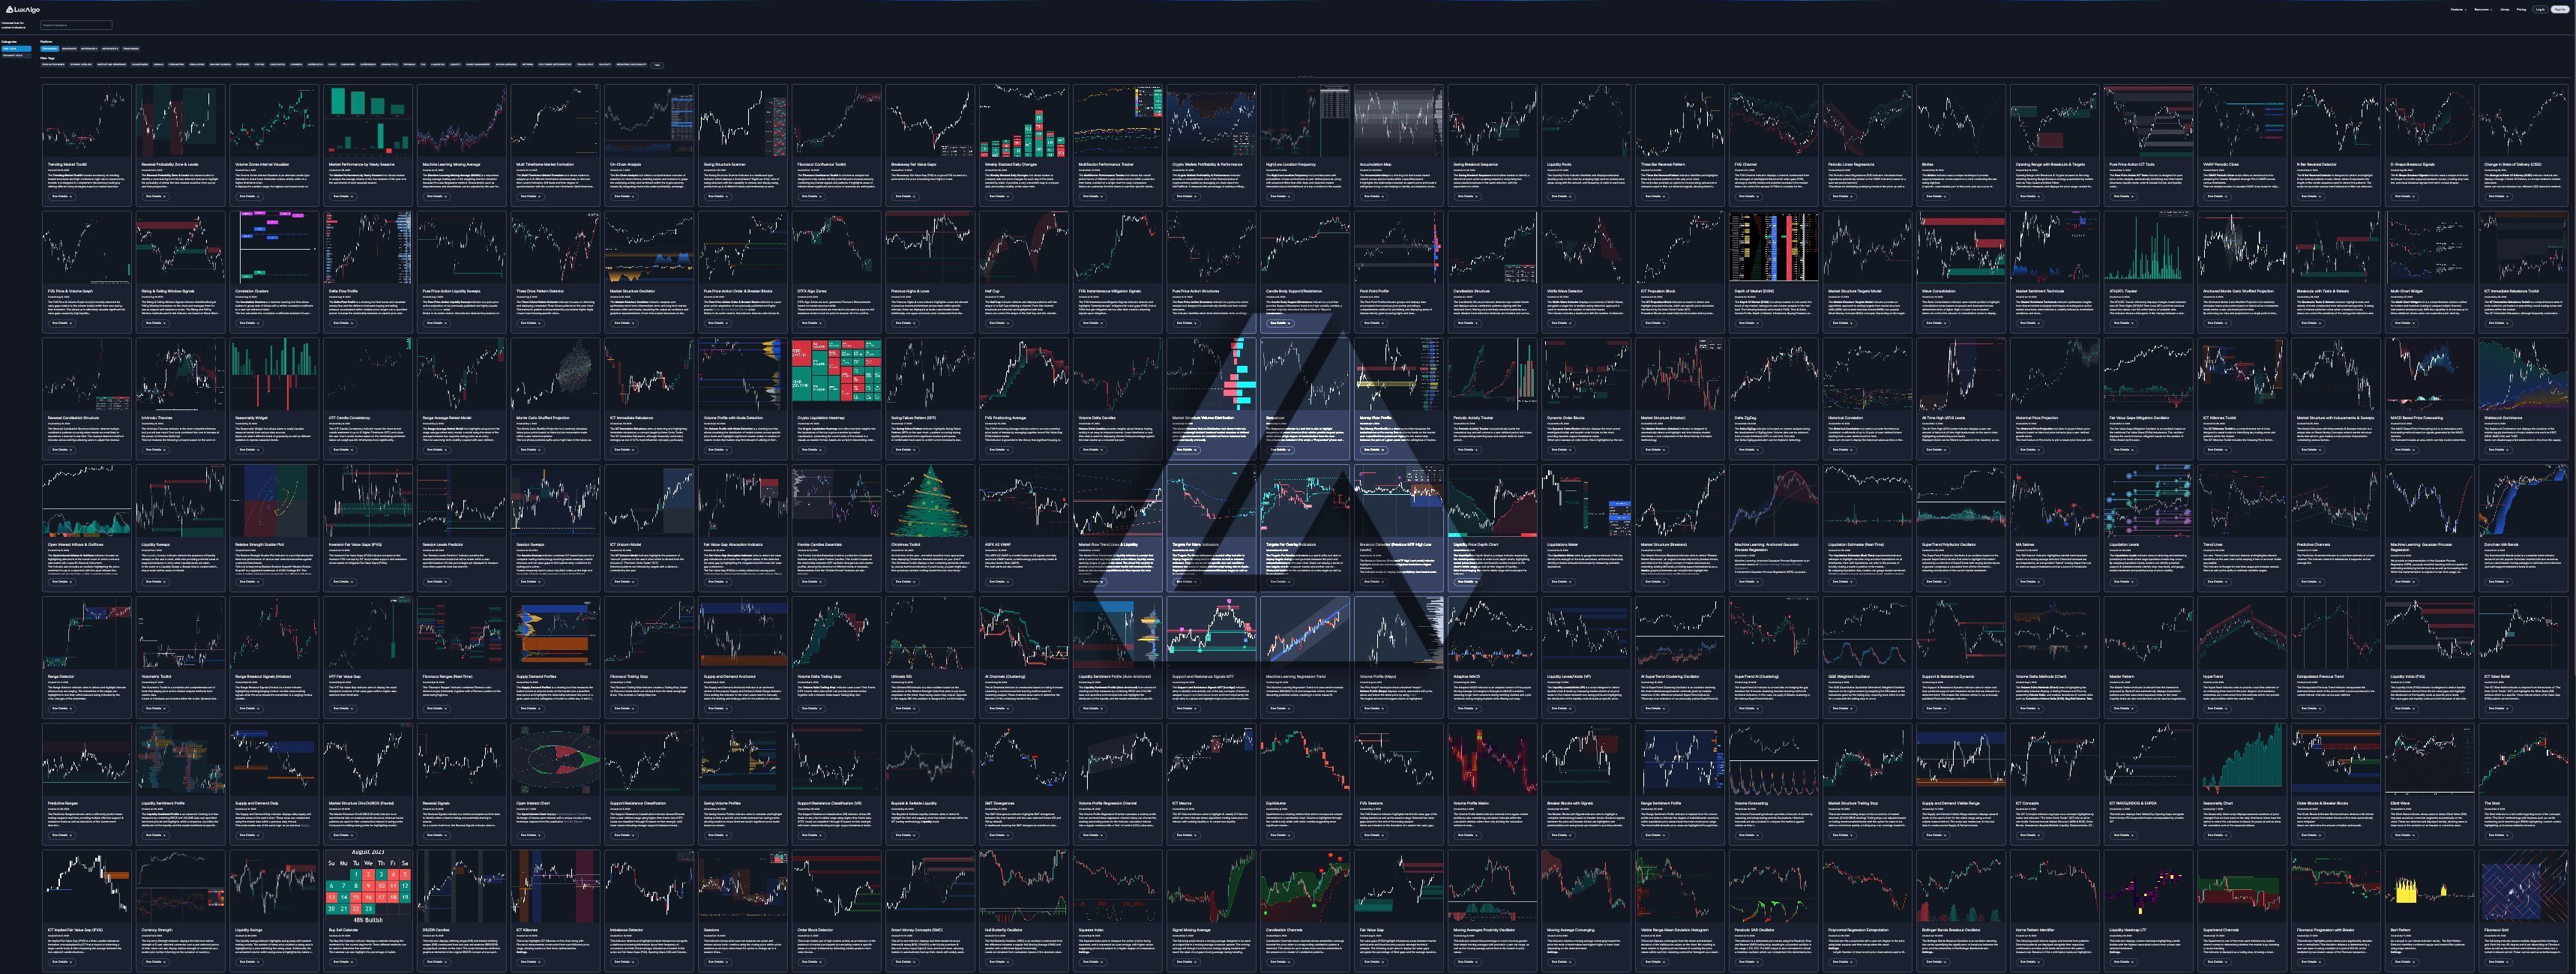
The LuxAlgo Library offers a comprehensive suite of free trading indicators specifically designed to enhance moving average strategies. These free tools include refined versions of traditional moving average indicators, dynamic support/resistance models, and advanced overlays—all aimed at providing improved accuracy and deeper market insights.
- Enhanced Moving Average Indicators: Updated versions of classic moving average tools that provide clearer trend signals.
- Dynamic Support & Resistance Models: Automatically adapt to price fluctuations, offering better-defined support and resistance levels.
- Advanced Chart Overlays: Integrate with other indicators for multi-dimensional analysis of moving averages.
- Custom Alerts & Signal Generators: Set alerts for key moving average crossovers and trend confirmations.
These free tools are part of the extensive offerings available in the LuxAlgo Library, providing traders of all levels with improved, cost-free solutions to traditional moving average analysis.
Using LuxAlgo with TradingView

LuxAlgo integrates seamlessly with TradingView, building on basic MA charting capabilities. This integration allows traders to:
- Analyze Multiple Timeframes: Track MA trends across various time horizons in one view.
- Overlay Custom Indicators: Add unique LuxAlgo indicators to the 200-day MA for deeper insights.
- Access Advanced Charting Tools: Spot critical technical levels around the moving average.
- Set Real-Time Alerts: Get notified of MA price interactions that align with historical reversal patterns.
Advantages for Position Traders
Position traders who combine LuxAlgo’s offerings with the 200-day MA can achieve better results by refining their analysis. For example, LuxAlgo’s AI Backtesting platform helps identify ideal entry points near the 200-day MA during pullbacks by analyzing historical patterns. Additionally, its volatility features assist in setting precise stop-loss levels, factoring in market conditions and volatility trends. These capabilities align with the entry, exit, and risk management strategies discussed earlier.
Case Studies and Historical Data
Performance in Different Markets
Looking at historical data, the 200-day moving average strategy shows varying outcomes depending on the market. For instance, an analysis of the S&P 500 from 2010 to 2020 revealed an average annual return of 9.5% using this strategy, compared to 13.6% with a buy-and-hold approach. While it slightly underperformed the index, it helped reduce volatility during significant market downturns.
In cryptocurrency, Bitcoin's price cycles from 2017 to 2021 highlighted the strategy's ability to navigate extreme price swings. For example, it triggered exits at $10k, avoiding the drop to $3k, and re-entries at $5k, riding the surge to $60k. These results align with the trend confirmation principles often used in entry strategies.
Here's how the strategy performs across major asset classes:
| Asset Class | Win Rate | Risk-Reward | Max Drawdown |
|---|---|---|---|
| Stocks (S&P 500) | 62% | 1:1.8 | 18% |
| Forex (EUR/USD) | 55% | 1:1.3 | 12% |
| Crypto (Bitcoin) | 68% | 1:2.2 | 35% |
Evaluating Key Metrics
The strategy's performance varies across sectors. For example, in the technology-heavy NASDAQ-100, it delivered a 12.5% annual return from 2010 to 2020, whereas in the more stable utilities sector (tracked by the XLU fund), the return was 6.2% over the same period.
"The 200-day moving average remains one of the most reliable technical indicators for long-term trend following, particularly when combined with volume analysis."
Certain adjustments can improve the strategy's results:
- Adding a 1-3% buffer around the MA helped reduce false signals and increased win rates from 62% to 68% in S&P 500 tests (2000-2020).
- Using volume-weighted calculations improved annual returns for DJIA trades by 2% (1990-2020).
- A 5-day confirmation period cut false signals by 20% in Russell 2000 testing.
Platforms like LuxAlgo make it easier to apply these refinements with their advanced indicator features. While the 200-day MA strategy may not always match the returns of strong bull markets, it shines during market corrections by preserving capital and delivering steady long-term results when paired with additional indicators.
Conclusion and Main Points
Looking at historical case studies and refining strategies, three main principles stand out for using the 200-day Moving Average effectively. This metric performs differently across markets, with win rates ranging from 55% in forex to 68% in cryptocurrency markets [1].
Here’s how to get the most out of it:
-
Use the 200-day MA as a trend filter, not a standalone metric
Confirm the trend direction before taking action. Look for clear crossovers and back them up with price action signals. -
Pair it with additional confirmation measures
Combine it with volume analysis for stronger signals, use momentum indicators to gauge trend strength, and keep an eye on price movements near key MA levels. -
Stick to strict risk management
Position sizes should align with your risk tolerance. Use trailing stops based on the distance from the MA and adjust your exposure depending on market volatility.


