QuantConnect Review: Best Platform for Algo Trading?
QuantConnect is a strong choice for developing and operating systematic strategies with Python or C#, especially when the project needs portfolio research, configurable execution models, and supported broker connections. LuxAlgo is a compelling choice for native chart analysis and developing editable indicators and strategies with Quant, our coding agent. The decision depends on the workflow you need, rather than a simple professional-versus-retail distinction.
Both platforms now provide AI-assisted development. QuantConnect combines its LEAN engine with a research pipeline and assistants; LuxAlgo places Quant inside its chart environment. This review uses current official documentation and regular pricing checked September 8, 2026, with separate treatment of cloud resources, market data, and broker costs.
Quick Comparison
| Area | QuantConnect | LuxAlgo |
|---|---|---|
| Core workflow | Python/C# research, backtesting, paper deployment, and supported live broker integrations | Native browser charts, drawings, indicators, and strategy development with Quant |
| AI assistance | Research pipeline with optional assistants for ideas, research, validation, backtesting, paper testing, and monitoring | Quant develops editable studies and strategies for review and testing on the chart |
| Historical data | Multi-asset datasets; dates, resolution, licensing, and fees vary by dataset | Native chart history and data entitlements vary by plan; TradingView toolkits use their separate environment |
| Execution | Configured LEAN deployment through a supported brokerage; live resources and account requirements apply | Native strategy simulations are distinct from product-specific alerts and separate open-source execution projects |
| Price structure | Free research/backtesting tier; paid seats, compute nodes, data, and other resources | Free plan; Premium $67.99, Ultimate $119.99, Ultra $229.99 with monthly billing |
QuantConnect LEAN: Getting Started
The original tutorial below, by Part Time Larry, was published August 11, 2022. It introduces LEAN through a buy-at-close, sell-at-open example. It remains useful as a historical coding walkthrough, but interfaces, installation steps, and prices may have changed. The creator discloses paid sponsorship by Interactive Brokers; the example is educational rather than evidence of future returns.
1. QuantConnect Features and Infrastructure
LEAN, Cloud Development, and Local Deployment
QuantConnect builds its research and trading services around LEAN, an open-source algorithmic trading engine. The platform overview describes Python and C# development, multi-asset research, historical simulation, and live deployment. Developers can use notebooks to explore data before converting a hypothesis into trading rules.
An event-driven engine processes market information and portfolio events in sequence. That helps express scheduled decisions, orders, and account changes consistently, but the sequence is only as reliable as the code, timestamps, subscriptions, and model assumptions. Sharing an engine between backtests and live trading does not make their results identical.
Cloud hosting reduces infrastructure work; local and on-premise workflows provide additional control over code, data, and deployment. These choices also change the operational burden. A local installation needs compatible software, data, and ongoing maintenance; enterprise services can have separate setup and support costs.
Distinguish the open-source LEAN engine from the LEAN CLI. Current CLI documentation requires membership in a paid-tier QuantConnect organization, and local engine commands depend on Docker. Using open-source engine code does not mean every hosted service, data license, or convenient deployment tool is free.
AI Research Pipeline and Strategy Development
QuantConnect’s Research Pipeline organizes projects into Ideas, Research, Backtest, Paper, and Live stages. Users can move projects manually or configure assistants for parts of the process. This makes an older description of QuantConnect as exclusively manual coding incomplete.
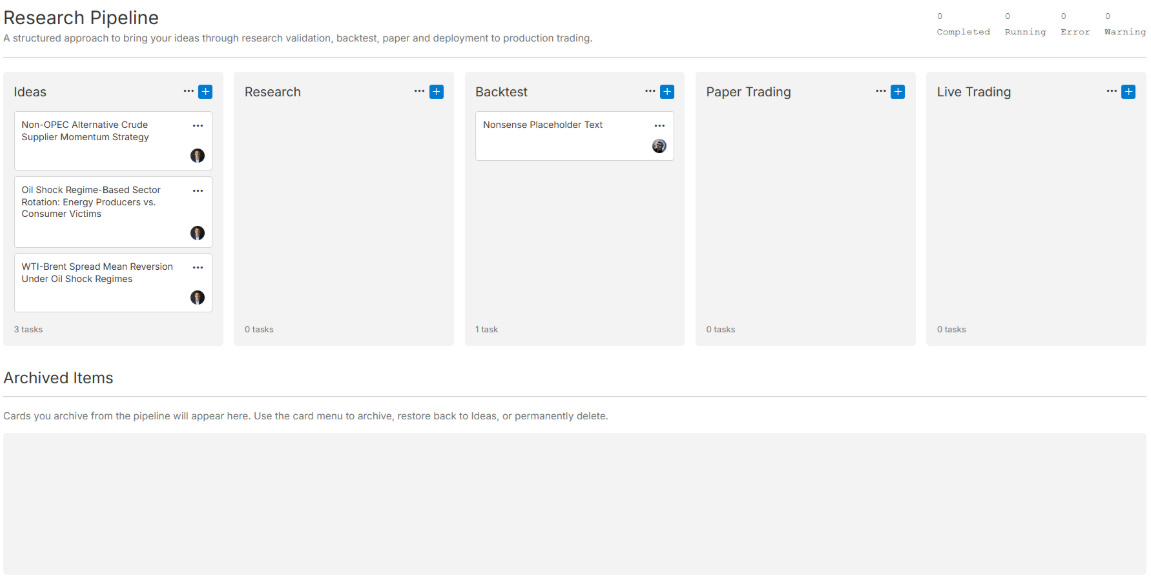
The documented assistants can help generate research notebooks, assess statistical assumptions, write and debug backtests, compare paper results with expectations, and monitor live projects. Available assistant resources and quotas matter. Reviewing the hypothesis, generated code, data use, and risk limits remains part of the developer’s job.
For an ETF allocation study, define the eligible universe, rebalance schedule, signal calculation, and position constraints before asking an assistant to implement it. For a machine-learning experiment, separate training and evaluation periods and check when every feature became available. A sophisticated library or generated notebook does not by itself validate a model.
Backtesting, Optimization, and Execution Models
LEAN’s reality-modeling framework exposes models for fills, slippage, fees, buying power, settlement, short availability, and options behavior. Its documentation explicitly says default models assume highly liquid assets. Larger orders or illiquid instruments may need customized assumptions.
| Research issue | What to inspect | Why it matters |
|---|---|---|
| Transaction costs | Broker commissions, spread, slippage, borrowing and financing where relevant | A gross edge may disappear after realistic costs |
| Order execution | Order type, fill timing, available liquidity, partial execution assumptions | A simulated fill is not a guaranteed live fill |
| Options | Pricing, exercise, assignment, buying power and contract selection | A payoff diagram alone does not describe the capital or operational risk |
| Portfolio risk | Exposure, correlated holdings, sizing and margin behavior | Several strategies can share the same underlying risk |
| Historical integrity | Available-at-the-time data, corporate actions and universe selection | Later information or surviving symbols can distort historical results |
For example, an options hedge should be checked for changing delta, contract liquidity, assignment exposure, and account buying power. Testing those effects is more useful than assuming that a margin model guarantees historical precision. Model settings should match the intended broker and instrument, and any mismatch should be documented.
Cloud parameter optimization evaluates parameter choices against an objective such as a risk-adjusted performance measure. A better in-sample score can reflect overfitting. Keep a later period untouched, inspect nearby parameter values, and assess turnover and drawdown rather than selecting only the best-looking equity curve.
There is no universal backtest runtime: universe size, data resolution, strategy logic, and allocated resources affect it. Measure a representative strategy on the intended resources; platform-wide daily backtest counts do not establish an individual account’s speed or parallel capacity.
Market Data and Historical Coverage
QuantConnect covers equities, options, futures, forex, crypto, and other supported instruments through its datasets and integrations. Its overview describes a library of roughly 400 TB, but that aggregate size does not establish what a particular subscription includes. Use the dataset catalog to check a specific market and research requirement.
| Data requirement | Checks before testing |
|---|---|
| Equities and ETFs | Coverage dates, resolution, corporate actions, delisted securities and historical universe membership |
| Options and futures | Contract availability, expiration/roll handling, quotes versus trades and model assumptions |
| Forex and crypto | Broker or exchange source, time zone, market hours and historical gaps |
| Fundamental and alternative data | Release timing, revisions, identifiers, licensing and subscription costs |
| Local research or exports | Download rights, permitted use, storage needs and compatibility with the local engine |
Do not interpret a headline history figure as decades of tick data for every market. Equities, options, futures, and crypto have different histories and resolutions. A dataset that works in cloud research may have separate download or redistribution terms; availability inside an IDE is not unrestricted ownership of the underlying data.
Standard identifiers such as FIGI, CUSIP, or ISIN help map instruments across sources. They do not automatically establish point-in-time validity. Fundamental releases and revised economic series must be aligned to when the strategy could have known them, and historical universe selection should avoid relying only on today’s surviving companies.
Broker Connections and Operational Risk
The brokerage documentation lists integrations including Interactive Brokers, Alpaca, TradeStation, and several crypto venues. Supported asset classes, order types, account permissions, and data subscriptions vary by integration. QuantConnect supplies trading software and infrastructure; the brokerage supplies the account and exchange connection.
A long integration list does not mean one algorithm automatically trades through every broker or account simultaneously. Select the intended brokerage model and deployment configuration, then confirm support for the actual instruments and orders. Routing software should not be described as a guaranteed low-latency or high-frequency execution service without workload-specific evidence.
The live deployment guide requires an available live node for each deployed algorithm, including paper deployments. It also warns that manual trading in an account used by an algorithm can create conflicts. Establish how positions, cash, open orders, and restarts will be reconciled before running live.
Stopping an algorithm leaves existing positions in the account. The separate liquidation action submits market orders, or market-on-open orders when appropriate, before stopping; submission is not proof that every position has closed. Automatic restarts are described as best efforts, so monitor the broker’s actual account state and outstanding orders.
QuantConnect’s risk documentation discusses look-ahead and survivorship bias, overfitting, model limitations, and operational failures. Platform safeguards help, but they cannot eliminate bugs, feed interruptions, broker outages, or losses. Test failure handling and notification delivery along with the strategy rules.
Security, Ownership, and Community
According to the security and intellectual-property documentation, users own their code and projects are private unless shared. The platform describes encrypted infrastructure and optional code encryption at rest using a locally held key. Confirm the relevant plan and deployment settings rather than assuming every account uses every protection.
Buyers with formal security, connectivity, or service-level requirements should evaluate the applicable contract and technical documentation for their deployment. A hosting description does not establish a platform-wide certification, guaranteed execution latency, or a particular service-level agreement.
The current research collection includes published examples on portfolio construction, options, and other systematic methods. Documentation and community discussions can help explain implementation choices. Treat shared strategies as research starting points, not verified live records or a guaranteed route to institutional licensing revenue; older marketplace and revenue-sharing references should not be assumed to describe a current entitlement.
2. LuxAlgo Features
Native Charts and Quant
LuxAlgo combines native browser charts with Quant, our coding agent, for developing editable indicators and strategies. This supports a chart-centered process: identify a behavior, express precise rules, inspect the implementation, and evaluate the resulting study or simulation. Native charts do not require a TradingView account.
Consider a moving-average trend strategy with a volatility-based exit. Specify the market, timeframe, periods, completed-candle conditions, entry timing, position size, and exit behavior. Ask Quant to develop the strategy, then review Code and Run and its Inputs and Properties. An indicator that marks conditions is not automatically a strategy that simulates orders.
Inspect individual trades and the simulation settings, including commission and slippage assumptions. Compare a later period and reasonable parameter variations. If the idea uses a daily condition on an intraday chart, ensure it does not use the final daily value before that value was available.
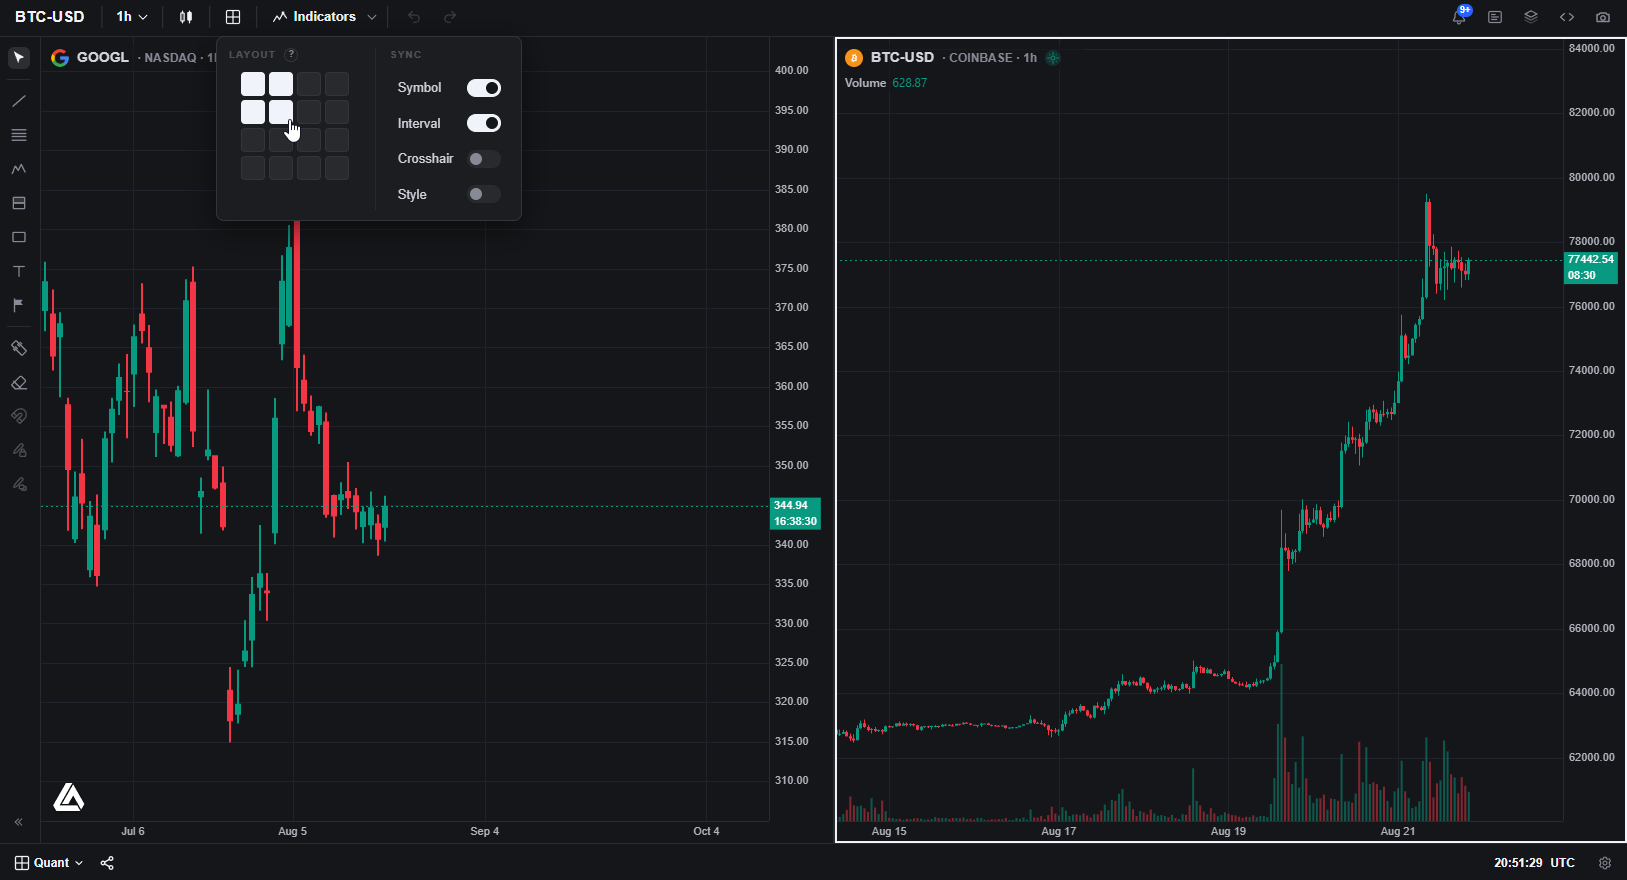
Separate workspaces can keep different hypotheses, markets, and layouts organized. The short demonstration below shows the LuxAlgo workspace interface; it is a navigation example, not a backtest or an order-routing demonstration.
Data, Orderflow, and TradingView Toolkits
The native data guide distinguishes candle history from footprint coverage. Plan-dependent chart history ranges from 5,000 to 50,000 candles. Supported crypto venues and U.S. equities through Cboe EDGX provide pre-aggregated one-minute footprint data; this is not a raw trade tape or full order book, and EDGX volume is not consolidated U.S. market volume.
Paid forex, commodities, and CME feeds provide candles rather than identical footprint coverage. Candle-based TPO, VWAP, and Visible Range Profile serve different purposes. Match the feed and available history to the hypothesis instead of treating a charting plan as a downloadable institutional dataset subscription.
| Separate TradingView product | Purpose |
|---|---|
| Price Action Concepts (PAC) | Market structure, order-block and liquidity concepts, and price-action analysis |
| Signals & Overlays (S&O) | Confirmation and Contrarian signals, overlays, dashboards, and alert conditions |
| Oscillator Matrix (OSC) | Momentum, divergence, and complementary oscillator readings |
| Toolkit screeners | Monitor supported conditions across 10 selected symbols |
| Toolkit backtesters and Backtesting Assistant | Evaluate toolkit rules or search tested configurations in their separate workflows |
The TradingView toolkits are included with Premium and higher plans, with setup described in the access guide. Their screeners and backtesters should not be confused with native Quant strategy development. The Backtesting Assistant is a separate strategy-search workflow, available with Ultimate and higher plans.
Use the Indicator Library and product documentation to understand the calculation behind a study. A market-structure or money-flow label does not directly reveal institutional positions or guarantee a future price move.
Alerts and Open-Source Projects
The documented Strategy Alerts workflow relates to the Backtesting Assistant and TradingView toolkits. It should not be presented as automatic live deployment of every native Quant strategy. Confirm the supported product, conditions, and destination before configuring automation.
LuxAlgo also maintains separate open-source projects, including PineTS, its MCP server, Broker SDK, and Trade Relay. These have their own setup and supported capabilities. Trade Relay is a free, self-hosted project; its current page distinguishes Alpaca paper/live and Tradier sandbox support from watch-only integrations. It is not evidence that native LuxAlgo charts automatically route all broker orders.
Similarly, the availability of developer tools does not establish general compatibility with NinjaTrader or MetaTrader. Evaluate the specific connector and account requirements rather than assuming that a strategy transfers unchanged between different runtimes and platforms.
Pricing and Total Cost
QuantConnect Seats and Resources
QuantConnect’s monthly pricing selector currently shows the following recommended configurations. These are configurable combinations of seats and resources, not simple all-inclusive base subscription prices:
| Tier | Recommended monthly configuration | Minimum users |
|---|---|---|
| Researcher | $84 | 1 |
| Team | $168 per user | 2 |
| Trading Firm | $480 per user | 2 |
| Institution | $1,272 per user | 5 |
The Researcher configuration totals $84 from a $10 seat, $14 backtest node, $12 research node, $24 live node, and $24 assistant node. The selected backtest node has 2 CPUs and 8 GB RAM; the research node has 1 CPU and 4 GB RAM. Adjusting resources changes both cost and capacity, so a seat price alone does not describe a complete workflow.
The current Free comparison lists unlimited backtesting with minute, hourly, and daily data, but not tick/second data or paper/live trading. It should not be described as eight monthly testing hours plus two free live algorithms. Paid capabilities, dataset subscriptions, resource limits, and support differ by tier.
Budget separately for data licenses, additional simultaneous deployments, storage or compute choices, and brokerage expenses. Commission schedules, exchange fees, margin interest, and borrow costs depend on the account and market. Use a configuration-specific quote and the broker’s current fee schedule to estimate the total bill.
LuxAlgo Monthly and Annual Prices
| Plan | Monthly billing | Annual total | Monthly equivalent billed annually |
|---|---|---|---|
| Free | $0 | $0 | $0 |
| Premium | $67.99 | $479.88 | $39.99 |
| Ultimate | $119.99 | $719.88 | $59.99 |
| Ultra | $229.99 | $1,439.88 | $119.99 |
These standard LuxAlgo prices exclude temporary promotions. Monthly credits are 500, 5,000, 25,000, and 100,000 respectively. The $39.99 Premium figure is an annual equivalent, not a month-to-month price. Compare current chart, data, history, AI, and separate-product entitlements before selecting a plan.
Strengths, Limitations, and Final Assessment
- Choose QuantConnect for a research-to-deployment engineering workflow: Python/C#, multi-asset data, configurable portfolio and execution models, and a supported broker integration. Expect to understand the code, account behavior, and operational responsibilities even when using AI assistants.
- Choose LuxAlgo for chart-centered development: native analysis, visual inspection, and editable indicators or strategies with Quant. It is particularly useful when the next step is turning a specific chart observation into a testable rule.
- For existing TradingView users: assess LuxAlgo’s dedicated toolkits and their screeners/backtesters separately from native charts. An existing chart subscription does not make every external feature or data feed equivalent.
- For live automation: compare the complete chain from signal to submitted order, broker acceptance, fill, and account reconciliation. A historical simulation or alert alone does not complete that chain.
Neither platform removes the need to define a valid strategy. QuantConnect’s strength is the depth and configurability of its systematic infrastructure; its corresponding cost is technical and operational complexity. LuxAlgo’s strength is a direct path from chart analysis to editable strategy research, with additional TradingView and open-source workflows that should be evaluated on their own terms.
For a practical comparison, build one modest strategy using the same symbol, session, timeframe, evaluation period, and cost assumptions wherever possible. Record implementation time, data differences, errors found during review, and how easily each trade can be explained. Expand only after that small test establishes which workflow fits your requirements.
FAQs
Is QuantConnect free to use?
QuantConnect has a Free tier for research and backtesting. Its current comparison lists unlimited backtesting with minute, hourly, and daily data, but excludes tick/second data and paper/live trading. Paid seats, compute resources, and data can add costs.
Does QuantConnect cost $84 per month?
The pricing selector shows a recommended Researcher configuration totaling $84 per month from a seat and backtest, research, live, and assistant nodes. This is a configurable resource package, not a universal all-inclusive base fee. Other tiers, data, and brokerage costs differ.
How does QuantConnect compare with LuxAlgo?
QuantConnect emphasizes Python/C# research, configurable LEAN simulations, and supported live deployments, with optional AI assistants. LuxAlgo emphasizes native charts and developing editable indicators and strategies with Quant, our coding agent. Its TradingView toolkits, Backtesting Assistant, and open-source projects are separate workflows.
Does a QuantConnect backtest eliminate look-ahead bias or guarantee live results?
No. Data timing, universe selection, code, model assumptions, costs, and operational conditions can all affect results. QuantConnect’s own documentation discusses these risks. Review individual trades, use independent evaluation data, and test the intended broker configuration.
References
Read next