Explore essential techniques in quantitative trading, including mean reversion, trend analysis, and the impact of AI on trading strategies.
Quantitative trading uses algorithms and data to make fast, emotion-free trading decisions. Here's what you need to know:
- What It Is: Trading based on mathematical models and real-time data analysis.
- Key Methods:
- Mean Reversion: Buying low, selling high based on historical price averages.
- Trend Analysis: Following sustained price movements using indicators like RSI and MACD.
- AI Systems: Leveraging machine learning for pattern recognition and strategy optimization.
- Pros: Fast execution, emotion-free, handles large data.
- Cons: High setup costs, requires technical skills, depends on data quality.
- Risk Management: Use methods like the Kelly Criterion and backtesting to refine strategies and manage losses.
- Tools: Platforms like QuantConnect and LuxAlgo’s real-time signal services, and data providers like Bloomberg Terminal and EODHD.
Quantitative trading combines data, strategy, and automation to navigate fast-paced markets effectively.
Quant Strategy: Pairs Trading Algorithm (Mean Reversion)
Main Trading Methods
Quantitative trading relies on three main approaches, each using statistical tools and advanced algorithms to find opportunities in the market.
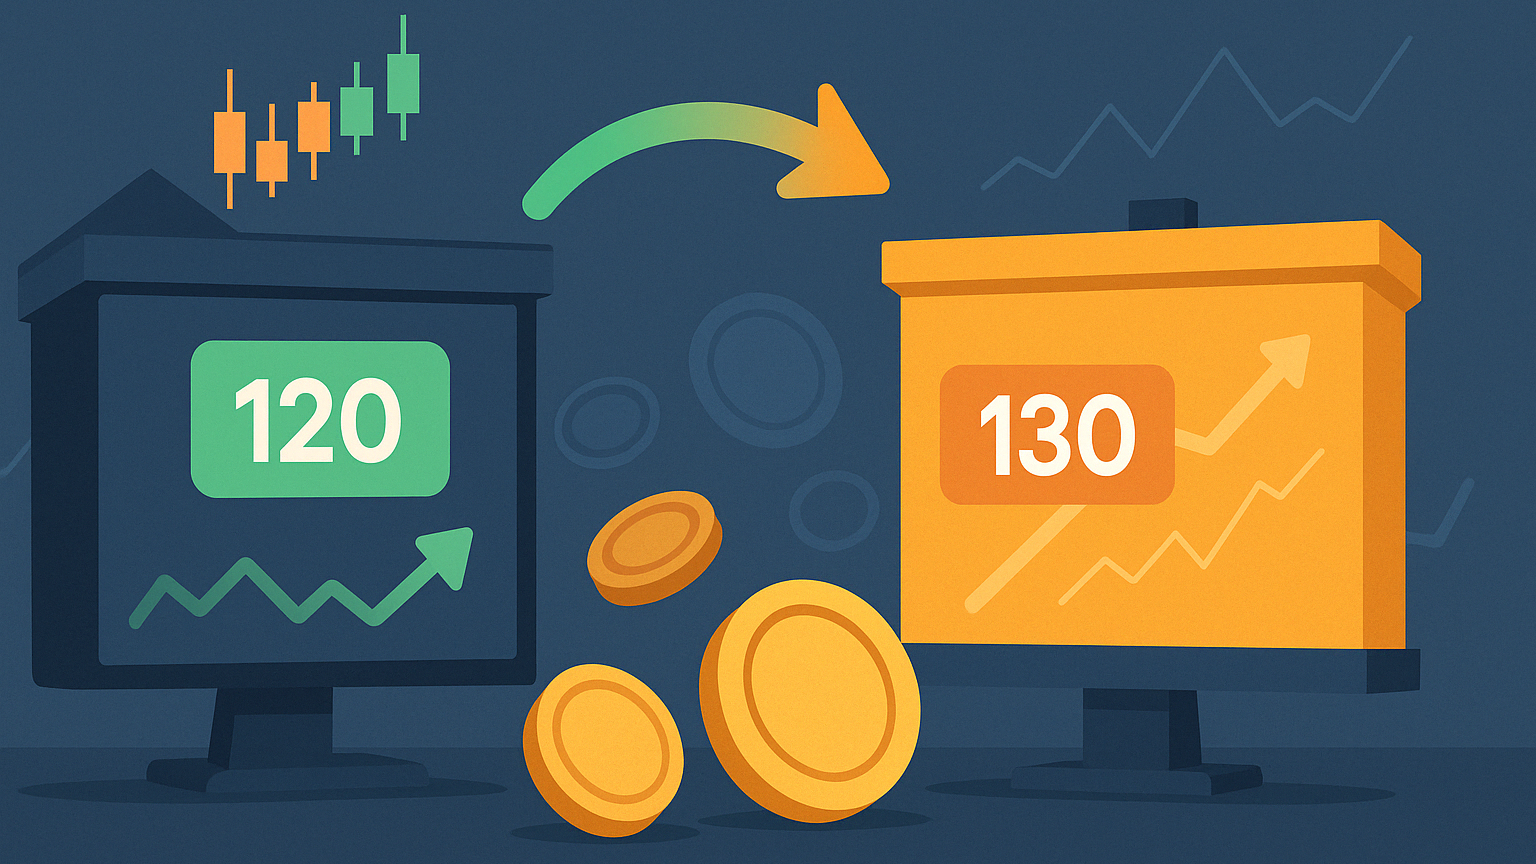
Price Return to Average
This method, often called mean reversion, focuses on identifying when prices deviate from their historical averages.
Key tools include:
- Standard deviation and z-scores to spot unusual price movements.
- Moving averages to define baseline price levels.
"Mean reversion is a financial term for the assumption that an asset's price will tend to converge to the average price over time."
Traders use this strategy by selling when prices are too high (overbought) and buying when they’re too low (oversold). However, markets can stay in extreme conditions longer than expected, which adds risk.
For a different perspective, trend analysis offers another way to approach price movements.
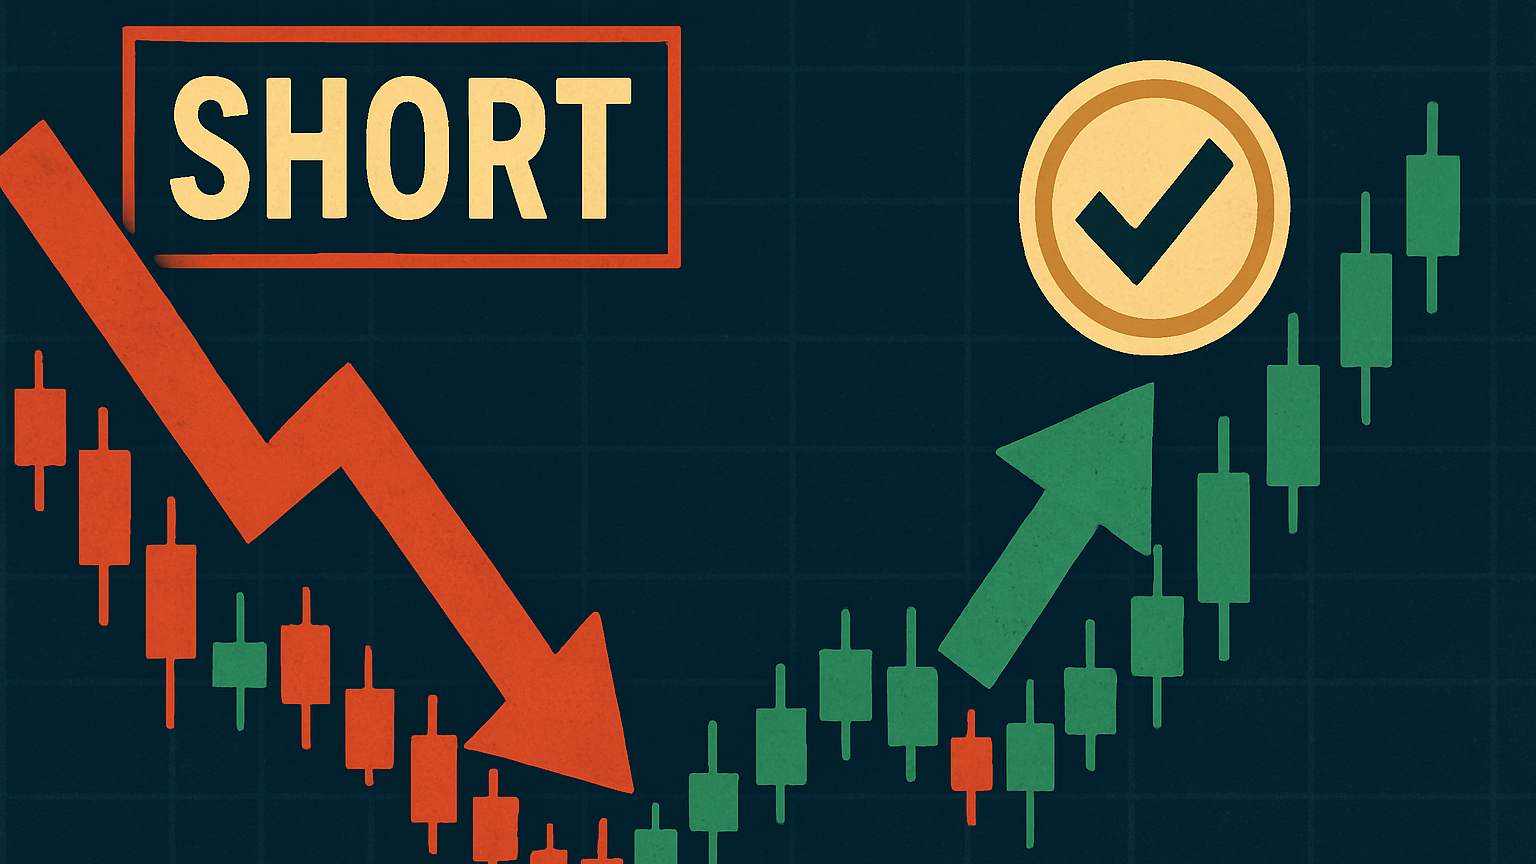
Price Trend Analysis
Trend analysis focuses on identifying and following sustained price movements. It uses various indicators to generate trading signals:
| Indicator | Purpose | Signal |
|---|---|---|
| Moving Averages | Shows trend direction | Price crossing above/below the MA |
| MACD | Confirms momentum | Line crossovers |
| RSI | Highlights extremes | Above 70 (overbought) or below 30 (oversold) |
| OBV | Confirms volume trends | Volume aligns with price movement |
"With trend-following strategies, one does not aim to forecast or predict, but one simply needs to keep an eye on the market for any emerging trends."
An example is the Societe Generale trend-following strategies index, which delivered a 26% return year-to-date as of May 2022, highlighting how well-executed trend-following can deliver strong results.
But the evolution of trading doesn’t stop there. AI is taking things to a new level.
AI Trading Systems
AI brings a powerful edge by refining pattern recognition and optimizing strategies through machine learning. These systems can execute trades automatically and improve effectiveness over time.
For instance, Trading System Lab and PredictNow.ai improved cross-validation Sharpe ratios from 2.11 to 2.61, while out-of-sample ratios rose from 3.195 to 3.43, showcasing the impact of AI-driven optimization.
"The best system against the market is not always just one or two systems but many systems each capturing specific movements of the market." – Mike Barna, CTA, President, Trading System Lab®
AI systems excel at:
- Designing and testing strategies automatically.
- Identifying patterns in massive datasets.
- Analyzing market conditions in real time.
- Optimizing performance after execution.
When combined, mean reversion, trend analysis, and AI-driven systems create a well-rounded approach for different market scenarios.
Testing and Improving Strategies
Before investing real money, quantitative traders must test strategies using historical data. Backtesting evaluates performance, highlights weaknesses, and fine-tunes methods for live markets.
Why Testing Matters
Backtesting assesses performance metrics and refines strategies. Key steps include:
| Component | Purpose | Consideration |
|---|---|---|
| Historical Data Analysis | Evaluate strategy performance | Use clean, accurate data |
| Risk Assessment | Estimate potential losses | Include transaction costs & slippage |
| Strategy Refinement | Adjust parameters | Avoid over-optimization |
| Performance Validation | Ensure consistency | Test under varied conditions |
Common Testing Pitfalls
- Separate Datasets: Use development and validation sets.
- Simplify Parameters: Reduce variables to avoid curve fitting.
- Multi-Asset Tests: Confirm reliability across asset classes.
Measuring Performance
Metrics should reflect both risk and return. As of September 28, 2024, the S&P 500 Portfolio had a Sharpe ratio of 2.91. Key metrics include:
| Metric | What It Measures | Ideal Range |
|---|---|---|
| Sharpe Ratio | Risk-adjusted return | >1.0 |
| Max Drawdown | Peak-to-trough loss | Align with tolerance |
| Sortino Ratio | Downside risk | Higher is better |
Trading Software and Data
Choosing the right platform and data provider is crucial for strategy development, testing, and execution.
Trading Platform Selection
| Feature | Basic Platforms | Advanced Platforms |
|---|---|---|
| Strategy Development | Visual editors, templates | Custom coding, AI integration |
| Data Access | Limited history | Broad coverage |
| Automation | Basic alerts | Full automation |
| Testing Tools | Simple backtesting | Advanced optimization |
Options range from TrendSpider’s extensive feed coverage to no-code solutions like Composer, while QuantConnect caters to developers.
Market Data Sources
| Provider | Annual Cost | Specialty |
|---|---|---|
| Bloomberg Terminal | $10,000+ | Comprehensive data |
| EODHD | Under $1,000 | Affordable, reliable |
| Finage | $5,000–$10,000 | Institutional data |
LuxAlgo: Technical Tools
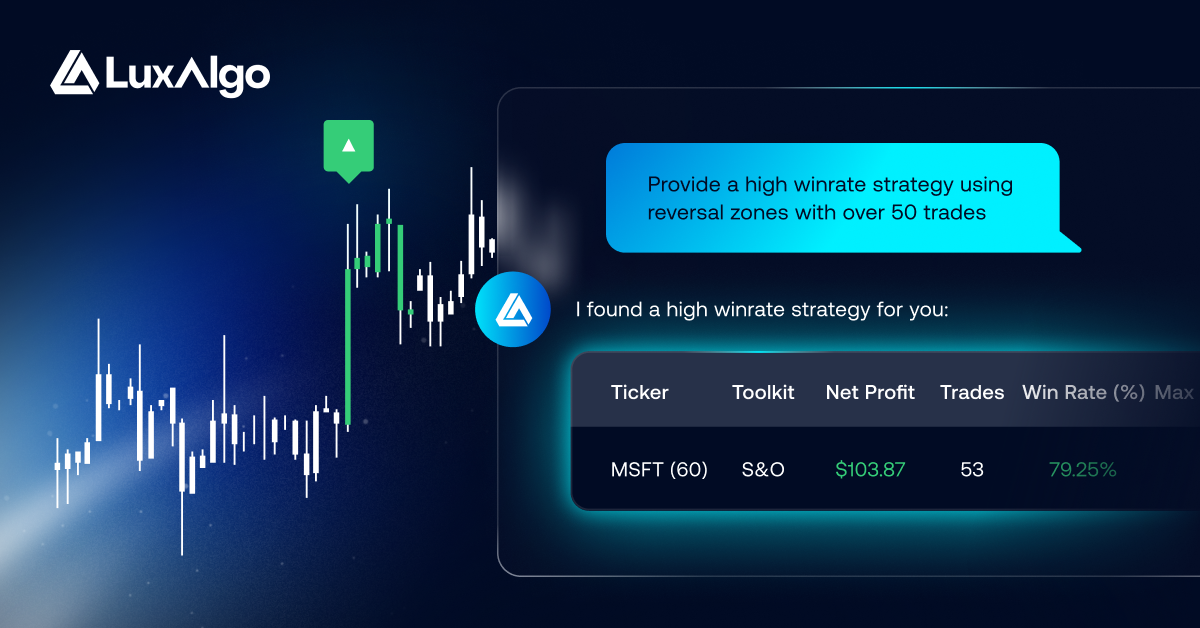
LuxAlgo offers technical analysis solutions on TradingView. The Ultimate plan ($59.99/mo) includes:
- AI Backtesting Assistant for automated strategy discovery
- Three integrated backtesters on TradingView
- Comprehensive signal analysis tools
- Real-time market scanning features
The Price Action Concepts toolkit automates pattern detection and market structure analysis, while the Signals & Overlays toolkit provides algorithmic signals to support informed decisions.
Risk Control and Trade Management
Managing risk is a cornerstone of successful quantitative trading.
Trade Size and Risk Limits
The Kelly Criterion calculates ideal position size: k% = (bp – q) / b, where p and q are win and loss probabilities.
| Rule | Recommended | Why |
|---|---|---|
| Max Position | 20–25% | Diversification |
| Kelly-Based | 2.5–5.7% | Capital preservation |
| Fractional Kelly | ~50% of Kelly | Lower exposure |
Trade Cost Management
| Cost | Strategy | Benefit |
|---|---|---|
| Brokerage Fees | Standardize rates | Avoid overcharges |
| Data Analytics | Automate reporting | Save millions |
| Reconciliation | Verify trades | Accurate billing |
Live Strategy Adjustment
Conditional Parameter Optimization (CPO) lets traders tweak parameters daily or per trade to match market conditions. PredictNow.ai applied CPO to a Bollinger Band mean-reversion strategy on GLD, achieving improved outcomes with dynamic adjustments.
Looking Ahead
Quantitative trading keeps evolving with data science and AI. A CQF Institute poll shows 73% of professionals now view machine learning as a core FinTech skill. Investment in alternative data rose from $232 M in 2016 to $1.7 B by 2020, underscoring the shift toward data-driven strategies.