Learn how rounding tops and bottoms indicate market reversals and master effective trading strategies for these patterns.
Rounding tops and bottoms are price patterns that signal market trend reversals. Here's what you need to know:
- Rounding Bottom: A "U"-shaped pattern indicating the end of a downtrend and a bullish reversal.
- Rounding Top: An inverted "U"-shaped pattern marking the end of an uptrend and a bearish reversal.
- Volume Behavior: For bottoms, volume rises during recovery. For tops, volume spikes as prices drop.
- Key Signals: Breakouts above resistance (bottoms) or below support (tops) confirm the pattern.
- Formation Time: These patterns take weeks to months to develop, allowing for detailed analysis.
Quick Overview:
| Pattern Type | Market Signal | Action |
|---|---|---|
| Rounding Bottom | End of Downtrend | Go long after breakout above resistance. |
| Rounding Top | End of Uptrend | Go short after breakout below support. |
Patience and validation are crucial. Look for clear price action, consistent volume trends, and confirmed breakouts to trade effectively.
Pattern Formation Process
Formation Steps
Rounding patterns emerge in distinct phases, reflecting shifts in market sentiment. In a rounding top, a strong upward trend gradually flattens into a curved shape before turning downward. On the other hand, a rounding bottom starts with a prolonged downtrend, which softens as selling pressure eases and buyers step back in.
| Formation Stage | Rounding Top | Rounding Bottom |
|---|---|---|
| Initial Phase | Strong uptrend | Strong downtrend |
| Middle Phase | Price levels off | Price bottoms out |
| Final Phase | Downward curve forms | Upward curve forms |
| Completion | Break below support | Break above resistance |
Volume patterns play a key role in confirming these stages.
Volume Behavior
Volume trends align closely with these phases. For rounding tops, volume is highest during the initial uptrend, decreases mid-pattern, and then spikes as the price begins to decline. In rounding bottoms, volume peaks during early selling, diminishes at the lowest point, and rises again as the price recovers, signaling renewed buying interest.
Neckline Analysis
Analyzing the neckline is crucial for confirming these patterns. Take Coca-Cola (KO) as an example: between July and October 2014, traders identified a rounding bottom by marking a neckline at around $41. A breakout above this level confirmed the pattern and suggested a potential buying opportunity.
To effectively analyze a neckline:
- Draw a line connecting key support or resistance points.
- Observe volume activity near the neckline.
- Measure the distance from the pattern's extreme to the neckline to estimate potential price targets.
Pattern Recognition Methods
Chart Analysis Tools
When analyzing price charts, it's essential to identify key arc formations. Rounding tops show a dome-like shape, while rounding bottoms resemble a bowl.
| Pattern Element | Rounding Top | Rounding Bottom |
|---|---|---|
| Initial Shape | Dome-like formation | Bowl-like formation |
| Volume Pattern | High volume at both ends, lower in the middle | High at the decline's start, tapering mid-formation, then rising during recovery |
| Confirmation Point | Breaks below support | Breaks above resistance |
| Candle Formation | Small-bodied candles throughout | Small-bodied candles throughout |
The Average True Range (ATR) indicator can also confirm these patterns by tracking changes in volatility. As the pattern develops, look for a drop in ATR readings, which signals reduced price volatility during the rounding process. This can provide additional validation for the pattern's formation.
Pattern Time Analysis
Understanding the time frame is crucial when spotting these patterns. Rounding patterns take time to develop—often spanning weeks or even months. This gradual progression reflects shifts in market sentiment and requires careful observation. Key timing characteristics include:
- Slower price movement during the curved portion of the pattern.
- Reduced trading activity in the middle of the formation.
- Increased momentum during breakout phases.
For a well-formed rounding bottom, expect high volume at the start of the decline, tapering off in the middle, and surging again during recovery.
False Pattern Prevention
To avoid being misled by false signals, it's important to validate patterns thoroughly. Here are some key steps:
-
Volume Trends
Ensure the volume aligns with the price action. For rounding bottoms, volume should peak at the beginning of the decline, taper off mid-pattern, and rise again during recovery. -
Price Action Consistency
Look for steady, small-bodied candles throughout the pattern. Erratic or unpredictable price movements can indicate a false signal. -
Support and Resistance Levels
Clear support (for tops) and resistance (for bottoms) levels are crucial. Confirm these levels with multiple tests to ensure reliability.
Avoid acting on patterns that show inconsistent volume, erratic price movements, sudden sharp changes, or unclear support/resistance levels. Genuine rounding patterns are uncommon, so taking the time to validate them thoroughly can improve your trading decisions and reduce risks.
Rounding Top Pattern: How To Trade it in a Few Simple Steps
Trading Pattern Breakouts
Breakout analysis focuses on pinpointing precise trade entry and exit points, building on pattern recognition techniques.
Entry and Exit Timing
Timing is everything when it comes to entries and exits. For rounding tops, enter when the price breaks below support with volume confirmation. A candlestick closing below support solidifies the signal. Adding a layer of caution, wait for the price to retest the broken support (now acting as resistance) before taking action.
For rounding bottoms, patience is key. Let the pattern fully develop before entering. Go long when the price breaks above resistance, again confirmed by volume.
| Pattern Type | Entry Signal | Exit Strategy |
|---|---|---|
| Rounding Top | Break below support with volume | Project the pattern height downward from breakout |
| Rounding Bottom | Break above resistance with volume | Measure a move equal to the pattern's height from breakout |
| Pattern Retest | Confirm breakout with a retest | Use the measured move as the profit target |
Stop-Loss Placement
Stop-loss orders are your safety net. For rounding tops, place the stop just above the breakout point or the most recent high within the pattern. For rounding bottoms, position the stop below the lowest point of the pattern. If traditional stops seem too wide, consider using volatility-based stops for a more tailored approach.
Position Sizing Rules
Managing your position size is essential to controlling risk. Stick to risking only 1–2% of your total capital per trade. Here's how to approach it:
- Calculate position size based on the distance to your stop-loss.
- Factor in the pattern's volatility when deciding leverage.
- For larger patterns, consider scaling into positions gradually to reduce timing risks.
Scaling into larger patterns allows you to manage risk effectively without overcommitting too early. Always ensure your position size aligns with your risk tolerance and overall strategy. Combining these breakout strategies with advanced techniques can lead to more refined execution.
Pattern Trading Techniques
These trading methods refine breakout strategies by focusing on better entry timing and managing risk. Pairing rounding patterns with other technical tools can improve trade accuracy and confirm potential reversals.
Indicator Combinations
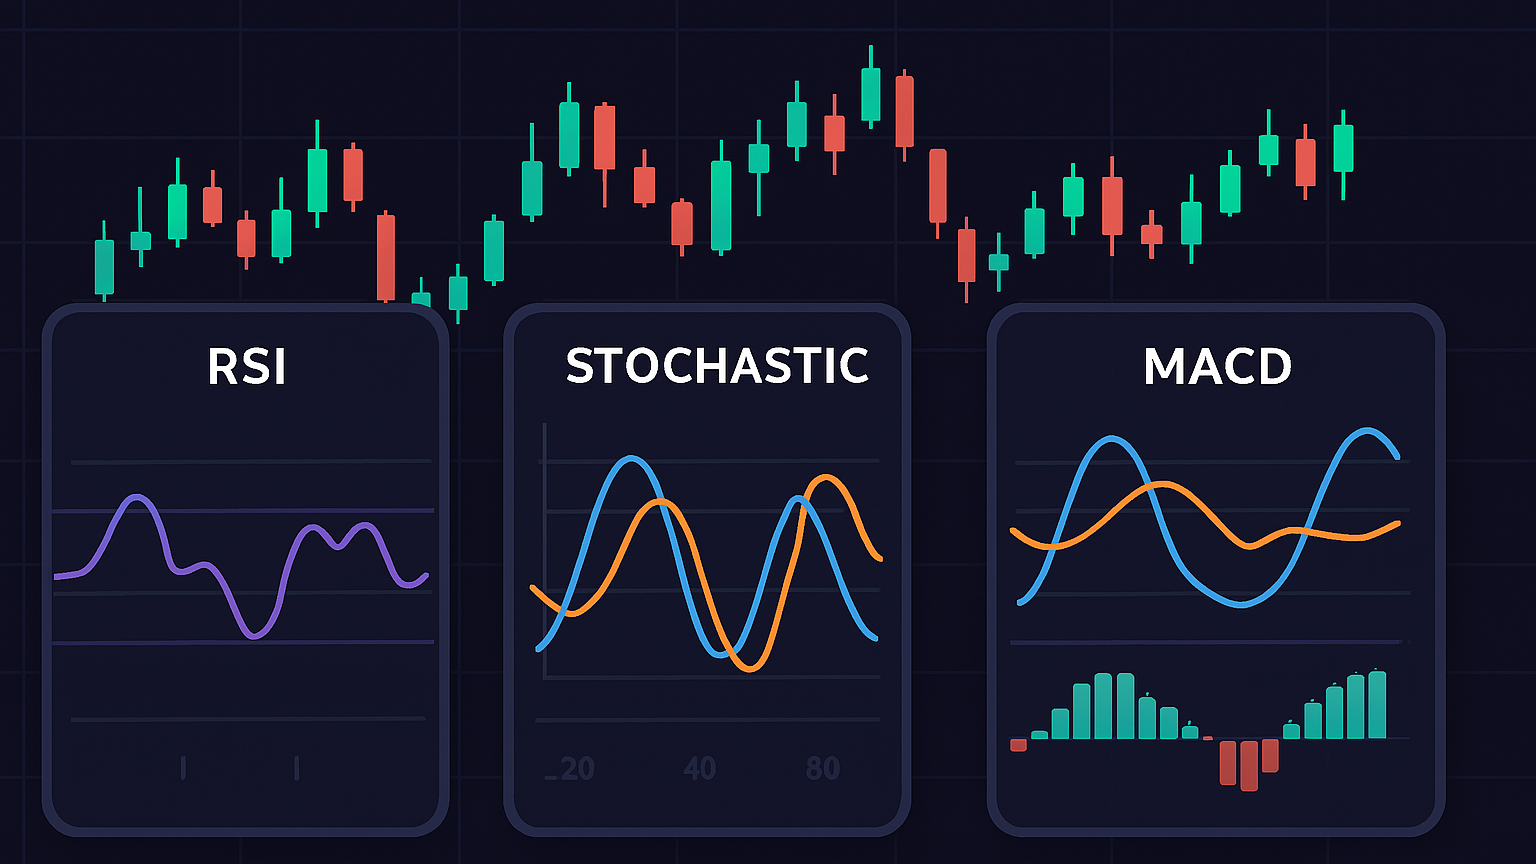
Momentum and volume indicators are useful for confirming rounding patterns. For example, the Relative Strength Index (RSI) helps spot overbought conditions in rounding tops and oversold conditions in rounding bottoms.
Here's how some indicators can be applied:
| Indicator Type | Purpose | Application |
|---|---|---|
| RSI | Momentum confirmation | Look for divergence with price action |
| Volume Profile | Distribution analysis | Monitor volume distribution across levels |
| Moving Averages | Trend validation | Use multiple timeframes for confluence |
These tools can help assess how reliable a pattern is and guide practical trading decisions.
Pattern Success Factors
The success of rounding patterns depends on market conditions and how the pattern forms. Research shows rounding bottoms succeed 66% of the time when the price trends upward into the pattern. Key elements to watch include:
- Formation Time: Patterns usually take 8–12 weeks to fully develop.
- Volume Behavior: Look for decreasing volume during the base and a surge at the breakout.
- Market Context: Patterns forming against strong trends may require extra confirmation.
Pattern Examples
Pay attention to clear volume trends and ensure the formation time is adequate. For example, LuxAlgo offers advanced technical indicators on TradingView, including their Price Action Concepts (PAC) toolkit and Oscillator Matrix, which help traders effectively identify rounding patterns and divergence.
Steps to follow:
- Confirm the pattern with a volume spike at the breakout.
- Use higher timeframes for more dependable patterns.
- Wait for a breakout candlestick pattern before entering trades.
Conclusion
Main Points Summary
Rounding tops and bottoms are key indicators of trend reversals. To trade these patterns effectively, you need to analyze both price action and volume behavior.
| Pattern Type | Key Characteristics | Trading Action |
|---|---|---|
| Rounding Top | Dome shape, declining volume | Short when support breaks |
| Rounding Bottom | U shape, rising volume | Long when resistance breaks |
These patterns tend to work best on daily and weekly charts, offering reliable signals when properly identified.
Implementation Guide
To incorporate these patterns into your trading strategy, follow these steps:
-
Validate the Pattern
Confirm the rounding top or bottom on daily or weekly charts, ensuring volume trends align with the pattern. -
Manage Risk Effectively
- Place stop-loss orders above the peak for rounding tops or below the trough for rounding bottoms.
- Set price targets based on the pattern's height.
- Use trailing stops to secure profits as the trade progresses.
-
Combine with Other Tools
- Leverage indicators like RSI, MACD, and momentum tools for additional confirmation.
- Analyze volume patterns to verify the setup.
- Watch for divergence in momentum indicators to strengthen your analysis.
Patience is crucial—wait for the pattern to fully form and for a breakout to be confirmed. These patterns are most effective in strong trending markets, where the likelihood of success increases significantly.


