
Learn how to use the RSI indicator for identifying market reversals and entry points through key levels, divergence, and effective trading strategies.
The Relative Strength Index (RSI) is a widely used indicator in trading to spot potential market reversals and entry points. This momentum oscillator, ranging from 0 to 100, highlights overbought and oversold conditions, helping traders make informed decisions. Here's what you need to know:
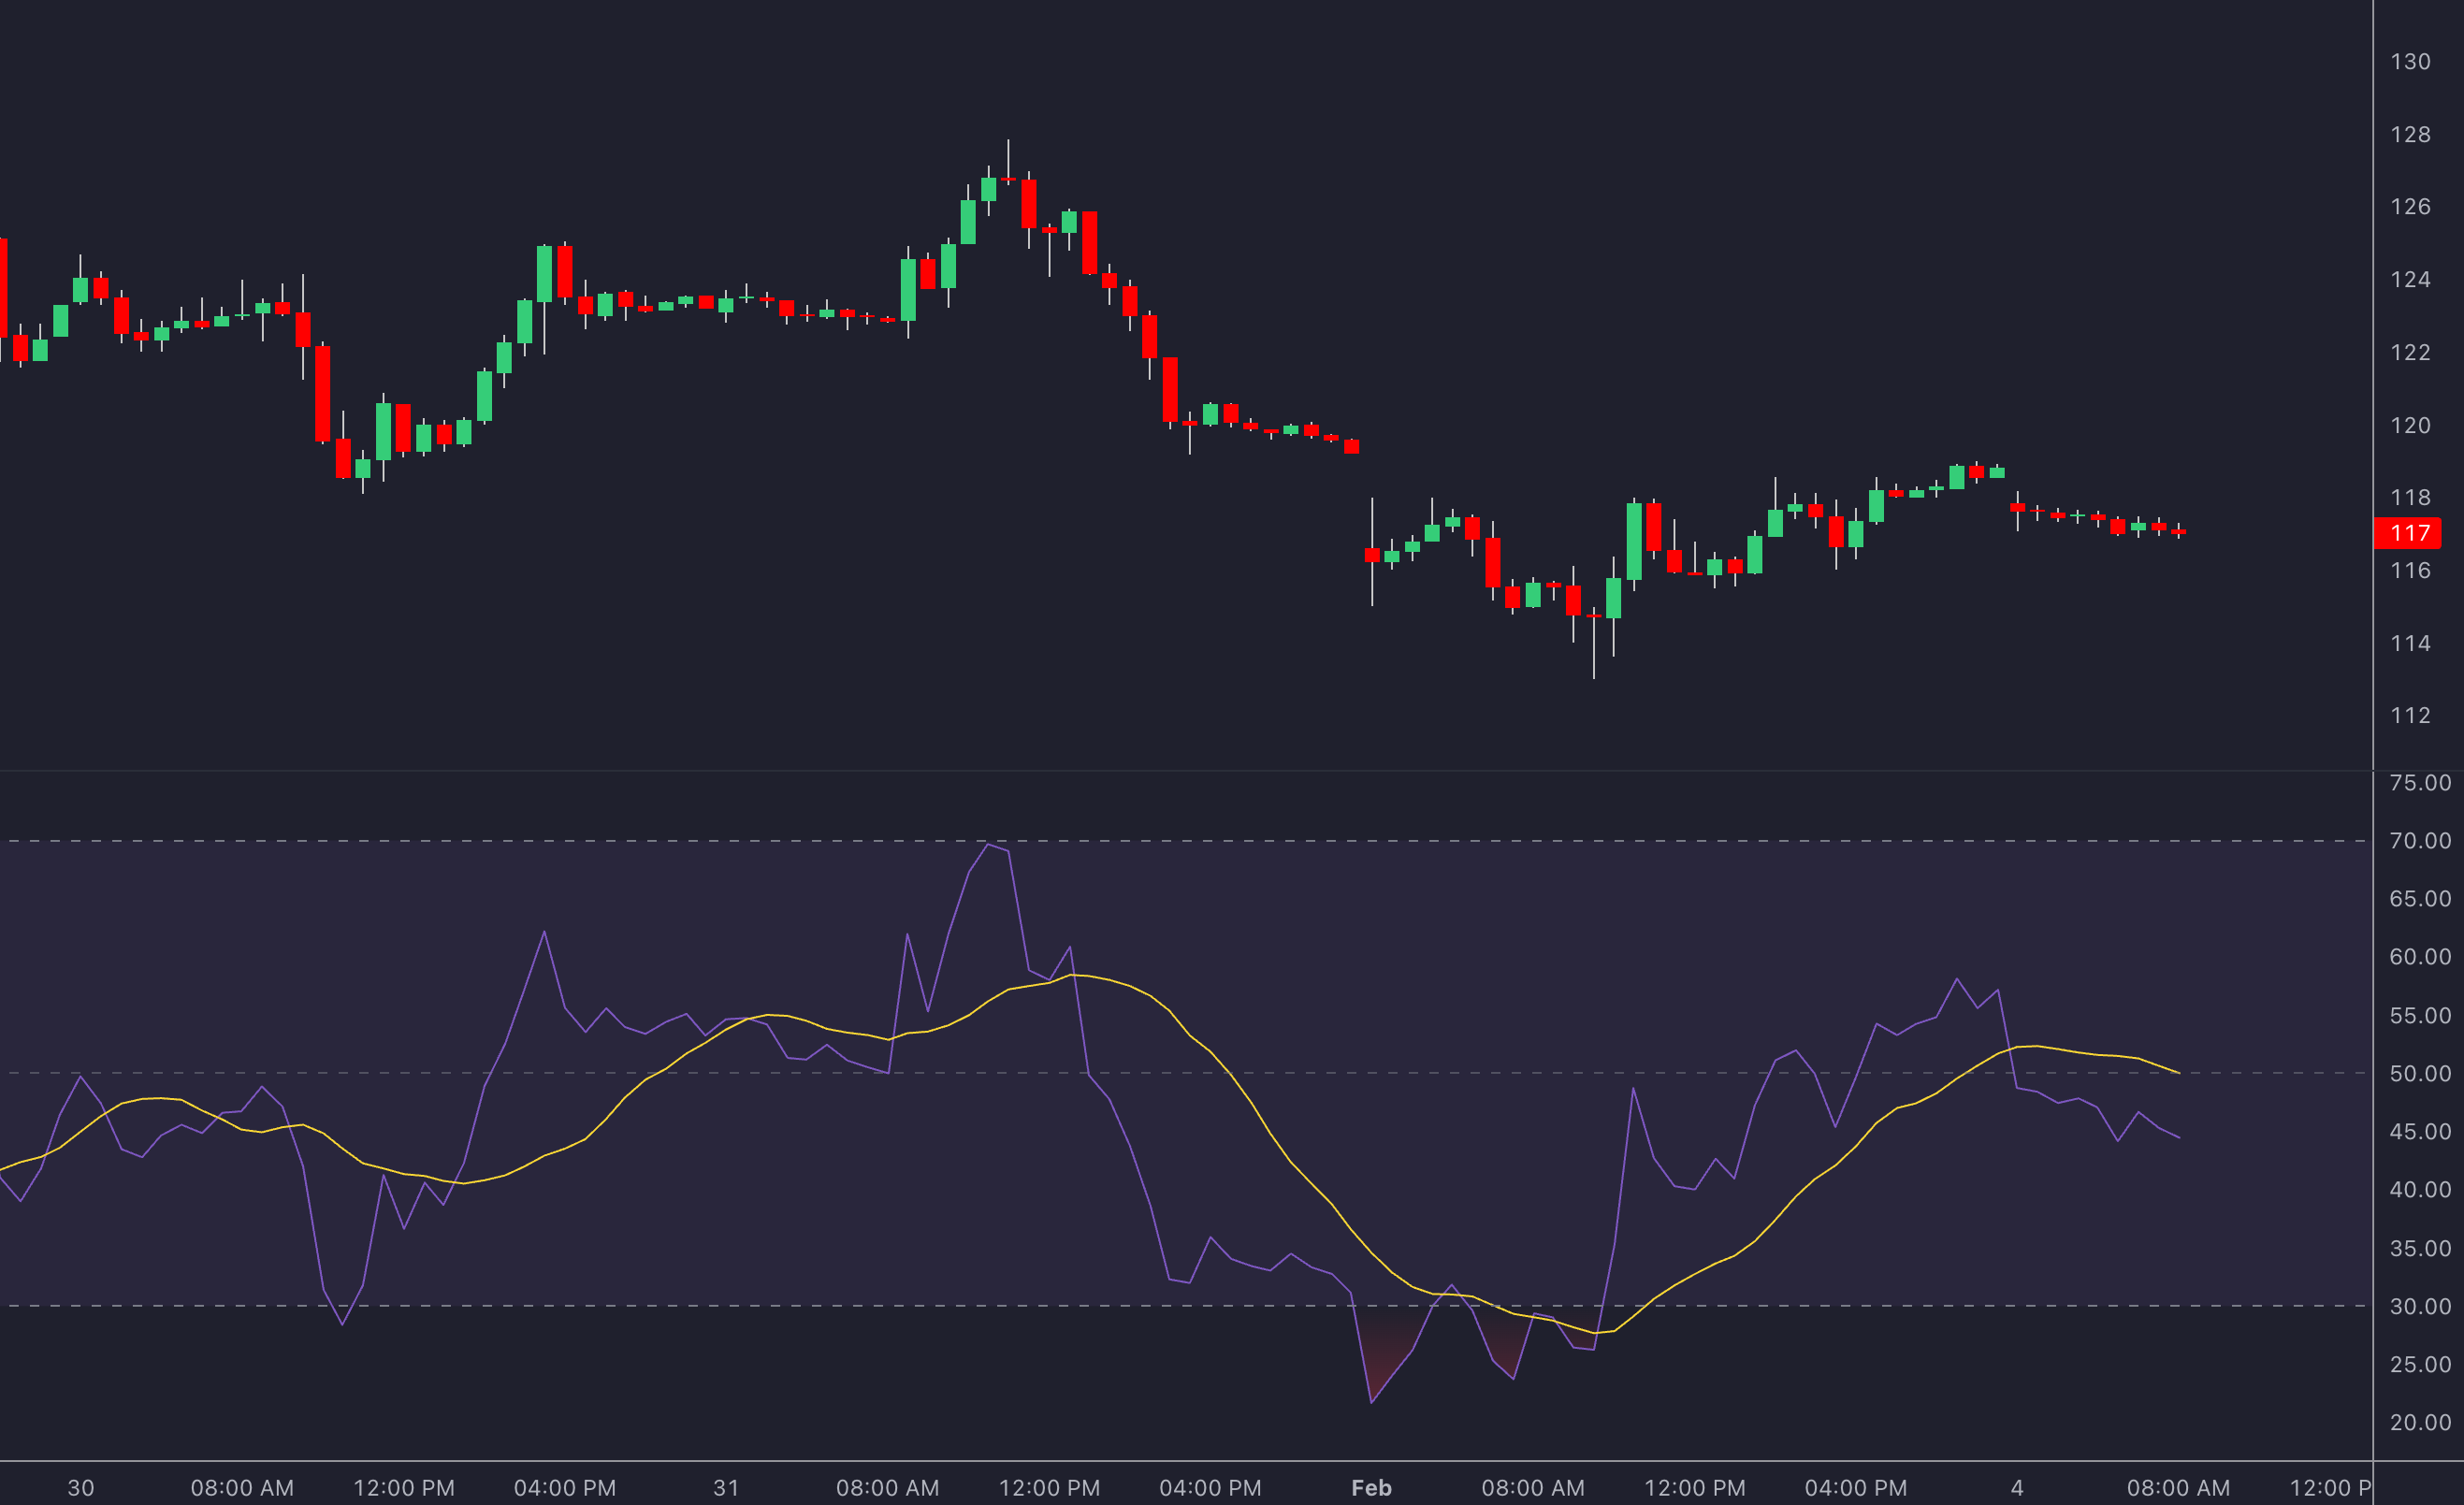
- Key Levels: RSI above 70 suggests overbought conditions (potential sell), while below 30 indicates oversold conditions (potential buy). These levels can be adjusted based on market trends.
- Divergence: A mismatch between RSI and price movement can signal a trend reversal. For example, bullish divergence occurs when price makes a lower low, but RSI forms a higher low.
- Crossovers: RSI crossing key levels (e.g., 30, 50, 70) can indicate momentum shifts. Combining these with other indicators like MACD or volume enhances accuracy.
- Multiple Timeframes: Use daily RSI for trend direction and shorter timeframes for precise entries.
RSI is especially effective in ranging markets and can be customized for different trading styles. For better results, pair RSI with moving averages or price patterns. Backtesting on TradingView, along with advanced trading indicators, can further refine your strategies.
How to Actually Trade with RSI: The Real Way
RSI Entry Signal Mechanics
The RSI is a powerful indicator for spotting reversals and momentum changes. Here’s how its entry signals work:
RSI Overbought and Oversold Levels
| RSI Reading | Market Condition | Potential Signal |
|---|---|---|
| Above 70 | Overbought | Possible short entry |
| 30-70 | Neutral | No clear signal |
| Below 30 | Oversold | Possible long entry |
These levels aren't set in stone. Traders often tweak them based on market trends. For example, in strong uptrends, overbought levels might shift to 80, while in strong downtrends, oversold levels could drop to 40.
Price and RSI Divergence
Divergence happens when the RSI and price action don’t align, often hinting at a trend reversal. There are two main types:
Bullish Divergence:
- Price creates a lower low.
- RSI forms a higher low.
- Suggests downward momentum is fading.
- Could signal a long entry.
Bearish Divergence:
- Price makes a higher high.
- RSI shows a lower high.
- Indicates upward momentum is losing strength.
- Could signal a short entry.
To confirm divergence, look for supporting price action or breaks in support/resistance levels [3].
RSI Level Crossovers
Certain RSI crossovers are particularly useful:
- Centerline (50-level) crosses: Indicate shifts in momentum.
- Recovery crosses above 30: Suggest potential bullish moves.
- Breakdown crosses below 70: Hint at possible bearish moves.
For stronger signals, combine crossovers with volume analysis and MACD confirmation [5]. For instance, bullish crossovers gain importance when paired with rising volume and MACD alignment.
"In strong uptrends, the RSI often remains above 30 and frequently reaches 70, while in strong downtrends, the RSI often remains below 70 and frequently reaches 30" [5].
These crossover signals naturally connect to the combination strategies covered in later sections.
TradingView RSI Setup Guide

Setting up RSI on TradingView is simple and ensures you can effectively spot key trading signals like oversold/overbought levels and divergence patterns.
RSI Chart Setup Steps
Follow these steps to configure the RSI indicator:
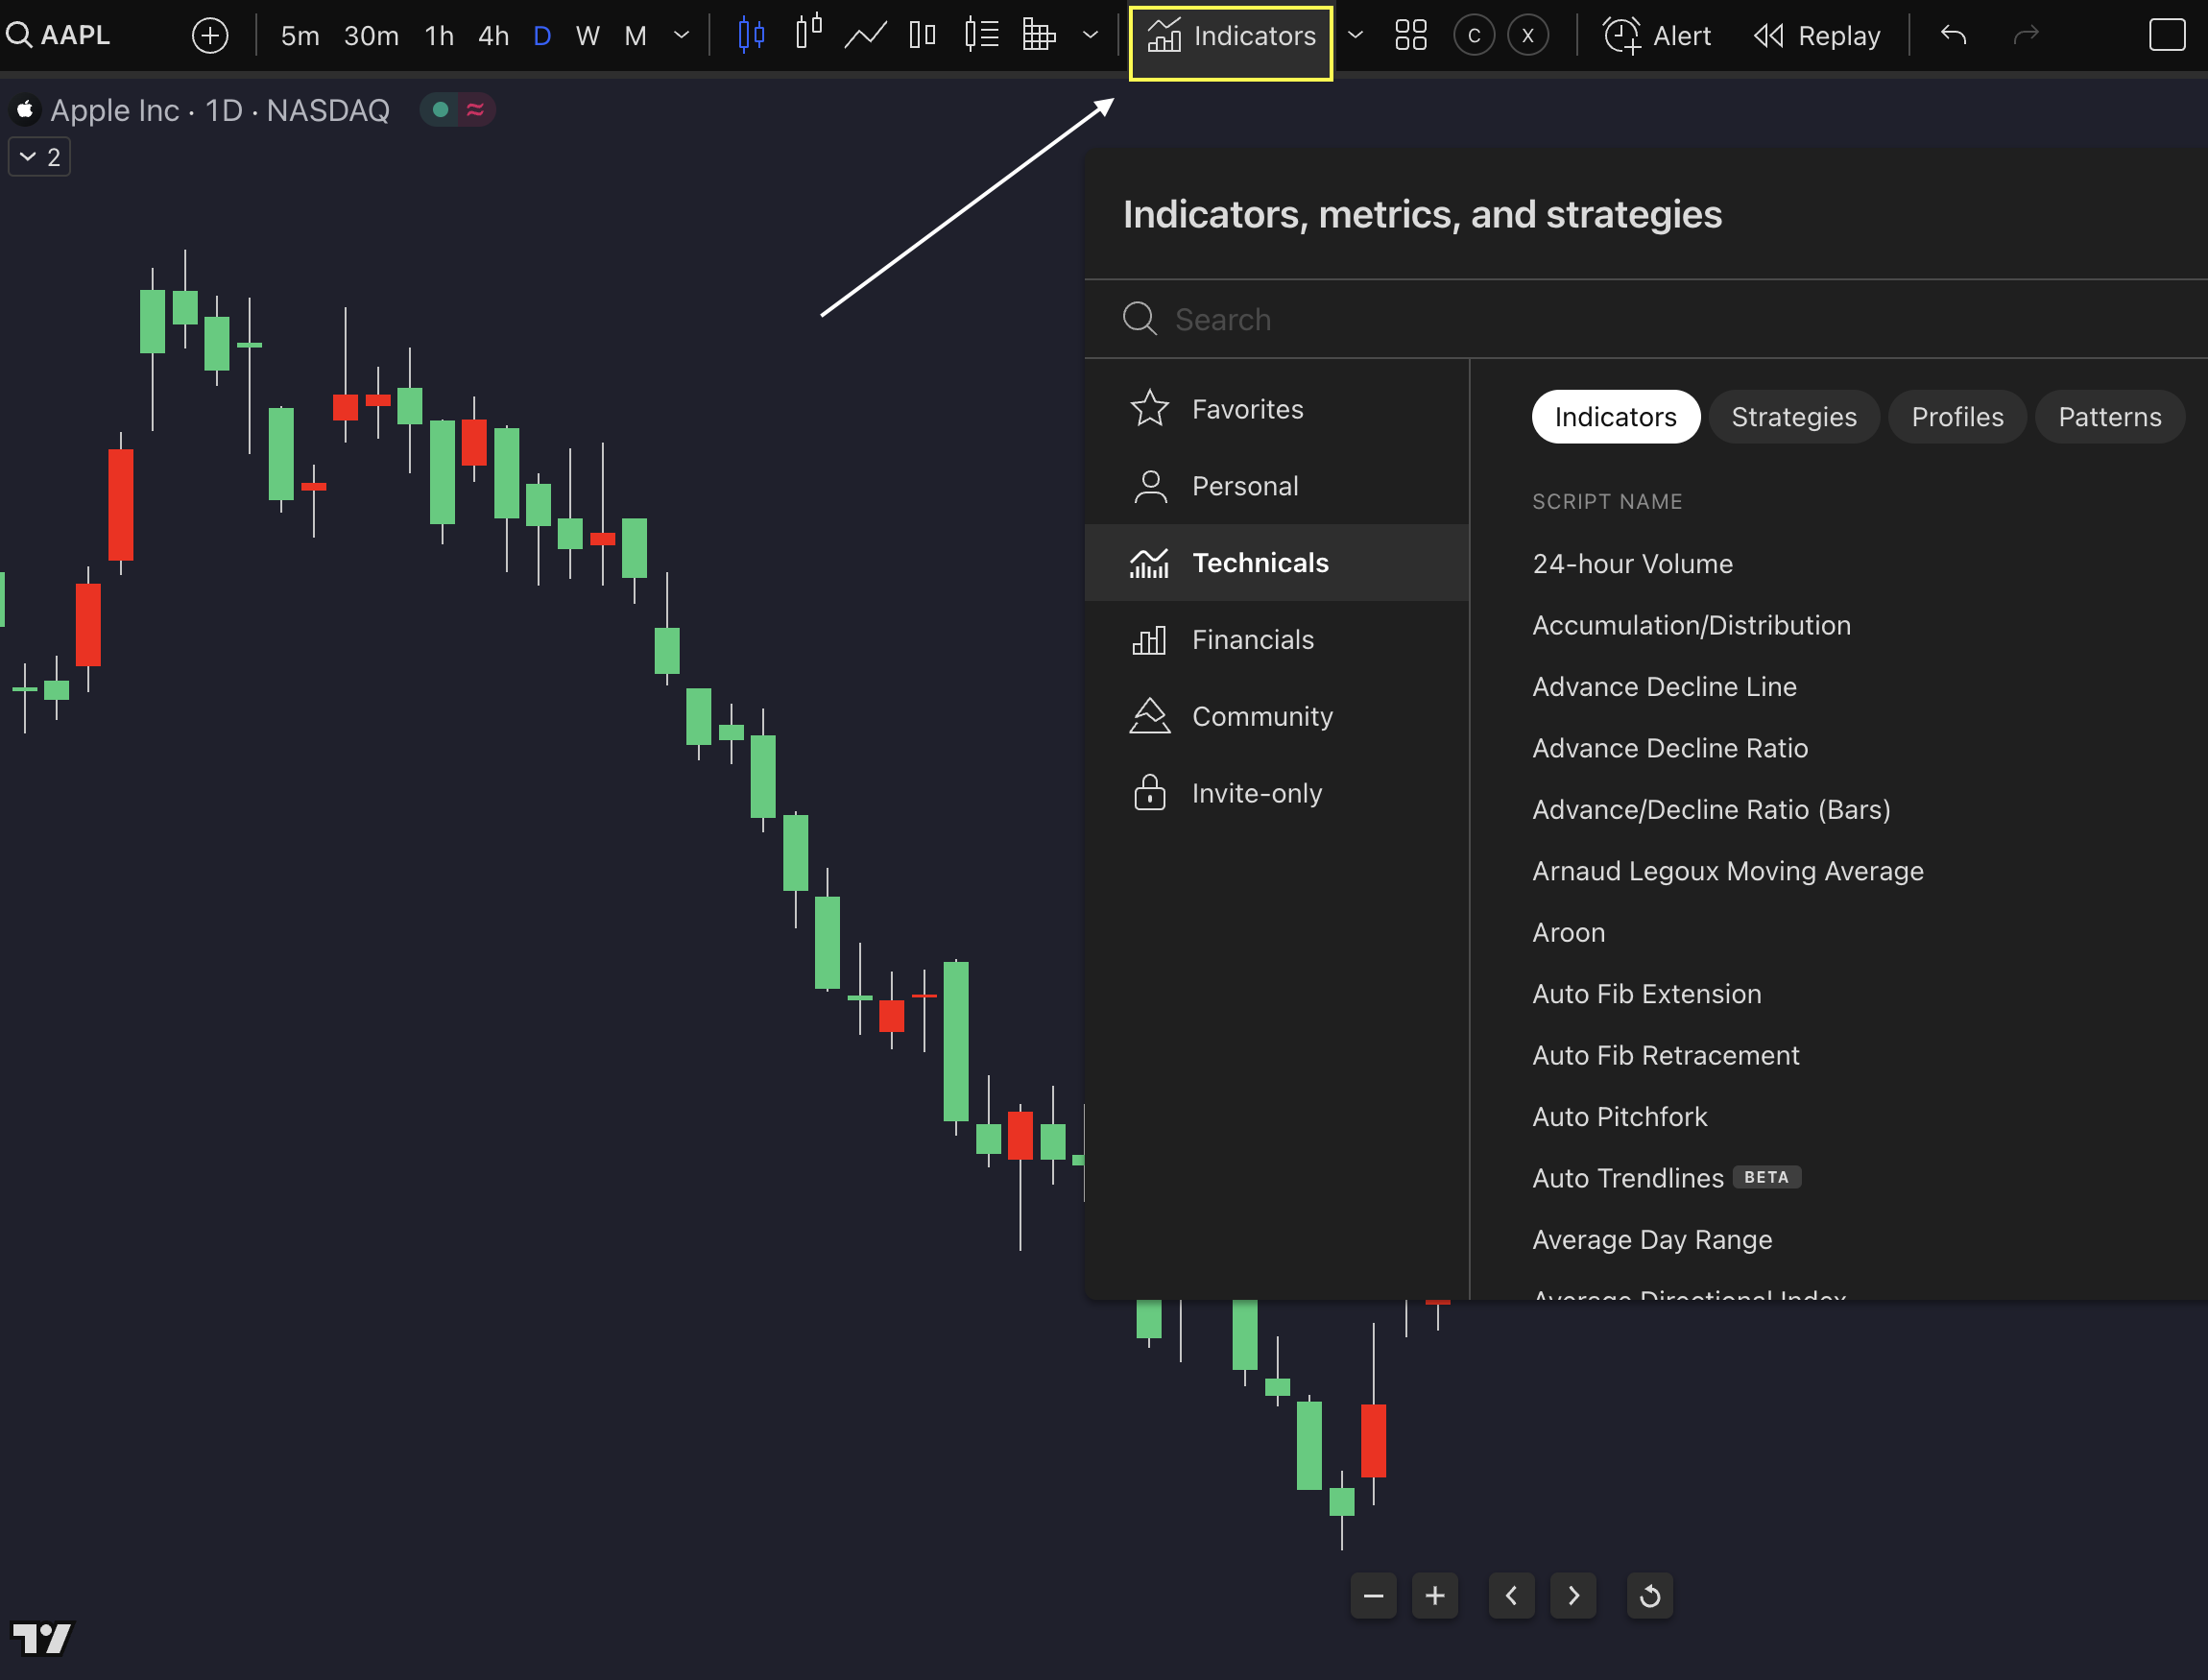
- Open a TradingView chart and add the RSI indicator (shortcut: Ctrl+I).
- Right-click on the RSI and select Settings. Adjust the following:
- Length: Default is 14, but you can modify it (e.g., 9 for day trading or 21 for swing trading).
- Source: Default is set to Close.
- Bands: Typically set at 70 (overbought) and 30 (oversold).
Customizing these settings helps tailor RSI for different trading styles and strategies.
Reading RSI Signals
When analyzing RSI, focus on these key points:
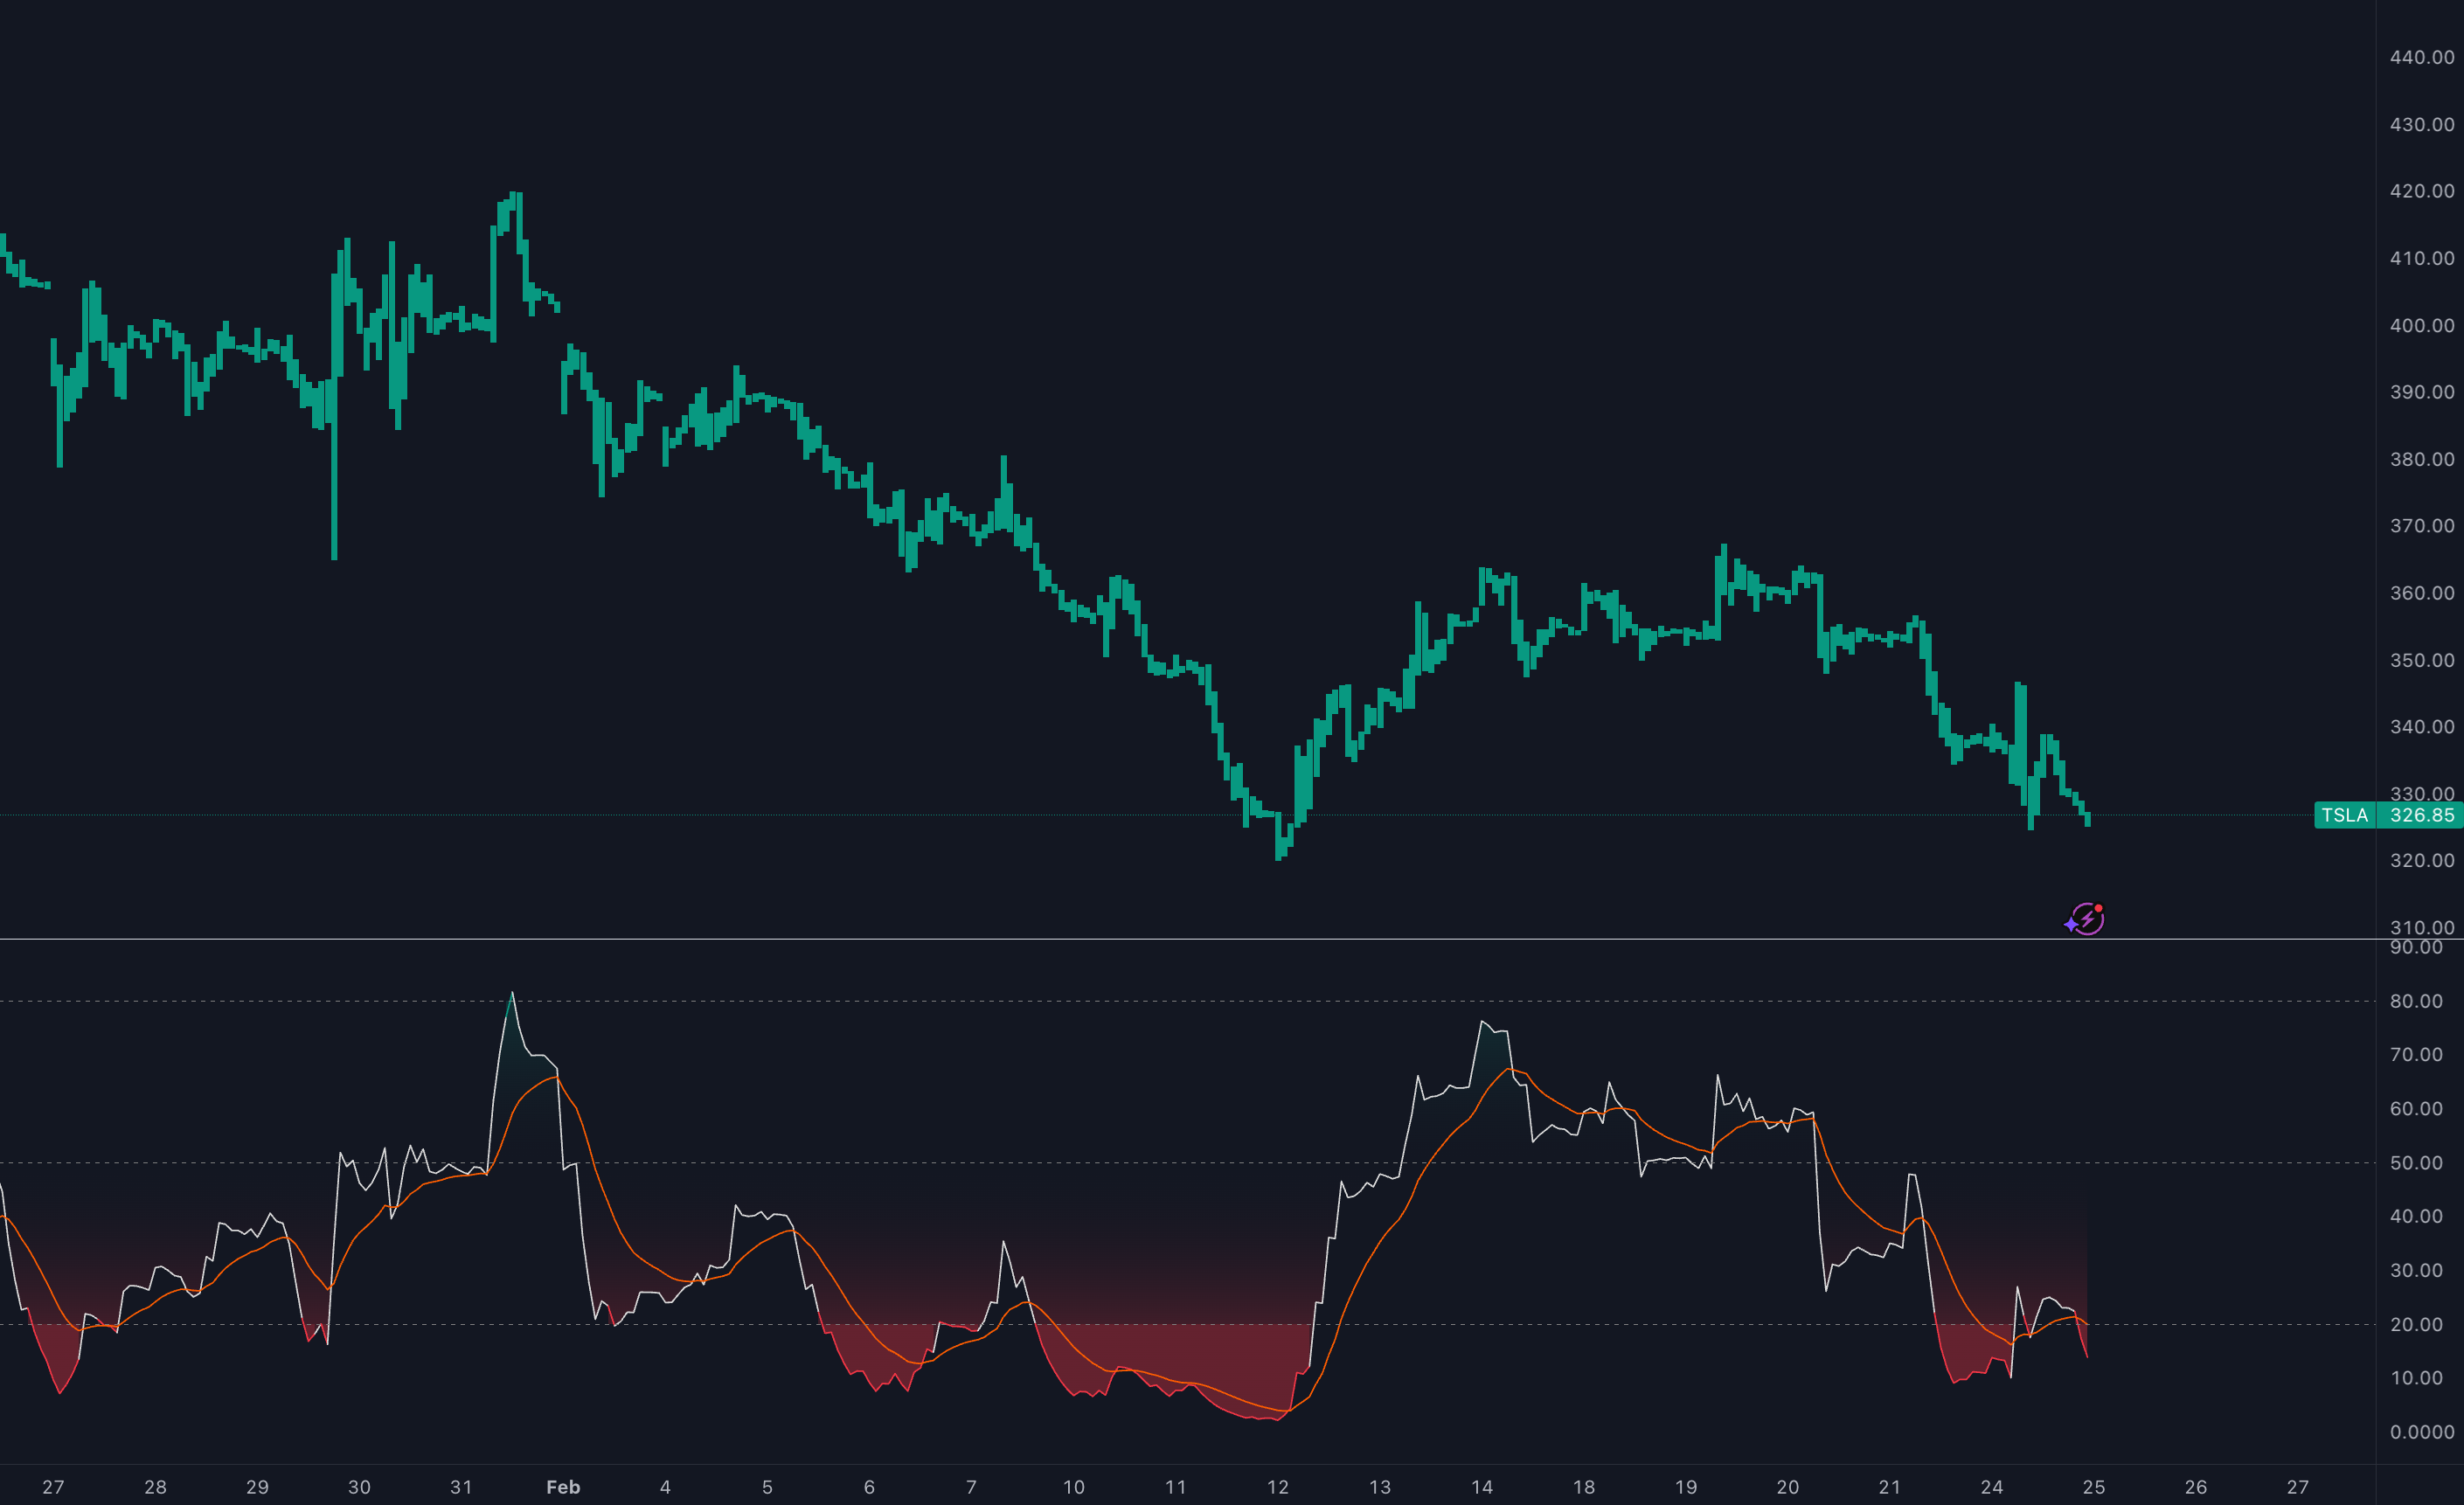
- Watch for levels crossing above 70 or below 30 to identify potential overbought or oversold conditions.
- Use the 50 centerline as a momentum gauge – above 50 often signals bullish momentum, while below 50 suggests bearish trends.
- Look for divergences (when price movement and RSI direction don't match) to spot potential reversals.
RSI with Other Indicators
RSI works best when combined with other indicators. For example:
- Pair RSI with a 200-day moving average (MA) to determine the overall trend direction.
- Add volume analysis to confirm the strength of potential signals.
RSI Trading Methods
To take RSI trading to the next level, traders often combine it with other analysis techniques. This approach adds layers of confirmation and, in some cases, automation to improve trade accuracy.
Multiple Timeframe RSI
Using multiple timeframes can provide a clearer picture of the market. Here's how it works:
Start with the daily RSI to determine the overall trend. Then, use shorter timeframes, like hourly or 15-minute charts, to find precise entry points. Studies show this method can improve win rates by 15-20% compared to relying on a single timeframe [1].
For instance, in an uptrend:
- A daily RSI above 50 signals bullish momentum.
- An hourly RSI dipping below 30 could highlight a potential buying opportunity.
RSI Combined with Price Patterns
Pairing RSI with price patterns can significantly boost trading success. Research suggests this combination can increase trade success rates by 25-30% [2].
Here are two effective strategies:
- Support and Resistance Levels: Focus on established support zones when RSI indicates oversold conditions.
- Candlestick Patterns: Look for strong reversal candlestick formations, especially when RSI shows divergence from price movements.
RSI Strategy Testing
To test RSI strategies effectively, you need a clear process to validate signals and improve results. With TradingView's Strategy Tester and advanced backtesting features, you can analyze and refine your approach with precision.
TradingView RSI Testing
TradingView makes it easy to test strategies across various market conditions and assets while offering detailed performance insights. Here's a quick breakdown of the process:
- Open the Strategy Tester and create a new strategy.
- Define entry rules based on RSI thresholds.
- Set position sizing and risk management parameters.
- Choose a timeframe and run your backtest.
Key Performance Metrics
| Metric | Target Benchmark |
|---|---|
| Win Rate | 63% |
| Profit Factor | >1.5 |
| Max Drawdown | <20% |
| Sharpe Ratio | >1.0 |
A strong RSI strategy often achieves a profit factor above 1.5 and keeps drawdowns below 20%. These benchmarks allow you to make informed adjustments as discussed in the RSI Trading Methods section.
Conclusion
Main Points
Extreme RSI readings – those below 30 or above 70 – are relatively rare, occurring only 20.4% of the time. Specifically, readings below 30 happen 9.2% of the time, while those above 70 occur 11.2% [6].
For effective RSI trading, consider these key techniques:
- Dynamic Level Adjustment: Tailor RSI thresholds to fit specific market conditions and assets, as detailed in the RSI Overbought and Oversold Levels section.
- Divergence Analysis: Look for discrepancies between price movements and RSI patterns to anticipate potential trend shifts.
- Multi-Timeframe Analysis: Verify RSI signals by examining them across different timeframes for stronger confirmation.
Implementation Steps
To apply RSI strategies effectively, follow these steps:
| Phase | Action |
|---|---|
| Setup | Adjust RSI settings to align with your trading style. |
| Analysis | Combine RSI with other indicators to strengthen your strategy. |
| Validation | Backtest your approach under various market conditions. |
Explore the advanced trading indicators available on TradingView, which streamline this process with automated optimization and validation across multiple markets.
To succeed with RSI trading, it’s essential to combine RSI signals with tools like MACD crossovers and broader market analysis for a more comprehensive approach [5].
Ultimate RSI
Traders who want to take the RSI to the next level might be interested in the Ultimate RSI from LuxAlgo. This enhanced version builds on traditional RSI signals to offer deeper insights and improved signal accuracy.
FAQs
How does the RSI indicator work?
The Relative Strength Index (RSI) helps identify overbought or oversold market conditions by analyzing the magnitude of recent price changes over a set period, usually 14 days. When the RSI goes above 70, it indicates overbought conditions, and when it drops below 30, it signals oversold conditions.
What is the RSI 30-70 strategy?
The RSI 30-70 strategy focuses on these key levels to spot potential trading opportunities. An RSI below 30 points to oversold conditions, hinting at a potential buy, while an RSI above 70 suggests overbought conditions, signaling a possible sell.
Here are some tips for applying this strategy:
- Wait for the RSI to move back above 30 before considering a long position.
- Look for confirmation through candlestick patterns.
- Factor in the overall market trend to add context to the signals.
- Use multiple timeframes to confirm your entry points.
What is the 70/30 RSI strategy?
The 70/30 RSI strategy is a variation that involves adjusting the overbought and oversold levels based on market trends. For instance, in a strong uptrend, the overbought level might be raised to 80, and in a downtrend, the oversold level could be lowered to 20. These adjustments aim to minimize false signals and are aligned with the dynamic level adjustments discussed in the RSI Overbought and Oversold Levels section [7].


