Learn the key features, entry rules, and trading strategies for the shooting star candlestick pattern, a reliable bearish reversal indicator.
The shooting star candlestick pattern is a bearish reversal signal often seen at the top of an uptrend. It suggests that sellers are taking control, potentially leading to a price drop. Here's what you need to know:
-
Key Features:
- Small real body near the candle's bottom.
- Upper shadow at least 2x the body length.
- Minimal or no lower shadow.
-
When It Works Best:
- Appears after a clear uptrend (3+ bullish candles).
- Forms at key resistance levels with weakening bullish momentum.
- Confirmed by high volume or alignment with other indicators like RSI.
-
Trading Tips:
- Entry: Choose early (at pattern close) or late (after confirmation) based on risk tolerance.
- Stop-Loss: Place 5-10 pips above the candle's high.
- Profit Target: Use support levels, Fibonacci retracements, or measured moves.
LuxAlgo offers advanced features on TradingView that can automate pattern detection, confirm signals across timeframes, and simplify analysis for better execution.
This pattern is most reliable when paired with strong market context and disciplined risk management.
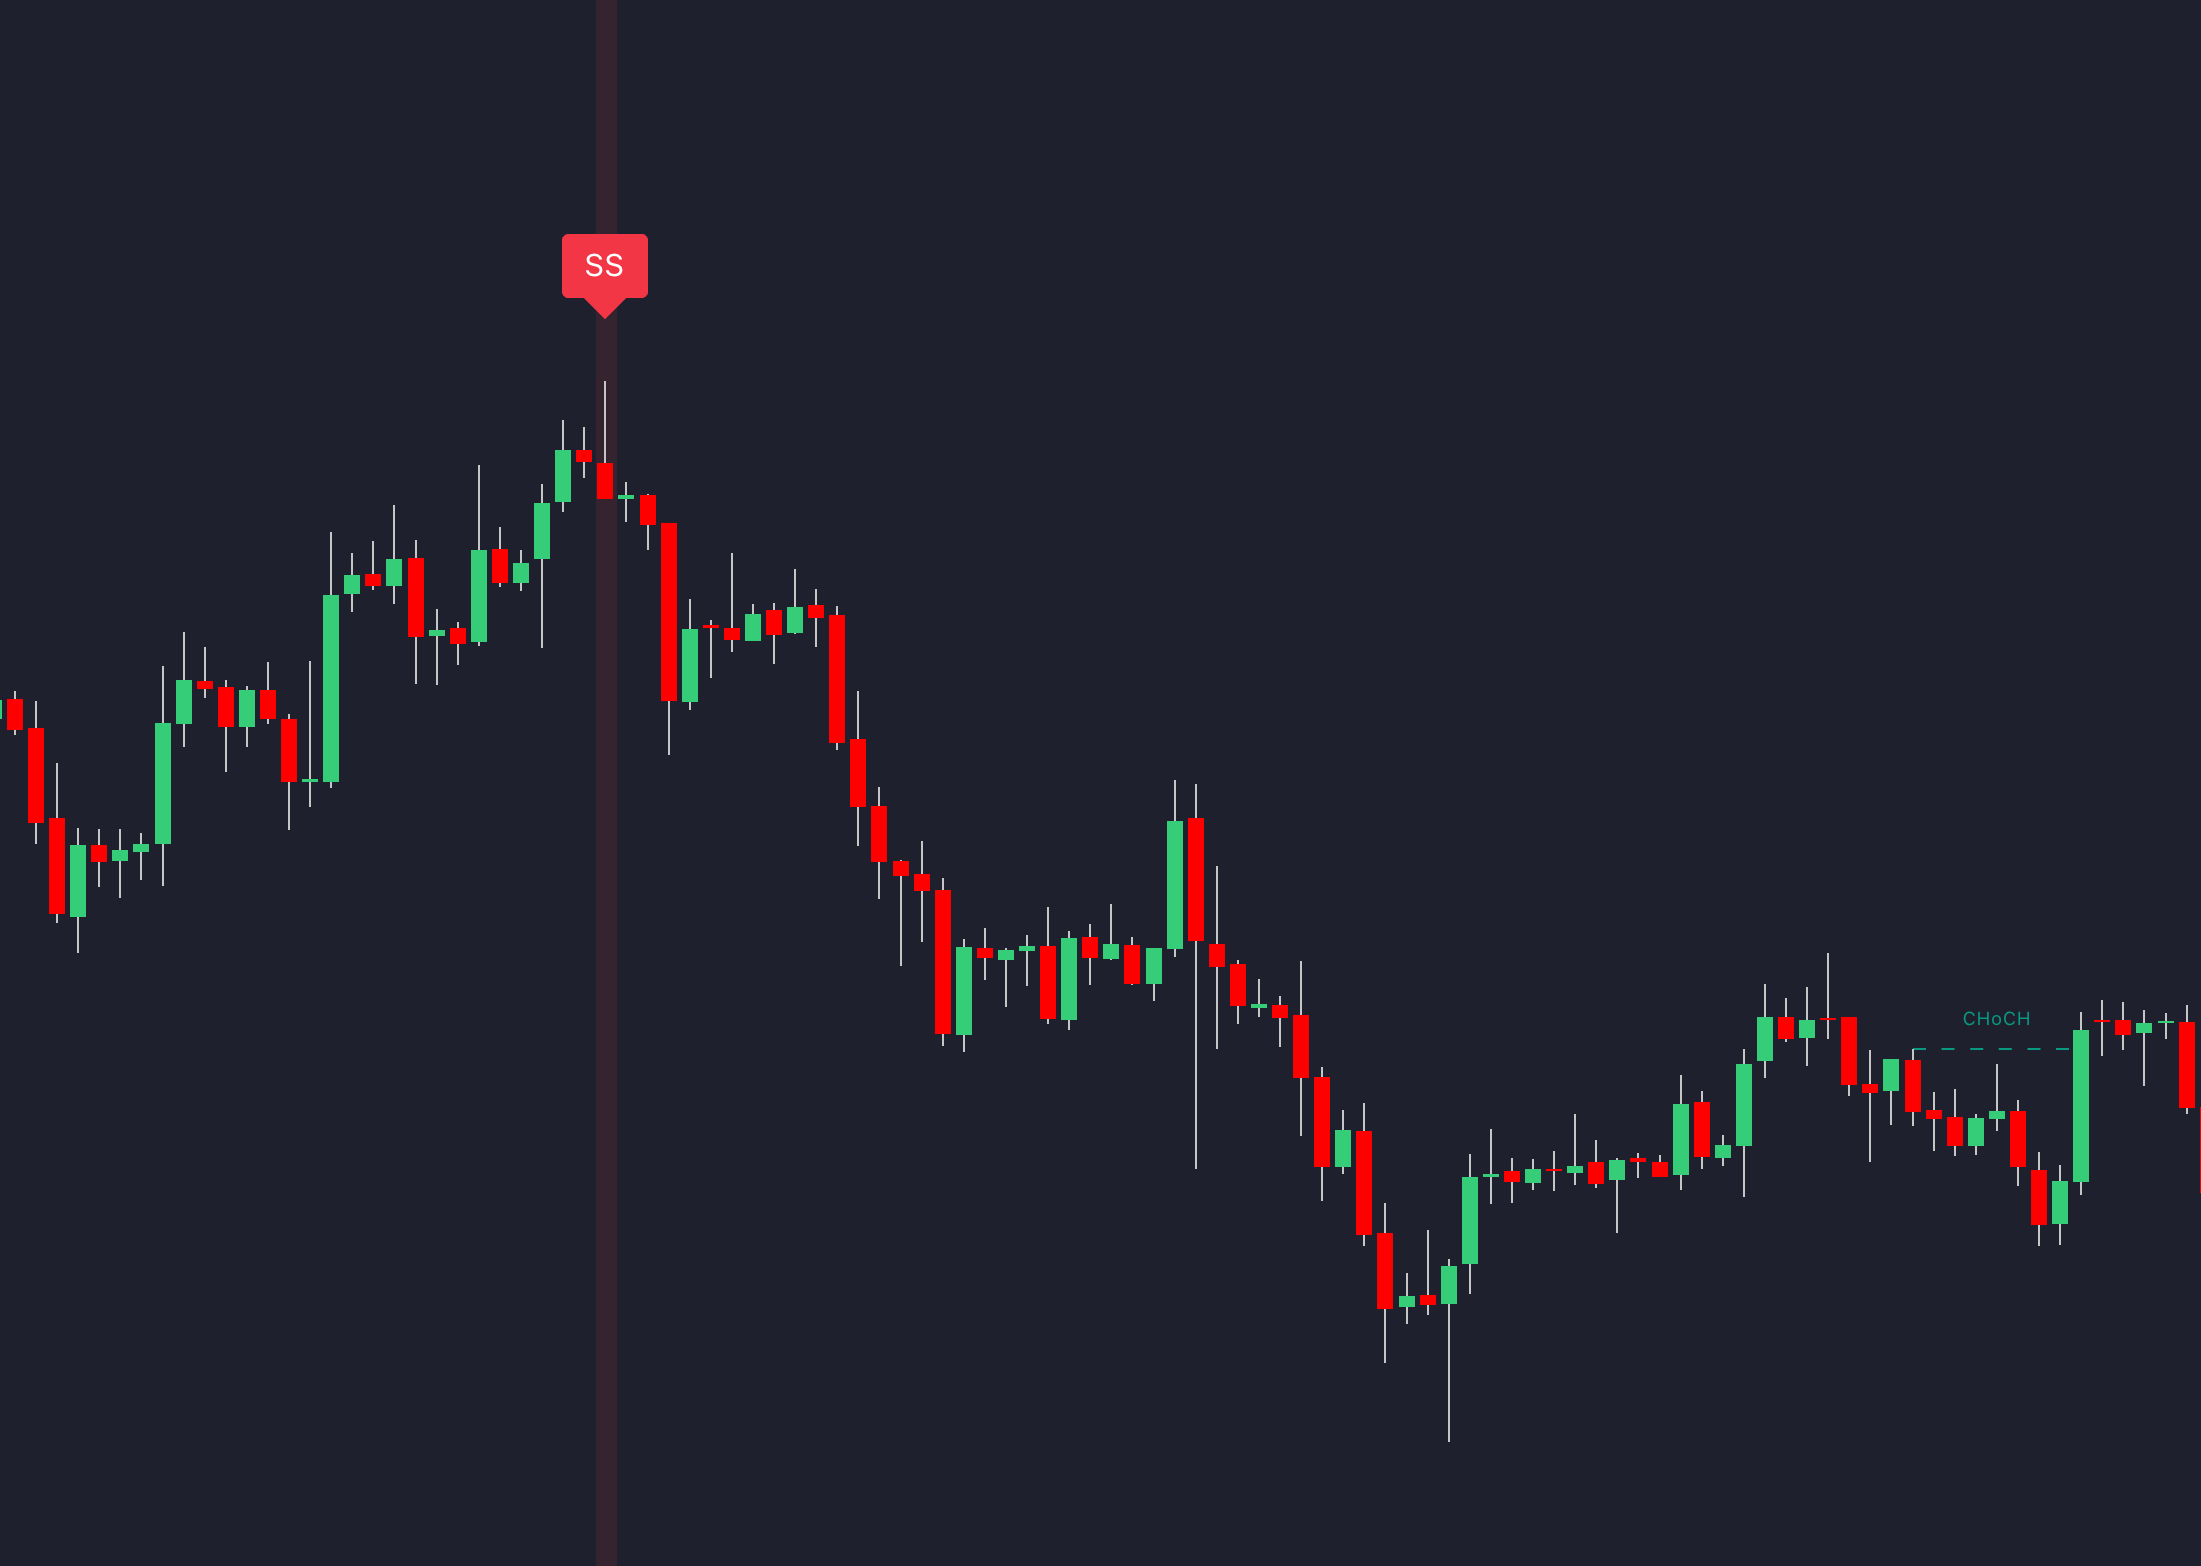
How To Trade The Shooting Star Candlestick Pattern
Pattern Recognition Rules
Identifying shooting star patterns accurately requires strict criteria to differentiate them from similar formations.
Shape and Measurements
For confirmation, ensure these measurements are met: the upper shadow should be at least twice the body length, the body should fall within the lower 25–30% of the candle, and the lower shadow should be minimal [3].
Price Trend Requirements
A shooting star pattern only carries weight when it appears in the right market context, signaling a potential reversal. Key conditions to look for include:
- A clear uptrend, typically marked by three or more bullish candles
- The pattern forming at the peak of the price movement
- Signs of weakening bullish momentum [1][2][4]
LuxAlgo’s multi-timeframe scanner simplifies this process by automatically checking these conditions across various timeframes, helping traders spot valid reversal signals more effectively.
Understanding these requirements lays the groundwork for analyzing entry points, which we’ll cover in Trade Entry Methods.
Pattern Recognition Errors
To avoid common mistakes when identifying shooting star patterns, keep these points in mind:
| Common Mistake | How to Avoid It |
|---|---|
| Confusing it with Inverted Hammer | Verify the market context |
| Misjudging Shadow Length | Measure the ratio of upper shadow to body |
| Ignoring Market Position | Ensure there’s a prior uptrend |
| Overfocusing on Candle Color | Prioritize shape and placement |
The pattern becomes more reliable when it forms at key resistance levels [6]. Accurate recognition is crucial, as it directly affects trade execution, which we’ll discuss further in Stop-Loss and Target Levels.
Trade Entry Methods
Successfully trading the shooting star pattern involves careful planning around entry timing, risk control, and understanding market dynamics.
Early vs. Late Entry Points
When it comes to entering a trade, timing is crucial. Traders can choose between early entries (at the shooting star's close or the next candle's open) and late entries (waiting for further confirmation). Here's how they compare:
| Entry Type | Pros | Cons |
|---|---|---|
| Early Entry | Offers a tighter stop-loss and better risk-reward ratio | Increased chance of false signals |
| Late Entry | Provides clearer confirmation and more reliable signals | Entry price may be less favorable |
For example, entering EUR/USD at 1.1200 (early) offers a tighter stop-loss but carries more risk of a false signal. Waiting for confirmation at 1.1180 (late) may reduce risk but could lower the potential reward.
Stop-Loss and Target Levels
Once you've decided on your entry approach, focus on setting precise stop-loss and profit targets. For stop-losses, aim to place them 5-10 pips above the pattern's high. Profit targets can be identified using these methods:
- Measured Move: Extend the height of the shooting star downward from the entry point.
- Support Levels: Look for previous support zones to set targets.
- Fibonacci Levels: Use retracement levels like 38.2%, 50%, or 61.8% for guidance.
For instance, in a USD/JPY trade where the shooting star’s high is 110.50, you might set a stop-loss at 110.60 and aim for a target at the 109.70 support level [1][4].
Best Trading Conditions
The shooting star pattern works best under specific market conditions that boost its reliability. LuxAlgo can help by providing insights that rate the strength of the pattern and analyze historical success rates. Pairing these insights with multi-timeframe confirmation (covered in the Pattern Confirmation Tools section) can further improve accuracy.
Here are some ideal conditions for spotting high-probability setups:
| Condition | Description | Example |
|---|---|---|
| Strong Uptrend | A clear upward price movement before the pattern | Three or more consecutive bullish candles |
| Volume Confirmation | Higher-than-average volume during pattern formation | 1.5-2x the average volume |
| Technical Confluence | Alignment with other indicators like RSI | RSI above 70 at a resistance level |
| Market Context | Pattern forms at key price levels | Occurs near a previous market high |
The pattern becomes much more effective when these factors align, especially when confirmed by multiple technical indicators [2][5].
Pattern Confirmation Tools
To confirm valid shooting star patterns, use the following tools:
Volume and Price Levels
Look for confirmation with above-average volume, especially spikes that indicate strong selling pressure. Certain price levels can enhance shooting star signals:
| Price Level Type | Description |
|---|---|
| Previous Resistance | Historical price ceilings |
| Round Numbers | Psychological price points |
| Fibonacci Levels | Key retracement zones |
| Moving Averages | Zones where price gets rejected |
These levels are also useful for setting profit targets when paired with the Measured Move method from Stop-Loss and Target Levels.
LuxAlgo Pattern Analysis
LuxAlgo’s Price Action Concepts toolkit offers features to improve shooting star detection, including:
- Automated scoring to gauge pattern reliability
- Indicators for volume spikes that align with patterns
- Custom alerts for setups with high potential
These features complement entry timing strategies, such as those discussed in Early vs. Late Entry Points.
Multiple Timeframe Analysis
Using multiple timeframes ensures a more thorough confirmation process:
| Timeframe Level | Purpose |
|---|---|
| Primary | Confirm overall trend |
| Intermediate | Validate the pattern |
| Entry | Pinpoint the best timing |
When bearish signals align across different timeframes, the likelihood of a successful trade increases. This layered approach helps traders filter out false signals before making entry decisions.
Trading Mistakes to Avoid
Trading the shooting star pattern requires precision and discipline. Here are some common pitfalls traders should steer clear of to improve their chances of success.
Entering Too Early
Data reveals that traders who wait for the shooting star candle to close have a 68% higher success rate than those who jump in early [2].
The main risks include entering before the candle closes, during the formation of the upper shadow, or without confirming volume. Timing is everything, and entering prematurely can lead to poor outcomes.
Ignoring Market Context
Focusing only on the shooting star pattern without considering the bigger picture is a common error. This narrow focus can weaken trading decisions.
To trade effectively, pay attention to factors like established uptrends, key support or resistance levels, and confirming technical indicators. LuxAlgo’s multi-timeframe scanner can help assess these conditions, ensuring trades are aligned with broader market trends.
Weak Risk Management
Failing to manage risk properly can result in significant losses. A structured approach to risk control is critical for consistent performance.
Here are some key guidelines:
- Limit risk to 1-2% of your trading capital per trade.
- Place stop-loss orders just above the shooting star's high.
- Aim for at least a 1:2 risk-reward ratio.
- Use multiple targets and trailing stops to lock in profits.
LuxAlgo’s backtesters can refine your stop-loss levels and position sizing based on historical data, helping you stay disciplined and avoid emotional decisions.
Summary
The shooting star pattern is a dependable indicator of bearish reversals when executed with discipline. Achieving consistent results requires sticking to three key principles.
Pattern Rules Review
For a shooting star pattern to be valid, it needs to meet these criteria:
- Small real body located in the lower 25% of the candle’s range
- Upper shadow at least twice the length of the body
- Minimal lower shadow
These structural features are most effective when paired with the confirmation methods covered in Pattern Confirmation Tools.
LuxAlgo Pattern Tools
LuxAlgo offers features to enhance pattern trading, such as:
- Multi-Timeframe Scanner: Identifies high-probability setups by analyzing patterns across various timeframes
These features align with the trade entry methods and confirmation techniques discussed earlier.
Risk Control Guidelines
Use these parameters alongside the entry timing strategies from Early vs. Late Entry Points to improve execution.
| Risk Parameter | Recommended Setting | Explanation |
|---|---|---|
| Position Size | 1-2% of account risk | Protects trading capital |
| Stop-Loss | Above the pattern’s high | Logical technical placement [2] |
| Profit Target | 2x the risk | Provides a statistical edge [2] |
For the best outcomes, integrate pattern recognition with resistance levels and volume analysis. LuxAlgo’s features simplify this process, helping traders zero in on strong setups while maintaining strict risk management [6].
FAQs
Can a shooting star be green in trading?
Yes, it can. The color of the candle is less important than its overall structure. While red candles often indicate stronger bearish momentum, a green candle can still qualify as a shooting star if it meets these key criteria:
- The upper shadow is at least twice the length of the body.
- The real body is small and positioned in the lower 25% of the candle's range.
- There is little to no lower shadow.
A green shooting star forms when the closing price is higher than the opening price, even though there’s rejection at higher levels (indicated by the long upper shadow). The reliability of the pattern depends more on its formation and context than the color itself.
To strengthen your analysis, look for confirmation through follow-up bearish candles, increased trading volume, and alignment with resistance levels. Using multi-timeframe analysis can also help validate the pattern. For even greater confidence, combine color and structure analysis with LuxAlgo's pattern scoring system, as explained in the Pattern Confirmation Tools section [6][2].


